Zip Codes with the Highest Percentage of Households Without a Vehicle in Saint Paul, MN
RELATED REPORTS & OPTIONS
Households without a Cars
Saint Paul
Compare Zip Codes
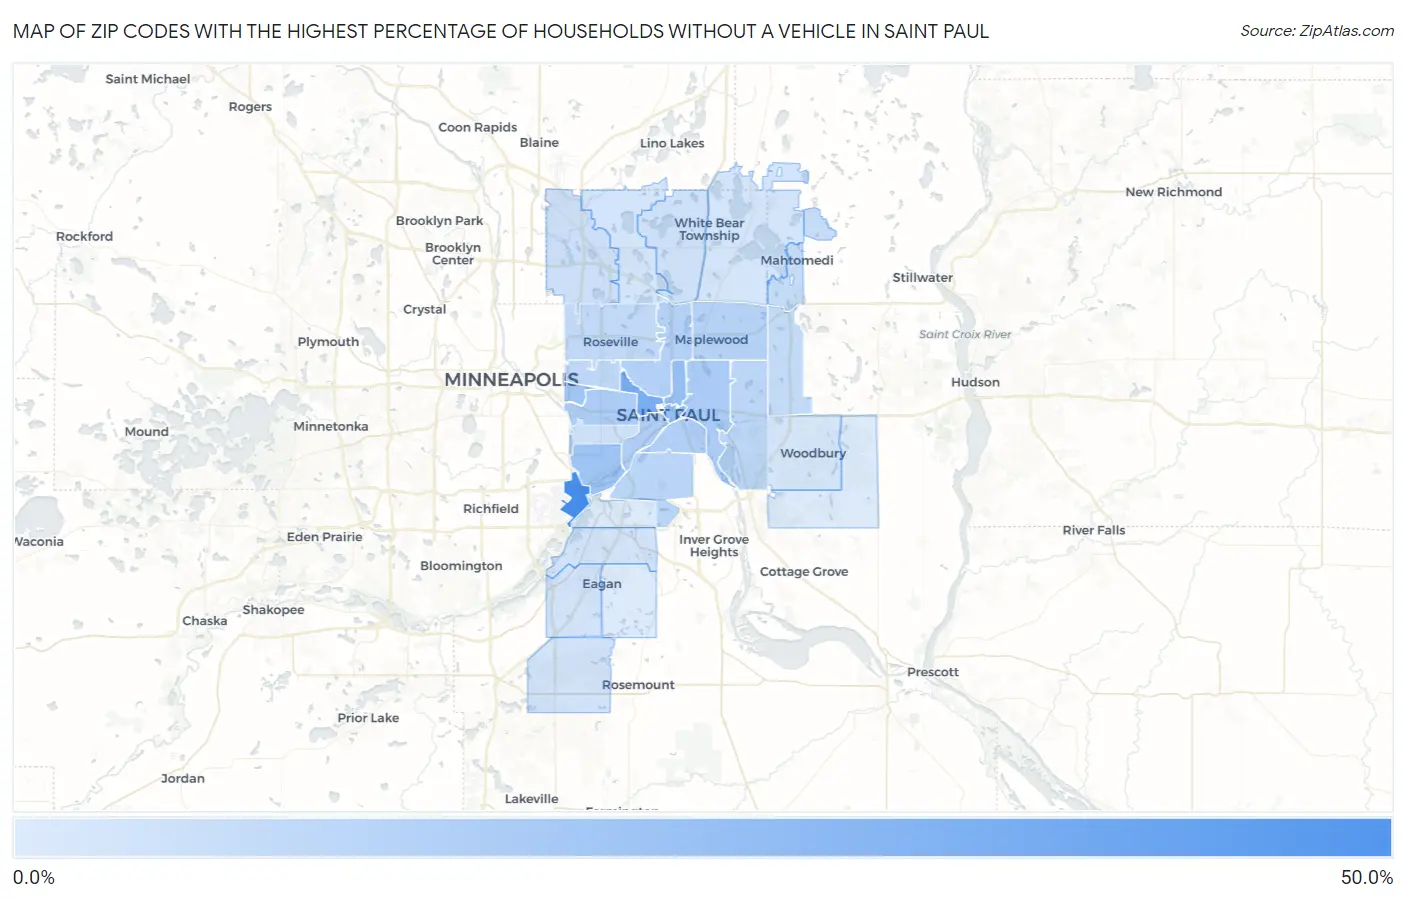
Map of Zip Codes with the Highest Percentage of Households Without a Vehicle in Saint Paul
1.4%
42.0%
Zip Codes with the Highest Percentage of Households Without a Vehicle in Saint Paul, MN
| Zip Code | Housholds Without a Car | vs State | vs National | |
| 1. | 55111 | 42.0% | 6.6%(+35.4)#3 | 8.3%(+33.7)#473 |
| 2. | 55103 | 26.9% | 6.6%(+20.3)#8 | 8.3%(+18.6)#948 |
| 3. | 55101 | 19.9% | 6.6%(+13.3)#14 | 8.3%(+11.6)#1,518 |
| 4. | 55130 | 19.3% | 6.6%(+12.7)#17 | 8.3%(+11.0)#1,593 |
| 5. | 55116 | 16.6% | 6.6%(+10.00)#24 | 8.3%(+8.30)#2,036 |
| 6. | 55114 | 16.1% | 6.6%(+9.50)#27 | 8.3%(+7.80)#2,134 |
| 7. | 55106 | 13.7% | 6.6%(+7.10)#32 | 8.3%(+5.40)#2,799 |
| 8. | 55104 | 12.8% | 6.6%(+6.20)#34 | 8.3%(+4.50)#3,175 |
| 9. | 55102 | 12.3% | 6.6%(+5.70)#41 | 8.3%(+4.00)#3,420 |
| 10. | 55107 | 11.7% | 6.6%(+5.10)#45 | 8.3%(+3.40)#3,718 |
| 11. | 55117 | 11.5% | 6.6%(+4.90)#51 | 8.3%(+3.20)#3,817 |
| 12. | 55109 | 10.5% | 6.6%(+3.90)#60 | 8.3%(+2.20)#4,454 |
| 13. | 55118 | 9.6% | 6.6%(+3.00)#77 | 8.3%(+1.30)#5,194 |
| 14. | 55119 | 9.3% | 6.6%(+2.70)#81 | 8.3%(+1.00)#5,417 |
| 15. | 55108 | 8.4% | 6.6%(+1.80)#110 | 8.3%(+0.100)#6,446 |
| 16. | 55113 | 8.0% | 6.6%(+1.40)#126 | 8.3%(-0.300)#6,904 |
| 17. | 55128 | 7.3% | 6.6%(+0.700)#165 | 8.3%(-1.00)#8,036 |
| 18. | 55115 | 6.8% | 6.6%(+0.200)#185 | 8.3%(-1.50)#8,900 |
| 19. | 55112 | 5.3% | 6.6%(-1.30)#278 | 8.3%(-3.00)#12,061 |
| 20. | 55105 | 4.6% | 6.6%(-2.00)#336 | 8.3%(-3.70)#13,925 |
| 21. | 55127 | 4.4% | 6.6%(-2.20)#353 | 8.3%(-3.90)#14,529 |
| 22. | 55124 | 4.3% | 6.6%(-2.30)#362 | 8.3%(-4.00)#14,759 |
| 23. | 55121 | 4.3% | 6.6%(-2.30)#364 | 8.3%(-4.00)#14,881 |
| 24. | 55122 | 4.0% | 6.6%(-2.60)#384 | 8.3%(-4.30)#15,717 |
| 25. | 55110 | 3.5% | 6.6%(-3.10)#434 | 8.3%(-4.80)#17,316 |
| 26. | 55126 | 3.5% | 6.6%(-3.10)#435 | 8.3%(-4.80)#17,337 |
| 27. | 55125 | 3.1% | 6.6%(-3.50)#476 | 8.3%(-5.20)#18,687 |
| 28. | 55129 | 1.4% | 6.6%(-5.20)#682 | 8.3%(-6.90)#24,424 |
| 29. | 55123 | 1.4% | 6.6%(-5.20)#683 | 8.3%(-6.90)#24,428 |
| 30. | 55120 | 1.4% | 6.6%(-5.20)#687 | 8.3%(-6.90)#24,510 |
1
Common Questions
What are the Top 10 Zip Codes with the Highest Percentage of Households Without a Vehicle in Saint Paul, MN?
Top 10 Zip Codes with the Highest Percentage of Households Without a Vehicle in Saint Paul, MN are:
What zip code has the Highest Percentage of Households Without a Vehicle in Saint Paul, MN?
55111 has the Highest Percentage of Households Without a Vehicle in Saint Paul, MN with 42.0%.
What is the Percentage of Households Without a Vehicle in Minnesota?
Percentage of Households Without a Vehicle in Minnesota is 6.6%.
What is the Percentage of Households Without a Vehicle in the United States?
Percentage of Households Without a Vehicle in the United States is 8.3%.