Zip Codes with the Highest Percentage of Population with a Degree in Engineering in Saint Paul, MN
RELATED REPORTS & OPTIONS
Engineering
Saint Paul
Compare Zip Codes
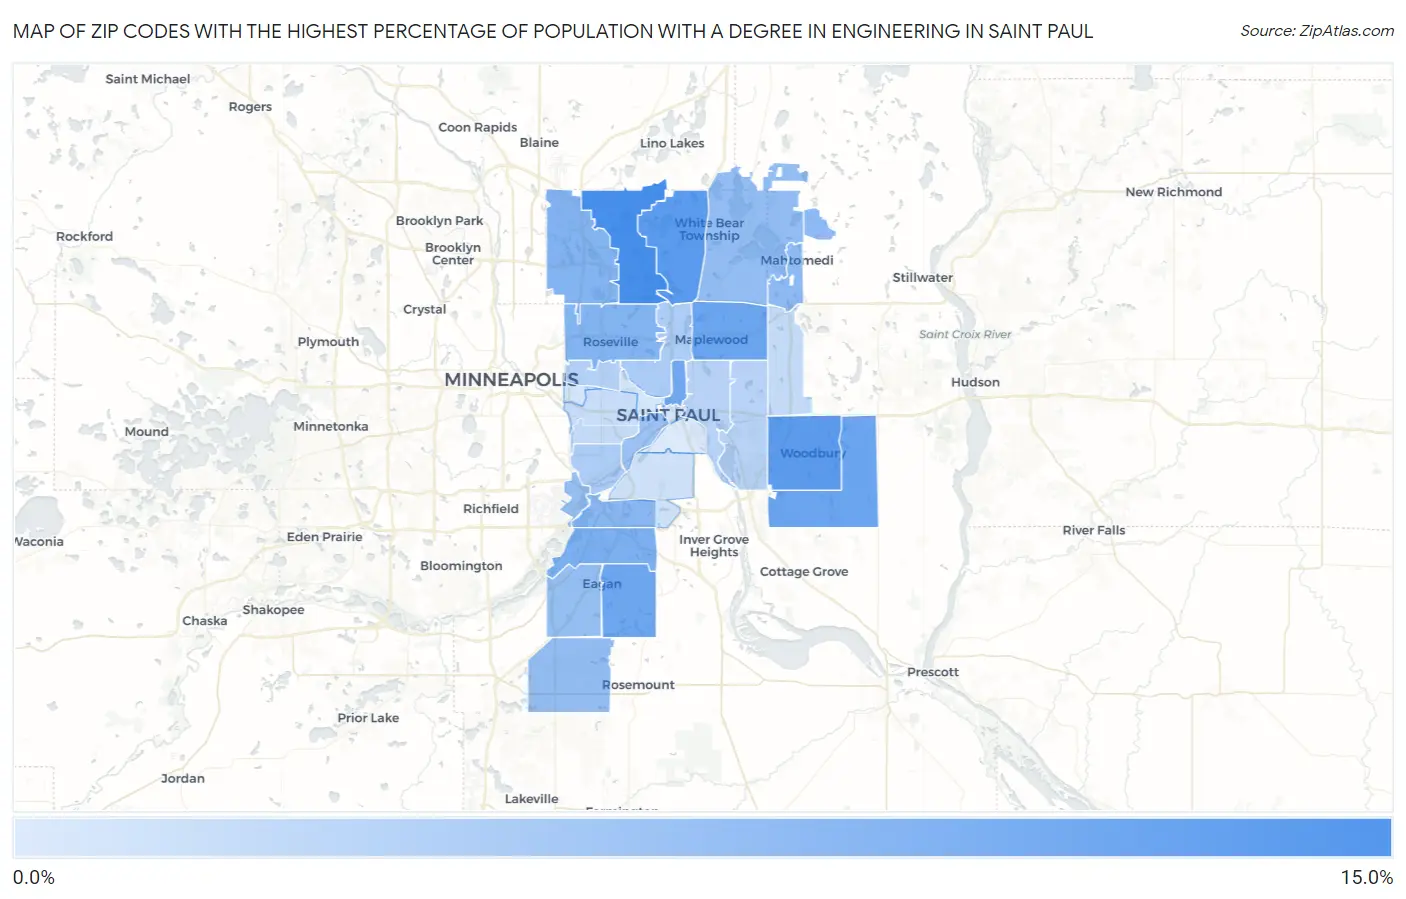
Map of Zip Codes with the Highest Percentage of Population with a Degree in Engineering in Saint Paul
3.1%
11.1%
Zip Codes with the Highest Percentage of Population with a Degree in Engineering in Saint Paul, MN
| Zip Code | % Graduates | vs State | vs National | |
| 1. | 55126 | 11.1% | 6.3%(+4.87)#46 | 7.6%(+3.48)#3,441 |
| 2. | 55127 | 10.1% | 6.3%(+3.85)#61 | 7.6%(+2.46)#4,347 |
| 3. | 55125 | 9.9% | 6.3%(+3.68)#63 | 7.6%(+2.29)#4,505 |
| 4. | 55129 | 9.1% | 6.3%(+2.88)#80 | 7.6%(+1.49)#5,397 |
| 5. | 55109 | 9.1% | 6.3%(+2.81)#84 | 7.6%(+1.42)#5,504 |
| 6. | 55123 | 9.0% | 6.3%(+2.72)#89 | 7.6%(+1.33)#5,632 |
| 7. | 55130 | 8.8% | 6.3%(+2.53)#92 | 7.6%(+1.14)#5,894 |
| 8. | 55121 | 8.2% | 6.3%(+1.91)#112 | 7.6%(+0.519)#6,806 |
| 9. | 55113 | 7.9% | 6.3%(+1.61)#122 | 7.6%(+0.221)#7,333 |
| 10. | 55112 | 7.8% | 6.3%(+1.54)#126 | 7.6%(+0.153)#7,446 |
| 11. | 55120 | 7.5% | 6.3%(+1.20)#142 | 7.6%(-0.193)#8,090 |
| 12. | 55115 | 7.3% | 6.3%(+1.01)#148 | 7.6%(-0.379)#8,451 |
| 13. | 55110 | 7.0% | 6.3%(+0.751)#163 | 7.6%(-0.639)#8,963 |
| 14. | 55124 | 6.9% | 6.3%(+0.687)#165 | 7.6%(-0.702)#9,121 |
| 15. | 55111 | 6.9% | 6.3%(+0.639)#172 | 7.6%(-0.751)#9,223 |
| 16. | 55122 | 6.9% | 6.3%(+0.605)#173 | 7.6%(-0.785)#9,274 |
| 17. | 55102 | 6.5% | 6.3%(+0.230)#197 | 7.6%(-1.16)#10,034 |
| 18. | 55116 | 5.6% | 6.3%(-0.642)#267 | 7.6%(-2.03)#12,162 |
| 19. | 55117 | 5.6% | 6.3%(-0.666)#271 | 7.6%(-2.06)#12,223 |
| 20. | 55108 | 5.1% | 6.3%(-1.18)#307 | 7.6%(-2.57)#13,470 |
| 21. | 55119 | 5.0% | 6.3%(-1.26)#313 | 7.6%(-2.65)#13,693 |
| 22. | 55106 | 5.0% | 6.3%(-1.29)#315 | 7.6%(-2.68)#13,762 |
| 23. | 55128 | 4.5% | 6.3%(-1.81)#356 | 7.6%(-3.20)#15,183 |
| 24. | 55105 | 4.4% | 6.3%(-1.84)#359 | 7.6%(-3.23)#15,284 |
| 25. | 55104 | 4.2% | 6.3%(-2.09)#381 | 7.6%(-3.48)#15,906 |
| 26. | 55118 | 3.8% | 6.3%(-2.41)#419 | 7.6%(-3.80)#16,788 |
| 27. | 55114 | 3.6% | 6.3%(-2.70)#443 | 7.6%(-4.09)#17,534 |
| 28. | 55101 | 3.5% | 6.3%(-2.72)#444 | 7.6%(-4.10)#17,556 |
| 29. | 55103 | 3.5% | 6.3%(-2.80)#454 | 7.6%(-4.19)#17,749 |
| 30. | 55107 | 3.1% | 6.3%(-3.17)#492 | 7.6%(-4.56)#18,669 |
1
Common Questions
What are the Top 10 Zip Codes with the Highest Percentage of Population with a Degree in Engineering in Saint Paul, MN?
Top 10 Zip Codes with the Highest Percentage of Population with a Degree in Engineering in Saint Paul, MN are:
What zip code has the Highest Percentage of Population with a Degree in Engineering in Saint Paul, MN?
55126 has the Highest Percentage of Population with a Degree in Engineering in Saint Paul, MN with 11.1%.
What is the Percentage of Population with a Degree in Engineering in Minnesota?
Percentage of Population with a Degree in Engineering in Minnesota is 6.3%.
What is the Percentage of Population with a Degree in Engineering in the United States?
Percentage of Population with a Degree in Engineering in the United States is 7.6%.