Zip Codes with the Highest Percentage of Population Employed in Legal Services & Support in Saint Paul, MN
RELATED REPORTS & OPTIONS
Legal Services & Support
Saint Paul
Compare Zip Codes
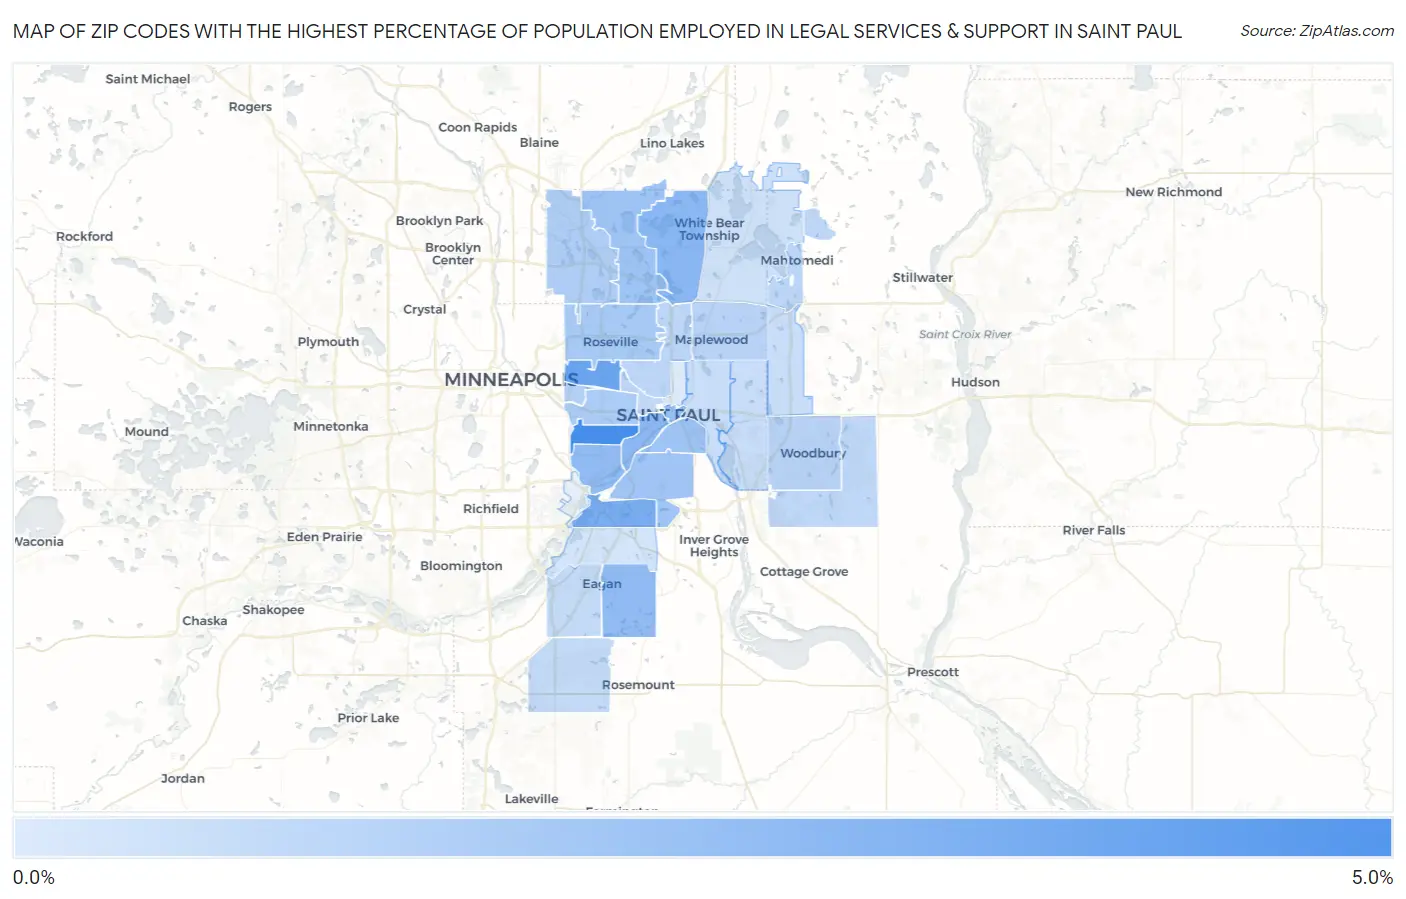
Map of Zip Codes with the Highest Percentage of Population Employed in Legal Services & Support in Saint Paul
0.17%
4.8%
Zip Codes with the Highest Percentage of Population Employed in Legal Services & Support in Saint Paul, MN
| Zip Code | % Employed | vs State | vs National | |
| 1. | 55105 | 4.8% | 1.0%(+3.76)#7 | 1.2%(+3.61)#780 |
| 2. | 55108 | 3.6% | 1.0%(+2.58)#17 | 1.2%(+2.42)#1,344 |
| 3. | 55120 | 3.2% | 1.0%(+2.15)#22 | 1.2%(+2.00)#1,666 |
| 4. | 55127 | 2.7% | 1.0%(+1.65)#25 | 1.2%(+1.50)#2,233 |
| 5. | 55102 | 2.6% | 1.0%(+1.59)#28 | 1.2%(+1.44)#2,314 |
| 6. | 55123 | 2.5% | 1.0%(+1.48)#30 | 1.2%(+1.33)#2,487 |
| 7. | 55116 | 2.5% | 1.0%(+1.44)#33 | 1.2%(+1.29)#2,553 |
| 8. | 55101 | 2.3% | 1.0%(+1.26)#42 | 1.2%(+1.11)#2,853 |
| 9. | 55126 | 2.1% | 1.0%(+1.07)#50 | 1.2%(+0.915)#3,232 |
| 10. | 55107 | 2.0% | 1.0%(+1.01)#56 | 1.2%(+0.853)#3,373 |
| 11. | 55118 | 2.0% | 1.0%(+0.930)#57 | 1.2%(+0.778)#3,572 |
| 12. | 55113 | 1.8% | 1.0%(+0.766)#68 | 1.2%(+0.613)#4,014 |
| 13. | 55104 | 1.6% | 1.0%(+0.614)#78 | 1.2%(+0.461)#4,499 |
| 14. | 55112 | 1.6% | 1.0%(+0.557)#84 | 1.2%(+0.404)#4,715 |
| 15. | 55114 | 1.4% | 1.0%(+0.354)#100 | 1.2%(+0.201)#5,540 |
| 16. | 55125 | 1.3% | 1.0%(+0.255)#114 | 1.2%(+0.102)#6,007 |
| 17. | 55109 | 1.3% | 1.0%(+0.254)#115 | 1.2%(+0.101)#6,009 |
| 18. | 55117 | 1.2% | 1.0%(+0.135)#134 | 1.2%(-0.017)#6,727 |
| 19. | 55115 | 1.1% | 1.0%(+0.101)#137 | 1.2%(-0.052)#6,927 |
| 20. | 55129 | 1.1% | 1.0%(+0.044)#144 | 1.2%(-0.108)#7,338 |
| 21. | 55103 | 1.0% | 1.0%(+0.013)#147 | 1.2%(-0.140)#7,527 |
| 22. | 55122 | 0.96% | 1.0%(-0.073)#168 | 1.2%(-0.226)#8,139 |
| 23. | 55124 | 0.96% | 1.0%(-0.076)#169 | 1.2%(-0.228)#8,161 |
| 24. | 55128 | 0.83% | 1.0%(-0.205)#198 | 1.2%(-0.357)#9,221 |
| 25. | 55106 | 0.77% | 1.0%(-0.259)#216 | 1.2%(-0.411)#9,722 |
| 26. | 55119 | 0.77% | 1.0%(-0.259)#217 | 1.2%(-0.412)#9,724 |
| 27. | 55110 | 0.57% | 1.0%(-0.464)#283 | 1.2%(-0.616)#11,858 |
| 28. | 55121 | 0.48% | 1.0%(-0.556)#325 | 1.2%(-0.708)#12,946 |
| 29. | 55130 | 0.17% | 1.0%(-0.859)#478 | 1.2%(-1.01)#16,468 |
1
Common Questions
What are the Top 10 Zip Codes with the Highest Percentage of Population Employed in Legal Services & Support in Saint Paul, MN?
Top 10 Zip Codes with the Highest Percentage of Population Employed in Legal Services & Support in Saint Paul, MN are:
What zip code has the Highest Percentage of Population Employed in Legal Services & Support in Saint Paul, MN?
55105 has the Highest Percentage of Population Employed in Legal Services & Support in Saint Paul, MN with 4.8%.
What is the Percentage of Population Employed in Legal Services & Support in Minnesota?
Percentage of Population Employed in Legal Services & Support in Minnesota is 1.0%.
What is the Percentage of Population Employed in Legal Services & Support in the United States?
Percentage of Population Employed in Legal Services & Support in the United States is 1.2%.