Zip Codes with the Highest Percentage of Population Employed in Health Diagnosing & Treating in Saint Paul, MN
RELATED REPORTS & OPTIONS
Health Diagnosing & Treating
Saint Paul
Compare Zip Codes
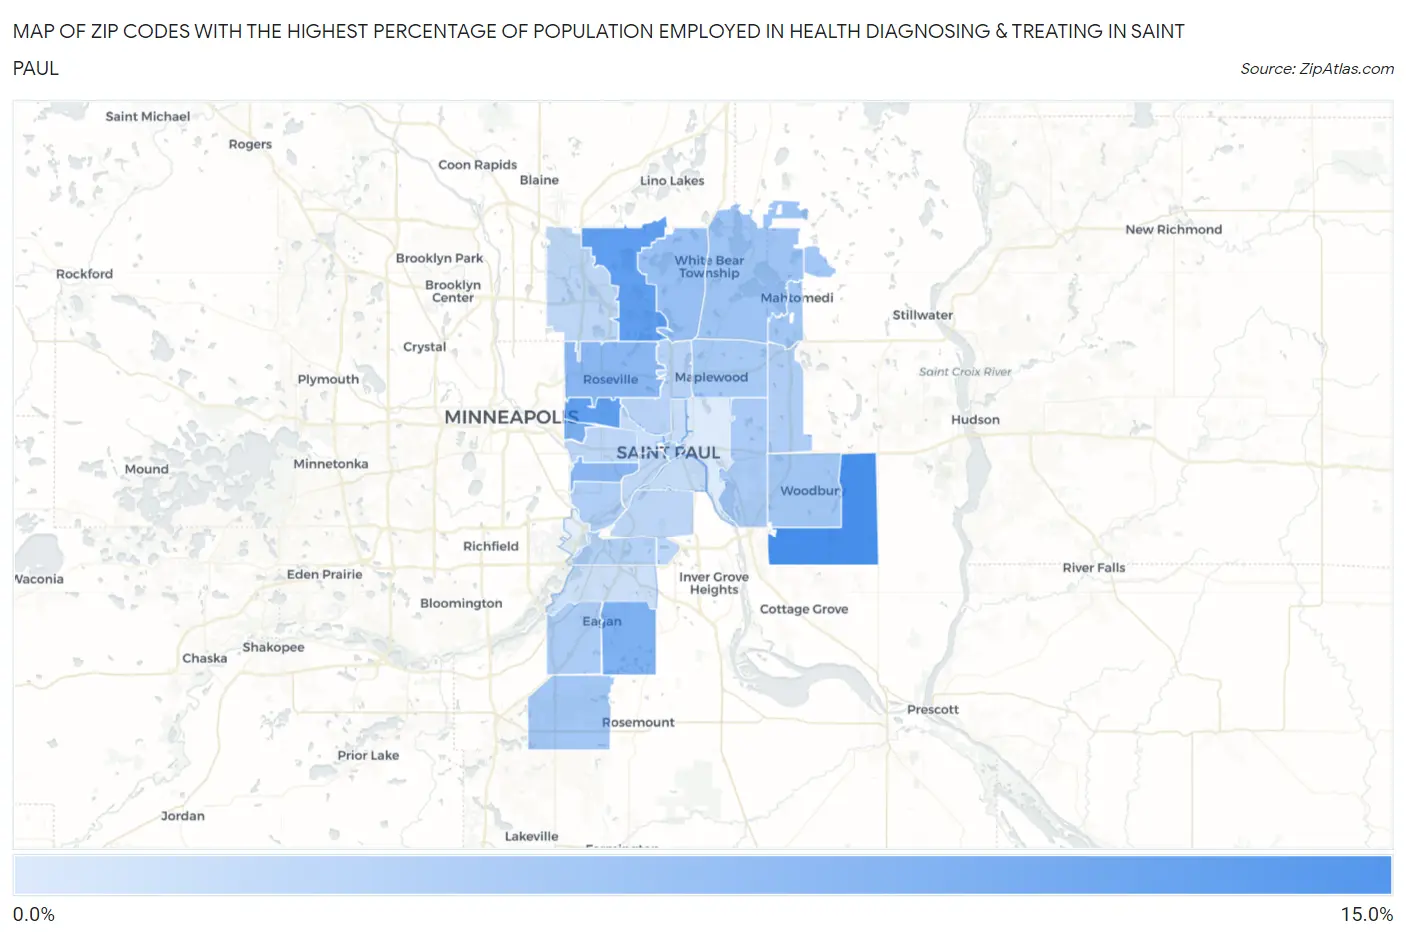
Map of Zip Codes with the Highest Percentage of Population Employed in Health Diagnosing & Treating in Saint Paul
3.3%
11.8%
Zip Codes with the Highest Percentage of Population Employed in Health Diagnosing & Treating in Saint Paul, MN
| Zip Code | % Employed | vs State | vs National | |
| 1. | 55129 | 11.8% | 6.8%(+5.09)#38 | 6.2%(+5.60)#2,302 |
| 2. | 55108 | 10.4% | 6.8%(+3.63)#71 | 6.2%(+4.15)#3,417 |
| 3. | 55126 | 10.3% | 6.8%(+3.56)#73 | 6.2%(+4.08)#3,502 |
| 4. | 55114 | 8.8% | 6.8%(+2.06)#135 | 6.2%(+2.58)#5,684 |
| 5. | 55123 | 8.7% | 6.8%(+1.89)#144 | 6.2%(+2.41)#6,023 |
| 6. | 55113 | 8.0% | 6.8%(+1.25)#174 | 6.2%(+1.77)#7,460 |
| 7. | 55105 | 7.9% | 6.8%(+1.18)#185 | 6.2%(+1.70)#7,649 |
| 8. | 55127 | 7.1% | 6.8%(+0.379)#273 | 6.2%(+0.896)#9,915 |
| 9. | 55110 | 6.7% | 6.8%(-0.025)#323 | 6.2%(+0.492)#11,208 |
| 10. | 55124 | 6.6% | 6.8%(-0.191)#339 | 6.2%(+0.326)#11,781 |
| 11. | 55115 | 6.5% | 6.8%(-0.254)#346 | 6.2%(+0.263)#11,994 |
| 12. | 55125 | 6.5% | 6.8%(-0.281)#351 | 6.2%(+0.236)#12,095 |
| 13. | 55109 | 6.3% | 6.8%(-0.445)#367 | 6.2%(+0.072)#12,705 |
| 14. | 55119 | 6.1% | 6.8%(-0.665)#392 | 6.2%(-0.148)#13,540 |
| 15. | 55122 | 6.0% | 6.8%(-0.748)#401 | 6.2%(-0.231)#13,824 |
| 16. | 55128 | 5.9% | 6.8%(-0.857)#416 | 6.2%(-0.340)#14,202 |
| 17. | 55101 | 5.7% | 6.8%(-1.05)#440 | 6.2%(-0.529)#14,922 |
| 18. | 55116 | 5.7% | 6.8%(-1.07)#446 | 6.2%(-0.550)#15,013 |
| 19. | 55120 | 5.4% | 6.8%(-1.34)#486 | 6.2%(-0.821)#16,078 |
| 20. | 55117 | 5.3% | 6.8%(-1.45)#506 | 6.2%(-0.930)#16,500 |
| 21. | 55118 | 5.1% | 6.8%(-1.63)#533 | 6.2%(-1.11)#17,203 |
| 22. | 55112 | 5.1% | 6.8%(-1.67)#537 | 6.2%(-1.15)#17,343 |
| 23. | 55104 | 5.1% | 6.8%(-1.70)#541 | 6.2%(-1.18)#17,459 |
| 24. | 55102 | 5.0% | 6.8%(-1.75)#546 | 6.2%(-1.23)#17,658 |
| 25. | 55107 | 4.5% | 6.8%(-2.24)#599 | 6.2%(-1.72)#19,552 |
| 26. | 55130 | 4.5% | 6.8%(-2.30)#612 | 6.2%(-1.79)#19,790 |
| 27. | 55103 | 4.3% | 6.8%(-2.41)#625 | 6.2%(-1.90)#20,170 |
| 28. | 55121 | 4.3% | 6.8%(-2.50)#635 | 6.2%(-1.98)#20,481 |
| 29. | 55106 | 3.3% | 6.8%(-3.45)#740 | 6.2%(-2.93)#23,437 |
1
Common Questions
What are the Top 10 Zip Codes with the Highest Percentage of Population Employed in Health Diagnosing & Treating in Saint Paul, MN?
Top 10 Zip Codes with the Highest Percentage of Population Employed in Health Diagnosing & Treating in Saint Paul, MN are:
What zip code has the Highest Percentage of Population Employed in Health Diagnosing & Treating in Saint Paul, MN?
55129 has the Highest Percentage of Population Employed in Health Diagnosing & Treating in Saint Paul, MN with 11.8%.
What is the Percentage of Population Employed in Health Diagnosing & Treating in Minnesota?
Percentage of Population Employed in Health Diagnosing & Treating in Minnesota is 6.8%.
What is the Percentage of Population Employed in Health Diagnosing & Treating in the United States?
Percentage of Population Employed in Health Diagnosing & Treating in the United States is 6.2%.