Zip Codes with the Lowest Poverty Level Among Children Under the Age of 5 in Saint Paul, MN
RELATED REPORTS & OPTIONS
Lowest Poverty | Child 0-5
Saint Paul
Compare Zip Codes
Map of Zip Codes with the Lowest Poverty Level Among Children Under the Age of 5 in Saint Paul
34.0%
1.1%
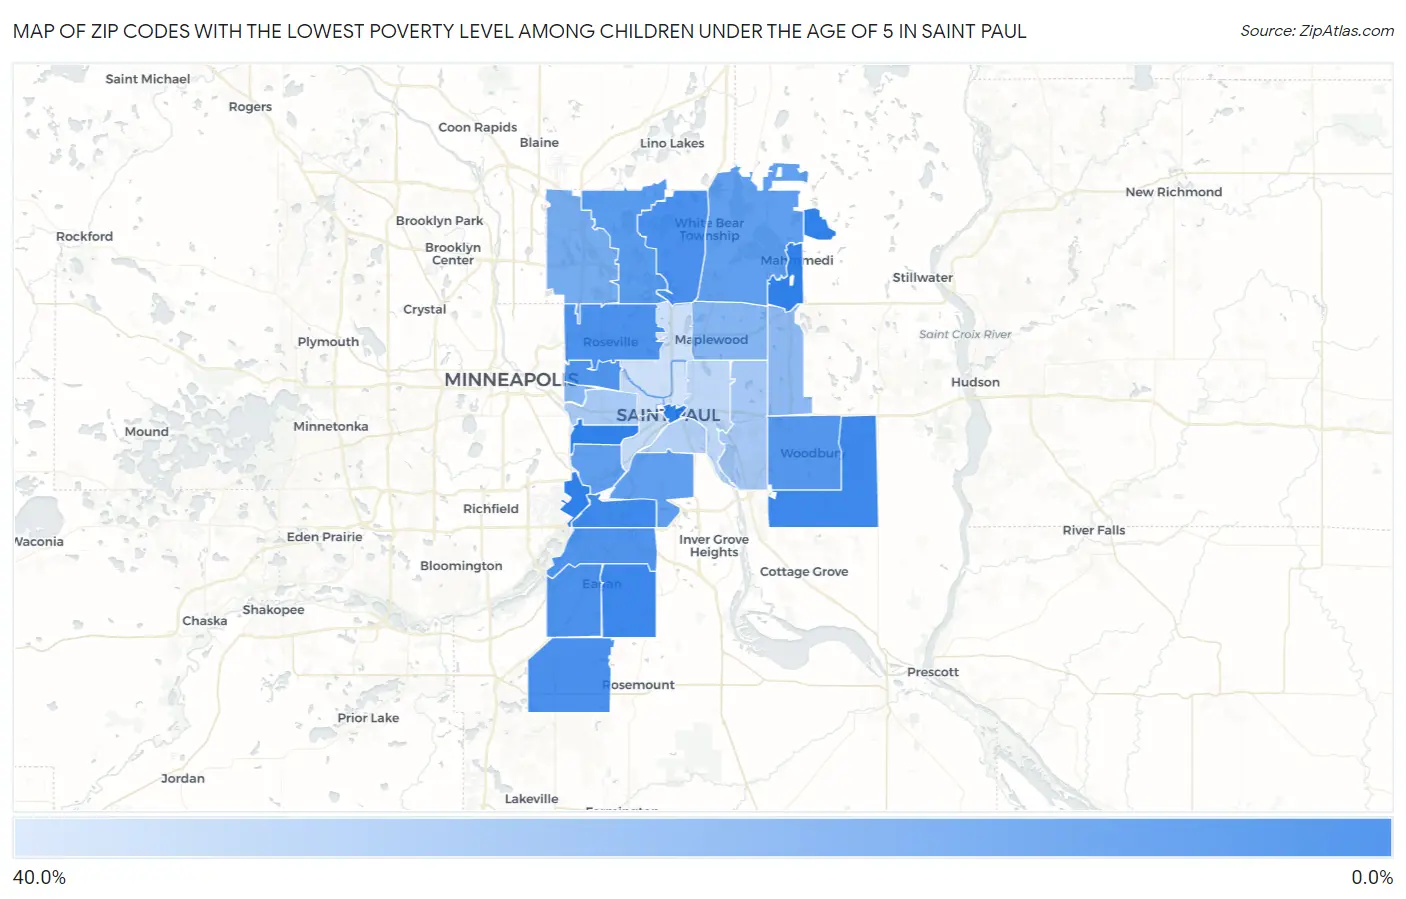
Zip Codes with the Lowest Poverty Level Among Children Under the Age of 5 in Saint Paul, MN
| Zip Code | Child Poverty | vs State | vs National | |
| 1. | 55123 | 1.1% | 11.3%(-10.2)#19 | 18.1%(-17.0)#324 |
| 2. | 55129 | 1.7% | 11.3%(-9.64)#39 | 18.1%(-16.4)#637 |
| 3. | 55120 | 1.9% | 11.3%(-9.44)#40 | 18.1%(-16.2)#762 |
| 4. | 55124 | 3.7% | 11.3%(-7.64)#92 | 18.1%(-14.4)#1,946 |
| 5. | 55127 | 3.9% | 11.3%(-7.44)#98 | 18.1%(-14.2)#2,086 |
| 6. | 55113 | 4.1% | 11.3%(-7.23)#105 | 18.1%(-14.0)#2,250 |
| 7. | 55122 | 4.2% | 11.3%(-7.13)#110 | 18.1%(-13.9)#2,345 |
| 8. | 55121 | 4.5% | 11.3%(-6.82)#120 | 18.1%(-13.6)#2,563 |
| 9. | 55108 | 4.9% | 11.3%(-6.43)#138 | 18.1%(-13.2)#2,831 |
| 10. | 55125 | 6.0% | 11.3%(-5.31)#186 | 18.1%(-12.0)#3,615 |
| 11. | 55126 | 7.1% | 11.3%(-4.21)#218 | 18.1%(-10.9)#4,352 |
| 12. | 55110 | 8.3% | 11.3%(-3.07)#244 | 18.1%(-9.80)#5,079 |
| 13. | 55116 | 8.4% | 11.3%(-2.88)#258 | 18.1%(-9.61)#5,220 |
| 14. | 55118 | 8.5% | 11.3%(-2.84)#260 | 18.1%(-9.57)#5,247 |
| 15. | 55112 | 12.6% | 11.3%(+1.30)#346 | 18.1%(-5.43)#7,835 |
| 16. | 55109 | 15.7% | 11.3%(+4.33)#408 | 18.1%(-2.40)#9,582 |
| 17. | 55114 | 16.7% | 11.3%(+5.33)#422 | 18.1%(-1.40)#10,101 |
| 18. | 55128 | 17.7% | 11.3%(+6.35)#442 | 18.1%(-0.383)#10,555 |
| 19. | 55119 | 23.4% | 11.3%(+12.1)#502 | 18.1%(+5.33)#13,059 |
| 20. | 55104 | 23.8% | 11.3%(+12.5)#507 | 18.1%(+5.74)#13,225 |
| 21. | 55107 | 26.6% | 11.3%(+15.3)#529 | 18.1%(+8.55)#14,235 |
| 22. | 55106 | 29.0% | 11.3%(+17.6)#538 | 18.1%(+10.9)#15,009 |
| 23. | 55102 | 30.4% | 11.3%(+19.1)#546 | 18.1%(+12.3)#15,427 |
| 24. | 55103 | 32.3% | 11.3%(+21.0)#552 | 18.1%(+14.2)#15,908 |
| 25. | 55117 | 32.8% | 11.3%(+21.4)#555 | 18.1%(+14.7)#16,024 |
| 26. | 55130 | 34.0% | 11.3%(+22.6)#566 | 18.1%(+15.9)#16,373 |
1
Common Questions
What are the Top 10 Zip Codes with the Lowest Poverty Level Among Children Under the Age of 5 in Saint Paul, MN?
Top 10 Zip Codes with the Lowest Poverty Level Among Children Under the Age of 5 in Saint Paul, MN are:
What zip code has the Lowest Poverty Level Among Children Under the Age of 5 in Saint Paul, MN?
55123 has the Lowest Poverty Level Among Children Under the Age of 5 in Saint Paul, MN with 1.1%.
What is the Poverty Level Among Children Under the Age of 5 in Minnesota?
Poverty Level Among Children Under the Age of 5 in Minnesota is 11.3%.
What is the Poverty Level Among Children Under the Age of 5 in the United States?
Poverty Level Among Children Under the Age of 5 in the United States is 18.1%.