Zip Codes with the Highest Percentage of Population with a Degree in Science and Engineering in Saint Paul, MN
RELATED REPORTS & OPTIONS
Science and Engineering
Saint Paul
Compare Zip Codes
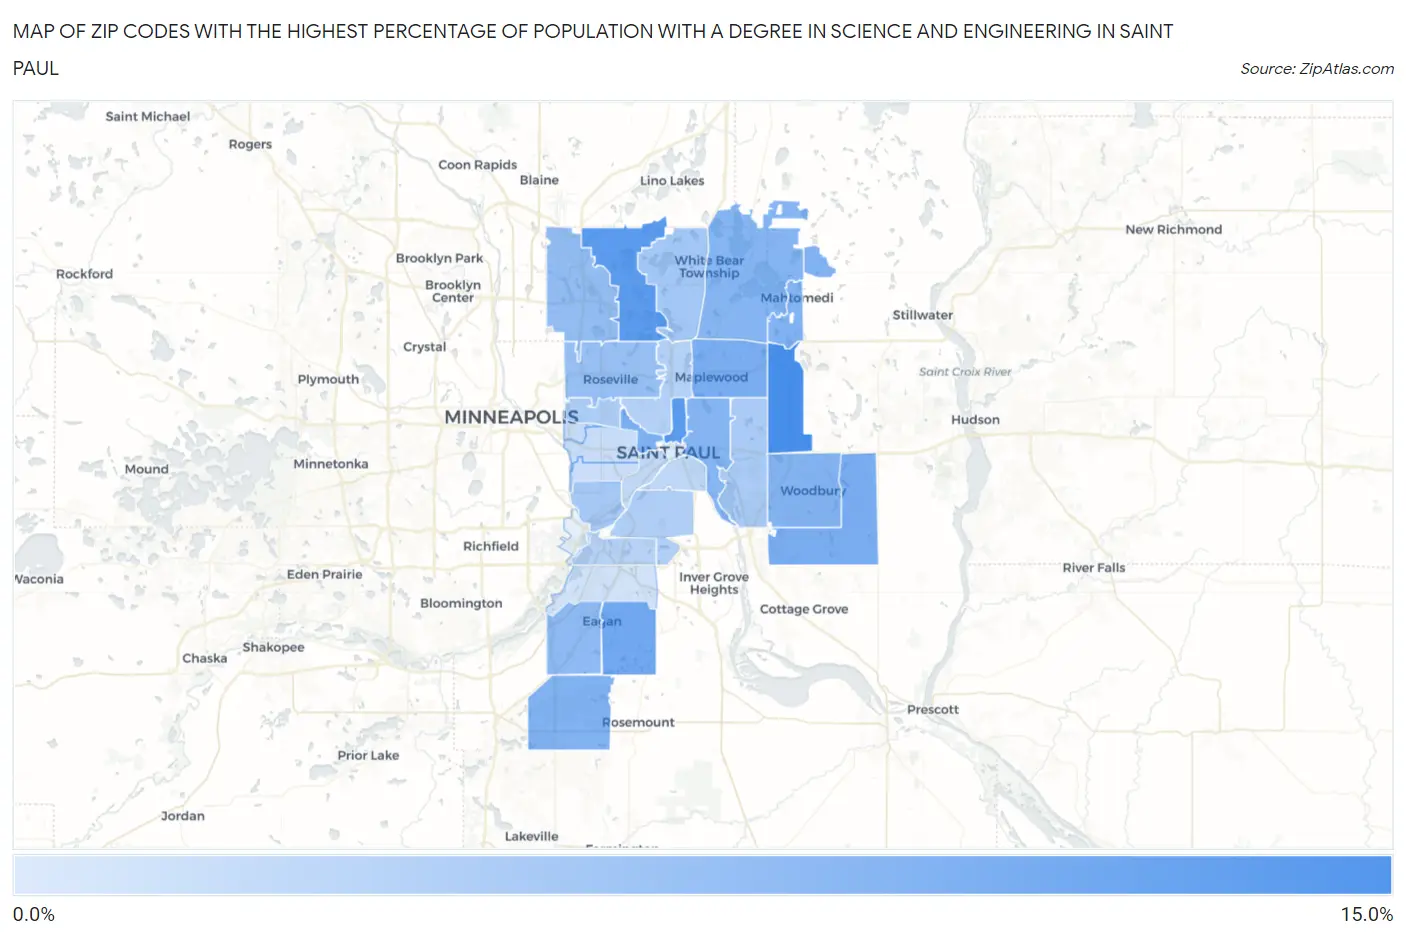
Map of Zip Codes with the Highest Percentage of Population with a Degree in Science and Engineering in Saint Paul
4.6%
12.3%
Zip Codes with the Highest Percentage of Population with a Degree in Science and Engineering in Saint Paul, MN
| Zip Code | % Graduates | vs State | vs National | |
| 1. | 55128 | 12.3% | 9.8%(+2.53)#337 | 9.8%(+2.55)#10,302 |
| 2. | 55130 | 11.5% | 9.8%(+1.66)#387 | 9.8%(+1.69)#11,890 |
| 3. | 55126 | 11.3% | 9.8%(+1.45)#410 | 9.8%(+1.48)#12,315 |
| 4. | 55123 | 10.1% | 9.8%(+0.290)#480 | 9.8%(+0.316)#14,821 |
| 5. | 55129 | 9.7% | 9.8%(-0.146)#514 | 9.8%(-0.120)#15,791 |
| 6. | 55109 | 9.6% | 9.8%(-0.193)#522 | 9.8%(-0.167)#15,894 |
| 7. | 55103 | 9.4% | 9.8%(-0.450)#545 | 9.8%(-0.424)#16,492 |
| 8. | 55115 | 9.3% | 9.8%(-0.512)#550 | 9.8%(-0.486)#16,640 |
| 9. | 55124 | 9.3% | 9.8%(-0.524)#553 | 9.8%(-0.498)#16,668 |
| 10. | 55125 | 9.2% | 9.8%(-0.595)#558 | 9.8%(-0.569)#16,838 |
| 11. | 55110 | 9.1% | 9.8%(-0.741)#574 | 9.8%(-0.715)#17,184 |
| 12. | 55106 | 9.0% | 9.8%(-0.797)#576 | 9.8%(-0.771)#17,328 |
| 13. | 55122 | 8.6% | 9.8%(-1.24)#604 | 9.8%(-1.21)#18,299 |
| 14. | 55112 | 8.4% | 9.8%(-1.46)#613 | 9.8%(-1.43)#18,810 |
| 15. | 55113 | 8.1% | 9.8%(-1.69)#624 | 9.8%(-1.66)#19,385 |
| 16. | 55127 | 7.4% | 9.8%(-2.36)#670 | 9.8%(-2.33)#20,826 |
| 17. | 55116 | 7.4% | 9.8%(-2.39)#672 | 9.8%(-2.36)#20,881 |
| 18. | 55119 | 7.2% | 9.8%(-2.65)#684 | 9.8%(-2.62)#21,415 |
| 19. | 55108 | 7.0% | 9.8%(-2.76)#692 | 9.8%(-2.73)#21,626 |
| 20. | 55118 | 6.8% | 9.8%(-3.06)#706 | 9.8%(-3.03)#22,148 |
| 21. | 55117 | 6.7% | 9.8%(-3.15)#713 | 9.8%(-3.13)#22,327 |
| 22. | 55120 | 6.4% | 9.8%(-3.41)#728 | 9.8%(-3.39)#22,771 |
| 23. | 55107 | 6.0% | 9.8%(-3.77)#740 | 9.8%(-3.74)#23,380 |
| 24. | 55102 | 6.0% | 9.8%(-3.82)#742 | 9.8%(-3.80)#23,462 |
| 25. | 55114 | 5.8% | 9.8%(-4.01)#750 | 9.8%(-3.98)#23,748 |
| 26. | 55104 | 5.7% | 9.8%(-4.14)#753 | 9.8%(-4.11)#23,917 |
| 27. | 55105 | 5.5% | 9.8%(-4.34)#761 | 9.8%(-4.31)#24,168 |
| 28. | 55121 | 5.2% | 9.8%(-4.58)#770 | 9.8%(-4.56)#24,467 |
| 29. | 55101 | 4.6% | 9.8%(-5.21)#788 | 9.8%(-5.19)#25,192 |
1
Common Questions
What are the Top 10 Zip Codes with the Highest Percentage of Population with a Degree in Science and Engineering in Saint Paul, MN?
Top 10 Zip Codes with the Highest Percentage of Population with a Degree in Science and Engineering in Saint Paul, MN are:
What zip code has the Highest Percentage of Population with a Degree in Science and Engineering in Saint Paul, MN?
55128 has the Highest Percentage of Population with a Degree in Science and Engineering in Saint Paul, MN with 12.3%.
What is the Percentage of Population with a Degree in Science and Engineering in Minnesota?
Percentage of Population with a Degree in Science and Engineering in Minnesota is 9.8%.
What is the Percentage of Population with a Degree in Science and Engineering in the United States?
Percentage of Population with a Degree in Science and Engineering in the United States is 9.8%.