Zip Codes with the Highest Percentage of Not-for-profit Organizations in Saint Paul, MN

RELATED REPORTS & OPTIONS

Not-for-profit Organizations
Population
Families and Households
Female Fertility
Female Fertility (Unmarried)
Race (Community Size)
Race (Percentage)
Ancestry (Community Size)
AfghanAfricanAlbanianAlsatianAmericanApacheArabArgentineanArmenianAustralianAustrianBahamianBangladeshiBarbadianBelgianBelizeanBhutaneseBlackfeetBrazilianBritishBritish West IndianBulgarianBurmeseCambodianCanadianCarpatho RusynCelticCentral AmericanCentral American IndianCherokeeChickasawChileanChippewaChoctawColombianCosta RicanCreeCroatianCubanCzechCzechoslovakianDanishDominicanDutchEastern EuropeanEcuadorianEgyptianEnglishEstonianEthiopianEuropeanFilipinoFinnishFrenchFrench American IndianFrench CanadianGermanGerman RussianGhanaianGreekGuamanian / ChamorroGuatemalanGuyaneseHaitianHonduranHopiHungarianIcelanderIndian (Asian)IndonesianInupiatIranianIraqiIrishIroquoisIsraeliItalianJamaicanJapaneseJordanianKenyanKoreanLaotianLatvianLebaneseLiberianLithuanianLuxembourgerMacedonianMalaysianMalteseMenomineeMexicanMexican American IndianMongolianMoroccanNative HawaiianNavajoNew ZealanderNicaraguanNigerianNorthern EuropeanNorwegianPakistaniPalestinianPanamanianParaguayanPennsylvania GermanPeruvianPolishPortuguesePotawatomiPuerto RicanPuget Sound SalishRomanianRussianSalvadoranSamoanScandinavianScotch-IrishScottishSeminoleSerbianSiouxSlavicSlovakSloveneSomaliSouth AfricanSouth AmericanSouth American IndianSpaniardSpanishSpanish AmericanSri LankanSubsaharan AfricanSudaneseSwedishSwissSyrianThaiTrinidadian and TobagonianTurkishU.S. Virgin IslanderUgandanUkrainianUruguayanVenezuelanVietnameseWelshWest IndianYugoslavianZimbabwean
Ancestry (Percentage)
AfghanAfricanAlbanianAlsatianAmericanApacheArabArgentineanArmenianAustralianAustrianBahamianBangladeshiBarbadianBelgianBelizeanBhutaneseBlackfeetBrazilianBritishBritish West IndianBulgarianBurmeseCambodianCanadianCarpatho RusynCelticCentral AmericanCentral American IndianCherokeeChickasawChileanChippewaChoctawColombianCosta RicanCreeCroatianCubanCzechCzechoslovakianDanishDominicanDutchEastern EuropeanEcuadorianEgyptianEnglishEstonianEthiopianEuropeanFilipinoFinnishFrenchFrench American IndianFrench CanadianGermanGerman RussianGhanaianGreekGuamanian / ChamorroGuatemalanGuyaneseHaitianHonduranHopiHungarianIcelanderIndian (Asian)IndonesianInupiatIranianIraqiIrishIroquoisIsraeliItalianJamaicanJapaneseJordanianKenyanKoreanLaotianLatvianLebaneseLiberianLithuanianLuxembourgerMacedonianMalaysianMalteseMenomineeMexicanMexican American IndianMongolianMoroccanNative HawaiianNavajoNew ZealanderNicaraguanNigerianNorthern EuropeanNorwegianPakistaniPalestinianPanamanianParaguayanPennsylvania GermanPeruvianPolishPortuguesePotawatomiPuerto RicanPuget Sound SalishRomanianRussianSalvadoranSamoanScandinavianScotch-IrishScottishSeminoleSerbianSiouxSlavicSlovakSloveneSomaliSouth AfricanSouth AmericanSouth American IndianSpaniardSpanishSpanish AmericanSri LankanSubsaharan AfricanSudaneseSwedishSwissSyrianThaiTrinidadian and TobagonianTurkishU.S. Virgin IslanderUgandanUkrainianUruguayanVenezuelanVietnameseWelshWest IndianYugoslavianZimbabwean
Immigrant Origin (Total)
AfghanistanAfricaArgentinaArmeniaAsiaAustraliaAustriaBahamasBangladeshBarbadosBelarusBelgiumBelizeBoliviaBosnia and HerzegovinaBrazilBulgariaBurma / MyanmarCambodiaCameroonCanadaCaribbeanCentral AmericaChileChinaColombiaCongoCosta RicaCroatiaCubaCzechoslovakiaDenmarkDominican RepublicEastern AfricaEastern AsiaEastern EuropeEcuadorEgyptEl SalvadorEnglandEritreaEthiopiaEuropeFranceGermanyGhanaGreeceGuatemalaGuyanaHaitiHondurasHong KongHungaryIndiaIndonesiaIranIraqIrelandIsraelItalyJamaicaJapanJordanKazakhstanKenyaKoreaKuwaitLaosLatin AmericaLatviaLebanonLiberiaMalaysiaMexicoMiddle AfricaMoldovaMoroccoNepalNetherlandsNicaraguaNigeriaNorth MacedoniaNorthern AfricaNorthern EuropeNorwayOceaniaPakistanPanamaPeruPhilippinesPolandPortugalRomaniaRussiaSaudi ArabiaScotlandSerbiaSierra LeoneSingaporeSomaliaSouth AfricaSouth AmericaSouth Central AsiaSouth Eastern AsiaSouthern EuropeSpainSri LankaSudanSwedenSwitzerlandTaiwanThailandTrinidad and TobagoTurkeyUgandaUkraineUruguayVenezuelaVietnamWestern AfricaWestern AsiaWestern EuropeYemenZaireZimbabwe
Immigrant Origin (Percentage)
AfghanistanAfricaArgentinaArmeniaAsiaAustraliaAustriaBahamasBangladeshBarbadosBelarusBelgiumBelizeBoliviaBosnia and HerzegovinaBrazilBulgariaBurma / MyanmarCambodiaCameroonCanadaCaribbeanCentral AmericaChileChinaColombiaCongoCosta RicaCroatiaCubaCzechoslovakiaDenmarkDominican RepublicEastern AfricaEastern AsiaEastern EuropeEcuadorEgyptEl SalvadorEnglandEritreaEthiopiaEuropeFranceGermanyGhanaGreeceGuatemalaGuyanaHaitiHondurasHong KongHungaryIndiaIndonesiaIranIraqIrelandIsraelItalyJamaicaJapanJordanKazakhstanKenyaKoreaKuwaitLaosLatin AmericaLatviaLebanonLiberiaMalaysiaMexicoMiddle AfricaMoldovaMoroccoNepalNetherlandsNicaraguaNigeriaNorth MacedoniaNorthern AfricaNorthern EuropeNorwayOceaniaPakistanPanamaPeruPhilippinesPolandPortugalRomaniaRussiaSaudi ArabiaScotlandSerbiaSierra LeoneSingaporeSomaliaSouth AfricaSouth AmericaSouth Central AsiaSouth Eastern AsiaSouthern EuropeSpainSri LankaSudanSwedenSwitzerlandTaiwanThailandTrinidad and TobagoTurkeyUgandaUkraineUruguayVenezuelaVietnamWestern AfricaWestern AsiaWestern EuropeYemenZaireZimbabwe
Income
Income (Families)
Income (Households)
Poverty
Poverty (Families)
Unemployment
Employment Occupations
Employment Industries
Employer Class
Commute Time
Commute Means
School Enrollment
Education by Degree Field
Occupancy
Finances
Physical Characteristics
Saint Paul
Compare Zip Codes
Comparison Subject

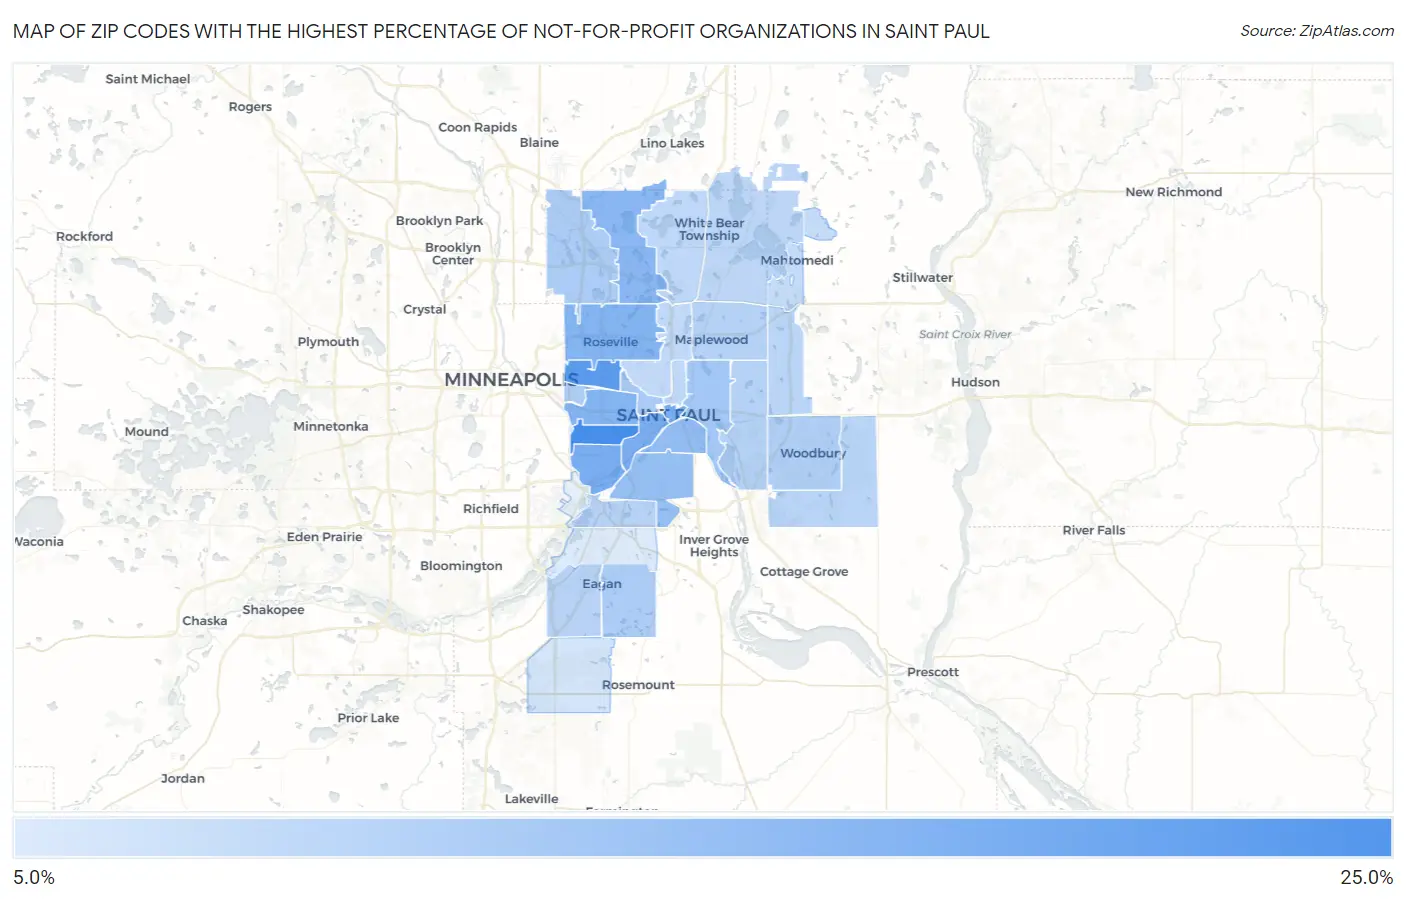
Map of Zip Codes with the Highest Percentage of Not-for-profit Organizations in Saint Paul

0.0%
25.0%
Zip Codes with the Highest Percentage of Not-for-profit Organizations in Saint Paul Map

Zip Codes with the Highest Percentage of Not-for-profit Organizations in Saint Paul, MN

Zip Code % Employed in Not-for-profit vs State vs National
1.5510522.7%11.8%(+10.9)#228.4%(+14.2)#919
2.5510820.5%11.8%(+8.72)#328.4%(+12.1)#1,214
3.5510117.9%11.8%(+6.14)#518.4%(+9.49)#1,729
4.5510217.8%11.8%(+5.97)#538.4%(+9.32)#1,770
5.5511617.6%11.8%(+5.79)#558.4%(+9.14)#1,838
6.5510416.9%11.8%(+5.08)#658.4%(+8.43)#2,064
7.5511316.8%11.8%(+4.97)#698.4%(+8.32)#2,120
8.5512616.1%11.8%(+4.28)#828.4%(+7.63)#2,420
9.5510715.2%11.8%(+3.40)#1008.4%(+6.75)#2,829
10.5511815.0%11.8%(+3.19)#1108.4%(+6.54)#2,956
11.5510613.6%11.8%(+1.85)#1528.4%(+5.20)#3,891
12.5510313.1%11.8%(+1.30)#1848.4%(+4.65)#4,428
13.5512312.9%11.8%(+1.14)#1948.4%(+4.49)#4,561
14.5511212.8%11.8%(+1.03)#1998.4%(+4.38)#4,675
15.5511412.7%11.8%(+0.903)#2088.4%(+4.25)#4,840
16.5512512.4%11.8%(+0.647)#2258.4%(+4.00)#5,112
17.5510912.1%11.8%(+0.336)#2388.4%(+3.68)#5,473
18.5511911.9%11.8%(+0.130)#2548.4%(+3.48)#5,735
19.5512011.9%11.8%(+0.069)#2588.4%(+3.42)#5,813
20.5512211.9%11.8%(+0.059)#2598.4%(+3.41)#5,826
21.5512911.6%11.8%(-0.169)#2808.4%(+3.18)#6,153
22.5512811.5%11.8%(-0.248)#2868.4%(+3.10)#6,254
23.5511011.4%11.8%(-0.395)#2958.4%(+2.95)#6,456
24.5513011.1%11.8%(-0.696)#3168.4%(+2.65)#6,916
25.5512711.1%11.8%(-0.699)#3178.4%(+2.65)#6,922
26.5511710.9%11.8%(-0.848)#3278.4%(+2.50)#7,155
27.5511510.5%11.8%(-1.33)#3668.4%(+2.02)#7,979
28.551249.3%11.8%(-2.45)#4658.4%(+0.897)#10,282
29.551218.5%11.8%(-3.31)#5408.4%(+0.036)#12,321

Common Questions

What are the Top 10 Zip Codes with the Highest Percentage of Not-for-profit Organizations in Saint Paul, MN?
Top 10 Zip Codes with the Highest Percentage of Not-for-profit Organizations in Saint Paul, MN are:
#1
22.7%
#2
20.5%
#3
17.9%
#4
17.8%
#5
17.6%
#6
16.9%
#7
16.8%
#8
16.1%
#9
15.2%
#10
15.0%
What zip code has the Highest Percentage of Not-for-profit Organizations in Saint Paul, MN?
55105 has the Highest Percentage of Not-for-profit Organizations in Saint Paul, MN with 22.7%.
What is the Percentage of Not-for-profit Organizations in Minnesota?
Percentage of Not-for-profit Organizations in Minnesota is 11.8%.
What is the Percentage of Not-for-profit Organizations in the United States?
Percentage of Not-for-profit Organizations in the United States is 8.4%.