Zip Codes with the Highest Poverty Level Among Children Under the Age of 16 in Saint Paul, MN

RELATED REPORTS & OPTIONS

Highest Poverty | Child 0-16
Population
Families and Households
Female Fertility
Female Fertility (Unmarried)
Race (Community Size)
Race (Percentage)
Ancestry (Community Size)
AfghanAfricanAlbanianAlsatianAmericanApacheArabArgentineanArmenianAustralianAustrianBahamianBangladeshiBarbadianBelgianBelizeanBhutaneseBlackfeetBrazilianBritishBritish West IndianBulgarianBurmeseCambodianCanadianCarpatho RusynCelticCentral AmericanCentral American IndianCherokeeChickasawChileanChippewaChoctawColombianCosta RicanCreeCroatianCubanCzechCzechoslovakianDanishDominicanDutchEastern EuropeanEcuadorianEgyptianEnglishEstonianEthiopianEuropeanFilipinoFinnishFrenchFrench American IndianFrench CanadianGermanGerman RussianGhanaianGreekGuamanian / ChamorroGuatemalanGuyaneseHaitianHonduranHopiHungarianIcelanderIndian (Asian)IndonesianInupiatIranianIraqiIrishIroquoisIsraeliItalianJamaicanJapaneseJordanianKenyanKoreanLaotianLatvianLebaneseLiberianLithuanianLuxembourgerMacedonianMalaysianMalteseMenomineeMexicanMexican American IndianMongolianMoroccanNative HawaiianNavajoNew ZealanderNicaraguanNigerianNorthern EuropeanNorwegianPakistaniPalestinianPanamanianParaguayanPennsylvania GermanPeruvianPolishPortuguesePotawatomiPuerto RicanPuget Sound SalishRomanianRussianSalvadoranSamoanScandinavianScotch-IrishScottishSeminoleSerbianSiouxSlavicSlovakSloveneSomaliSouth AfricanSouth AmericanSouth American IndianSpaniardSpanishSpanish AmericanSri LankanSubsaharan AfricanSudaneseSwedishSwissSyrianThaiTrinidadian and TobagonianTurkishU.S. Virgin IslanderUgandanUkrainianUruguayanVenezuelanVietnameseWelshWest IndianYugoslavianZimbabwean
Ancestry (Percentage)
AfghanAfricanAlbanianAlsatianAmericanApacheArabArgentineanArmenianAustralianAustrianBahamianBangladeshiBarbadianBelgianBelizeanBhutaneseBlackfeetBrazilianBritishBritish West IndianBulgarianBurmeseCambodianCanadianCarpatho RusynCelticCentral AmericanCentral American IndianCherokeeChickasawChileanChippewaChoctawColombianCosta RicanCreeCroatianCubanCzechCzechoslovakianDanishDominicanDutchEastern EuropeanEcuadorianEgyptianEnglishEstonianEthiopianEuropeanFilipinoFinnishFrenchFrench American IndianFrench CanadianGermanGerman RussianGhanaianGreekGuamanian / ChamorroGuatemalanGuyaneseHaitianHonduranHopiHungarianIcelanderIndian (Asian)IndonesianInupiatIranianIraqiIrishIroquoisIsraeliItalianJamaicanJapaneseJordanianKenyanKoreanLaotianLatvianLebaneseLiberianLithuanianLuxembourgerMacedonianMalaysianMalteseMenomineeMexicanMexican American IndianMongolianMoroccanNative HawaiianNavajoNew ZealanderNicaraguanNigerianNorthern EuropeanNorwegianPakistaniPalestinianPanamanianParaguayanPennsylvania GermanPeruvianPolishPortuguesePotawatomiPuerto RicanPuget Sound SalishRomanianRussianSalvadoranSamoanScandinavianScotch-IrishScottishSeminoleSerbianSiouxSlavicSlovakSloveneSomaliSouth AfricanSouth AmericanSouth American IndianSpaniardSpanishSpanish AmericanSri LankanSubsaharan AfricanSudaneseSwedishSwissSyrianThaiTrinidadian and TobagonianTurkishU.S. Virgin IslanderUgandanUkrainianUruguayanVenezuelanVietnameseWelshWest IndianYugoslavianZimbabwean
Immigrant Origin (Total)
AfghanistanAfricaArgentinaArmeniaAsiaAustraliaAustriaBahamasBangladeshBarbadosBelarusBelgiumBelizeBoliviaBosnia and HerzegovinaBrazilBulgariaBurma / MyanmarCambodiaCameroonCanadaCaribbeanCentral AmericaChileChinaColombiaCongoCosta RicaCroatiaCubaCzechoslovakiaDenmarkDominican RepublicEastern AfricaEastern AsiaEastern EuropeEcuadorEgyptEl SalvadorEnglandEritreaEthiopiaEuropeFranceGermanyGhanaGreeceGuatemalaGuyanaHaitiHondurasHong KongHungaryIndiaIndonesiaIranIraqIrelandIsraelItalyJamaicaJapanJordanKazakhstanKenyaKoreaKuwaitLaosLatin AmericaLatviaLebanonLiberiaMalaysiaMexicoMiddle AfricaMoldovaMoroccoNepalNetherlandsNicaraguaNigeriaNorth MacedoniaNorthern AfricaNorthern EuropeNorwayOceaniaPakistanPanamaPeruPhilippinesPolandPortugalRomaniaRussiaSaudi ArabiaScotlandSerbiaSierra LeoneSingaporeSomaliaSouth AfricaSouth AmericaSouth Central AsiaSouth Eastern AsiaSouthern EuropeSpainSri LankaSudanSwedenSwitzerlandTaiwanThailandTrinidad and TobagoTurkeyUgandaUkraineUruguayVenezuelaVietnamWestern AfricaWestern AsiaWestern EuropeYemenZaireZimbabwe
Immigrant Origin (Percentage)
AfghanistanAfricaArgentinaArmeniaAsiaAustraliaAustriaBahamasBangladeshBarbadosBelarusBelgiumBelizeBoliviaBosnia and HerzegovinaBrazilBulgariaBurma / MyanmarCambodiaCameroonCanadaCaribbeanCentral AmericaChileChinaColombiaCongoCosta RicaCroatiaCubaCzechoslovakiaDenmarkDominican RepublicEastern AfricaEastern AsiaEastern EuropeEcuadorEgyptEl SalvadorEnglandEritreaEthiopiaEuropeFranceGermanyGhanaGreeceGuatemalaGuyanaHaitiHondurasHong KongHungaryIndiaIndonesiaIranIraqIrelandIsraelItalyJamaicaJapanJordanKazakhstanKenyaKoreaKuwaitLaosLatin AmericaLatviaLebanonLiberiaMalaysiaMexicoMiddle AfricaMoldovaMoroccoNepalNetherlandsNicaraguaNigeriaNorth MacedoniaNorthern AfricaNorthern EuropeNorwayOceaniaPakistanPanamaPeruPhilippinesPolandPortugalRomaniaRussiaSaudi ArabiaScotlandSerbiaSierra LeoneSingaporeSomaliaSouth AfricaSouth AmericaSouth Central AsiaSouth Eastern AsiaSouthern EuropeSpainSri LankaSudanSwedenSwitzerlandTaiwanThailandTrinidad and TobagoTurkeyUgandaUkraineUruguayVenezuelaVietnamWestern AfricaWestern AsiaWestern EuropeYemenZaireZimbabwe
Income
Income (Families)
Income (Households)
Poverty
Poverty (Families)
Unemployment
Employment Occupations
Employment Industries
Employer Class
Commute Time
Commute Means
School Enrollment
Education by Degree Field
Occupancy
Finances
Physical Characteristics
Saint Paul
Compare Zip Codes
Comparison Subject

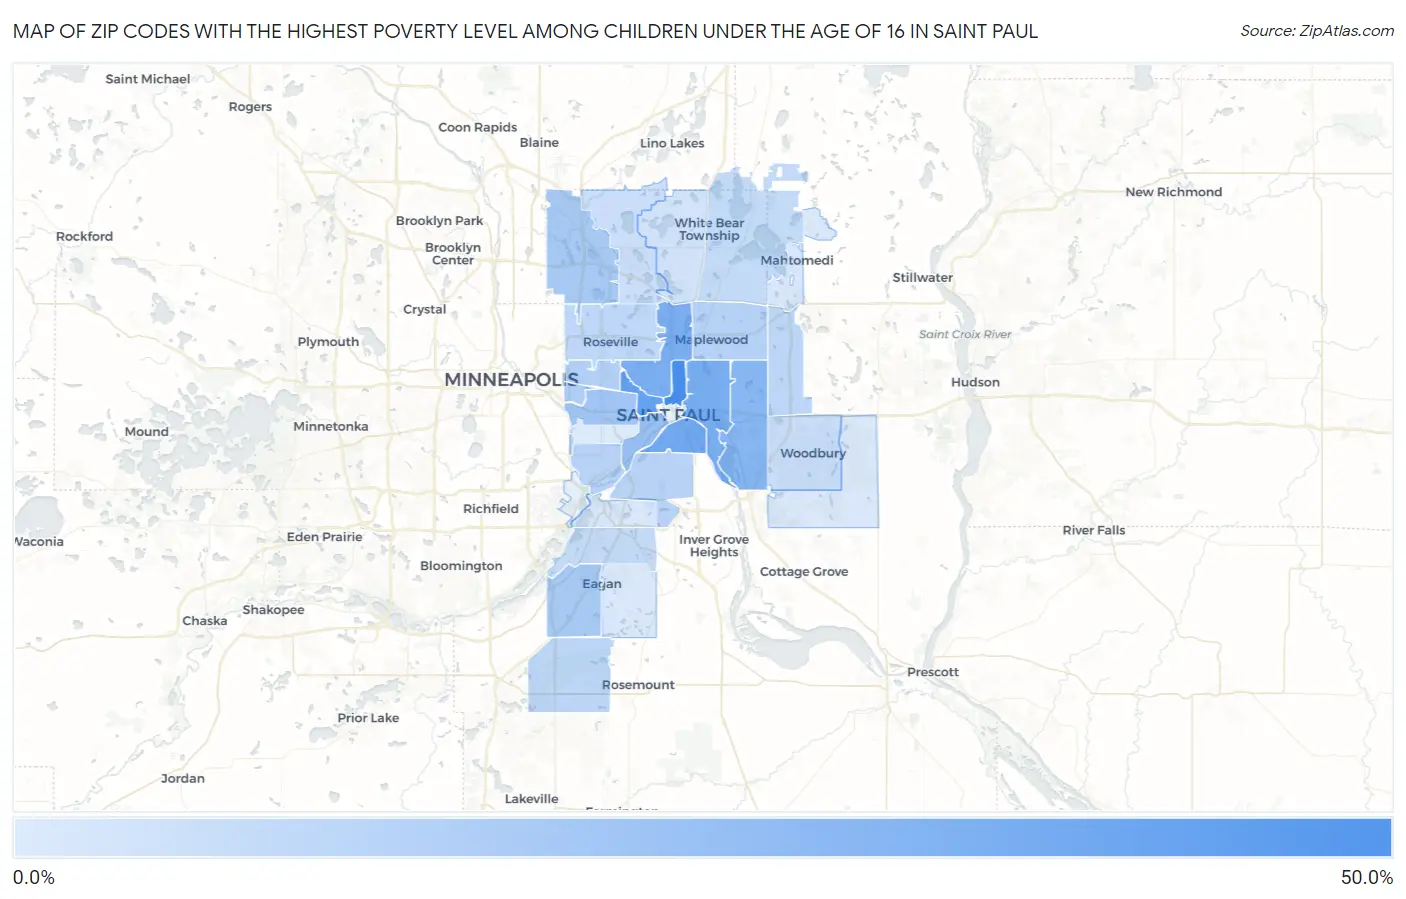
Map of Zip Codes with the Highest Poverty Level Among Children Under the Age of 16 in Saint Paul

0.0%
50.0%
Zip Codes with the Highest Poverty Level Among Children Under the Age of 16 in Saint Paul Map

Zip Codes with the Highest Poverty Level Among Children Under the Age of 16 in Saint Paul, MN

Zip Code Child Poverty vs State vs National
1.5513044.4%11.1%(+33.3)#2216.9%(+27.4)#2,490
2.5510334.4%11.1%(+23.3)#4016.9%(+17.5)#4,354
3.5510730.5%11.1%(+19.4)#5716.9%(+13.5)#5,450
4.5510628.2%11.1%(+17.1)#6816.9%(+11.3)#6,222
5.5511728.1%11.1%(+17.1)#7016.9%(+11.2)#6,255
6.5511923.7%11.1%(+12.6)#9916.9%(+6.72)#8,197
7.5510219.2%11.1%(+8.13)#14716.9%(+2.26)#10,573
8.5510416.6%11.1%(+5.54)#18616.9%(-0.328)#12,211
9.5512214.5%11.1%(+3.45)#23316.9%(-2.43)#13,681
10.5511214.5%11.1%(+3.39)#23416.9%(-2.48)#13,715
11.5511411.6%11.1%(+0.551)#32216.9%(-5.32)#15,939
12.5510811.2%11.1%(+0.181)#33416.9%(-5.69)#16,278
13.5510910.7%11.1%(-0.398)#35116.9%(-6.27)#16,728
14.5511610.3%11.1%(-0.720)#36016.9%(-6.59)#17,008
15.5511810.1%11.1%(-0.928)#36916.9%(-6.80)#17,194
16.551248.9%11.1%(-2.16)#41916.9%(-8.03)#18,313
17.551288.9%11.1%(-2.21)#42016.9%(-8.08)#18,342
18.551138.1%11.1%(-3.00)#44416.9%(-8.87)#19,051
19.551217.2%11.1%(-3.88)#47616.9%(-9.76)#19,842
20.551107.0%11.1%(-4.06)#48516.9%(-9.93)#20,034
21.551255.9%11.1%(-5.13)#52716.9%(-11.0)#21,082
22.551265.4%11.1%(-5.63)#55016.9%(-11.5)#21,589
23.551273.3%11.1%(-7.77)#64216.9%(-13.6)#23,661
24.551201.9%11.1%(-9.13)#69616.9%(-15.0)#24,888
25.551151.7%11.1%(-9.41)#70616.9%(-15.3)#25,113
26.551231.5%11.1%(-9.61)#72016.9%(-15.5)#25,297
27.551291.1%11.1%(-9.92)#73516.9%(-15.8)#25,529
28.551050.74%11.1%(-10.3)#75916.9%(-16.2)#25,788

Common Questions

What are the Top 10 Zip Codes with the Highest Poverty Level Among Children Under the Age of 16 in Saint Paul, MN?
Top 10 Zip Codes with the Highest Poverty Level Among Children Under the Age of 16 in Saint Paul, MN are:
#1
44.4%
#2
34.4%
#3
30.5%
#4
28.2%
#5
28.1%
#6
23.7%
#7
19.2%
#8
16.6%
#9
14.5%
#10
14.5%
What zip code has the Highest Poverty Level Among Children Under the Age of 16 in Saint Paul, MN?
55130 has the Highest Poverty Level Among Children Under the Age of 16 in Saint Paul, MN with 44.4%.
What is the Poverty Level Among Children Under the Age of 16 in Minnesota?
Poverty Level Among Children Under the Age of 16 in Minnesota is 11.1%.
What is the Poverty Level Among Children Under the Age of 16 in the United States?
Poverty Level Among Children Under the Age of 16 in the United States is 16.9%.