Zip Codes with the Highest Percentage of Households with Income Above $200,000 in Saint Paul, MN
RELATED REPORTS & OPTIONS
Household Income | $200k+
Saint Paul
Compare Zip Codes
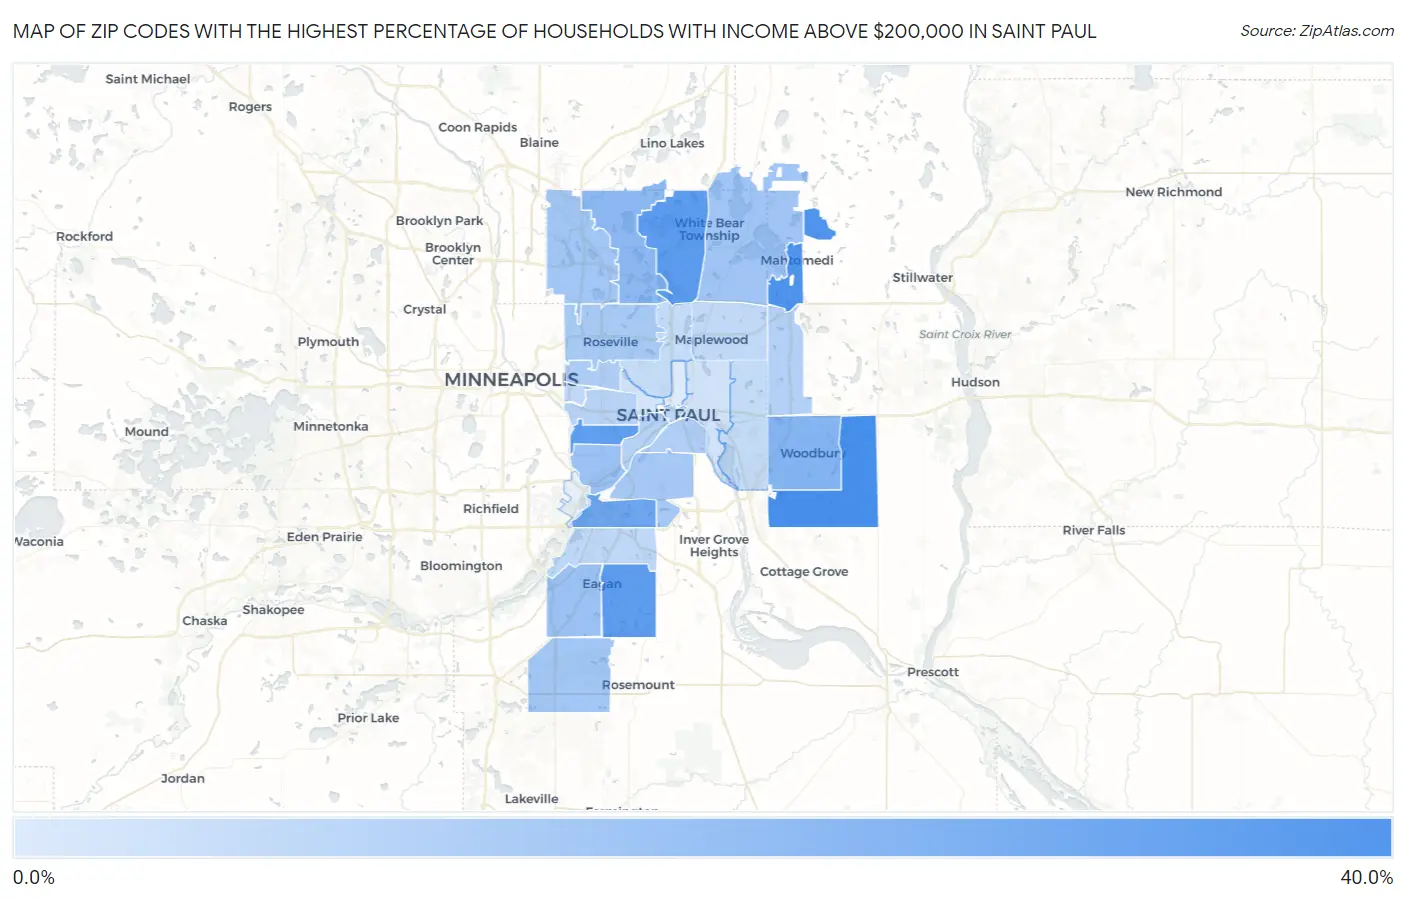
Map of Zip Codes with the Highest Percentage of Households with Income Above $200,000 in Saint Paul
3.0%
32.0%
Zip Codes with the Highest Percentage of Households with Income Above $200,000 in Saint Paul, MN
| Zip Code | Households with Income > $200k | vs State | vs National | |
| 1. | 55129 | 32.0% | 11.9%(+20.1)#17 | 11.4%(+20.6)#1,244 |
| 2. | 55115 | 30.0% | 11.9%(+18.1)#20 | 11.4%(+18.6)#1,455 |
| 3. | 55127 | 28.1% | 11.9%(+16.2)#25 | 11.4%(+16.7)#1,705 |
| 4. | 55123 | 27.1% | 11.9%(+15.2)#30 | 11.4%(+15.7)#1,854 |
| 5. | 55105 | 26.4% | 11.9%(+14.5)#33 | 11.4%(+15.0)#1,964 |
| 6. | 55120 | 23.8% | 11.9%(+11.9)#38 | 11.4%(+12.4)#2,416 |
| 7. | 55125 | 19.0% | 11.9%(+7.10)#63 | 11.4%(+7.60)#3,560 |
| 8. | 55126 | 17.8% | 11.9%(+5.90)#72 | 11.4%(+6.40)#3,901 |
| 9. | 55116 | 14.8% | 11.9%(+2.90)#94 | 11.4%(+3.40)#5,078 |
| 10. | 55122 | 14.7% | 11.9%(+2.80)#97 | 11.4%(+3.30)#5,121 |
| 11. | 55110 | 13.7% | 11.9%(+1.80)#105 | 11.4%(+2.30)#5,615 |
| 12. | 55112 | 13.5% | 11.9%(+1.60)#109 | 11.4%(+2.10)#5,726 |
| 13. | 55124 | 13.3% | 11.9%(+1.40)#110 | 11.4%(+1.90)#5,837 |
| 14. | 55118 | 13.0% | 11.9%(+1.10)#112 | 11.4%(+1.60)#6,007 |
| 15. | 55113 | 12.6% | 11.9%(+0.700)#121 | 11.4%(+1.20)#6,253 |
| 16. | 55108 | 11.1% | 11.9%(-0.800)#153 | 11.4%(-0.300)#7,320 |
| 17. | 55107 | 10.9% | 11.9%(-1.00)#160 | 11.4%(-0.500)#7,492 |
| 18. | 55128 | 10.3% | 11.9%(-1.60)#173 | 11.4%(-1.10)#7,955 |
| 19. | 55102 | 9.8% | 11.9%(-2.10)#192 | 11.4%(-1.60)#8,453 |
| 20. | 55104 | 9.6% | 11.9%(-2.30)#199 | 11.4%(-1.80)#8,623 |
| 21. | 55101 | 8.5% | 11.9%(-3.40)#247 | 11.4%(-2.90)#9,784 |
| 22. | 55121 | 8.2% | 11.9%(-3.70)#254 | 11.4%(-3.20)#10,130 |
| 23. | 55114 | 8.0% | 11.9%(-3.90)#266 | 11.4%(-3.40)#10,421 |
| 24. | 55109 | 7.7% | 11.9%(-4.20)#279 | 11.4%(-3.70)#10,754 |
| 25. | 55119 | 7.0% | 11.9%(-4.90)#322 | 11.4%(-4.40)#11,745 |
| 26. | 55117 | 6.9% | 11.9%(-5.00)#330 | 11.4%(-4.50)#11,901 |
| 27. | 55106 | 4.9% | 11.9%(-7.00)#507 | 11.4%(-6.50)#15,799 |
| 28. | 55103 | 4.6% | 11.9%(-7.30)#535 | 11.4%(-6.80)#16,560 |
| 29. | 55130 | 3.0% | 11.9%(-8.90)#690 | 11.4%(-8.40)#20,917 |
1
Common Questions
What are the Top 10 Zip Codes with the Highest Percentage of Households with Income Above $200,000 in Saint Paul, MN?
Top 10 Zip Codes with the Highest Percentage of Households with Income Above $200,000 in Saint Paul, MN are:
What zip code has the Highest Percentage of Households with Income Above $200,000 in Saint Paul, MN?
55129 has the Highest Percentage of Households with Income Above $200,000 in Saint Paul, MN with 32.0%.
What is the Percentage of Households with Income Above $200,000 in Minnesota?
Percentage of Households with Income Above $200,000 in Minnesota is 11.9%.
What is the Percentage of Households with Income Above $200,000 in the United States?
Percentage of Households with Income Above $200,000 in the United States is 11.4%.