Zip Codes with the Highest Percentage of Population Employed in Accommodation & Food Services in Saint Paul, MN
RELATED REPORTS & OPTIONS
Accommodation & Food Services
Saint Paul
Compare Zip Codes
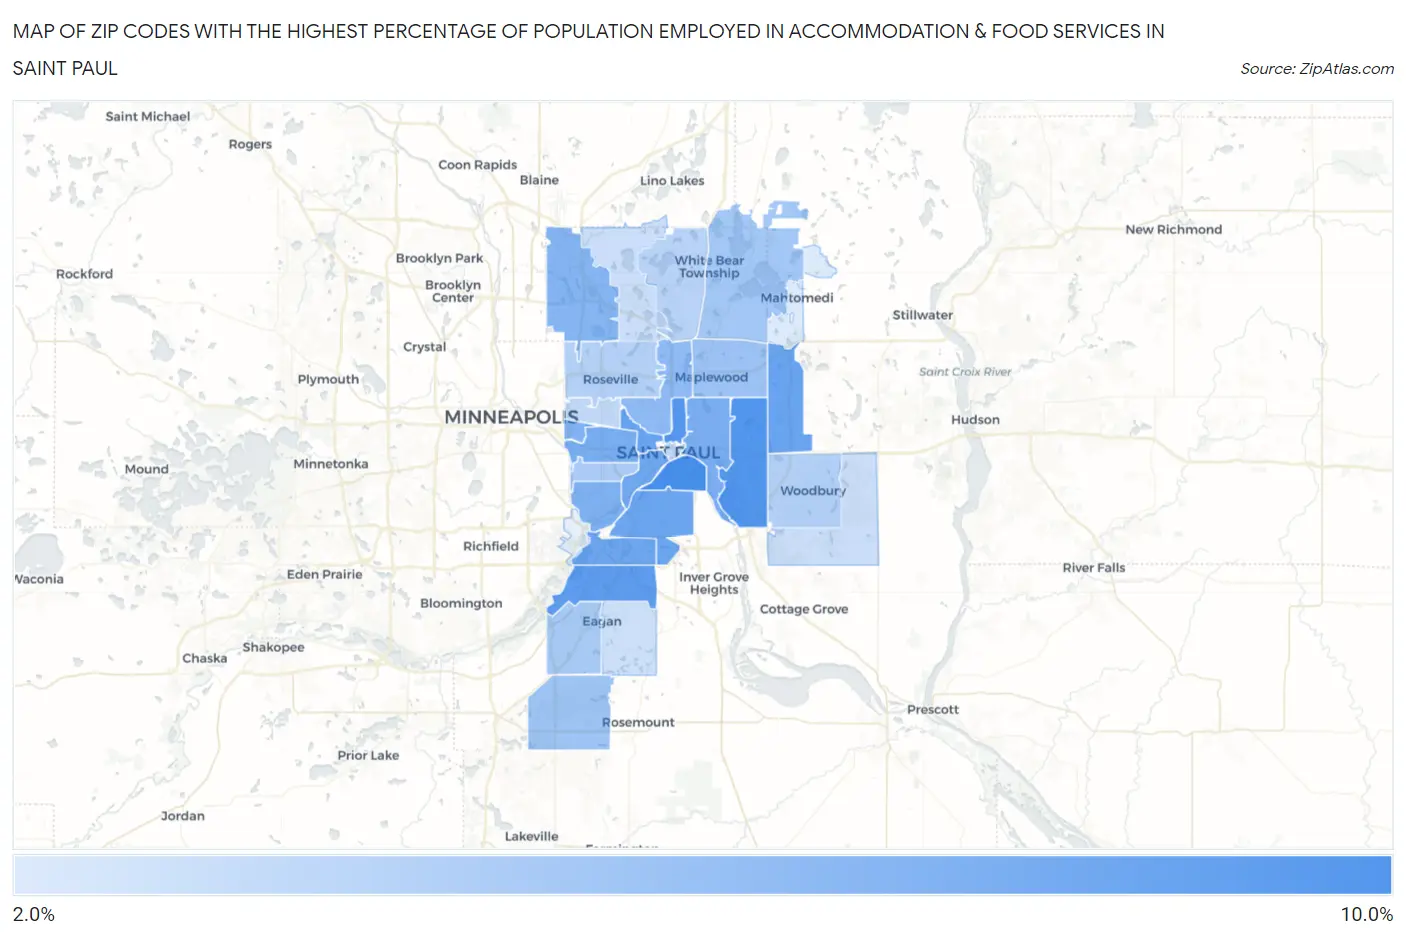
Map of Zip Codes with the Highest Percentage of Population Employed in Accommodation & Food Services in Saint Paul
2.5%
9.2%
Zip Codes with the Highest Percentage of Population Employed in Accommodation & Food Services in Saint Paul, MN
| Zip Code | % Employed | vs State | vs National | |
| 1. | 55107 | 9.2% | 5.5%(+3.73)#71 | 6.9%(+2.36)#5,589 |
| 2. | 55119 | 8.7% | 5.5%(+3.14)#89 | 6.9%(+1.78)#6,542 |
| 3. | 55130 | 8.6% | 5.5%(+3.12)#91 | 6.9%(+1.75)#6,572 |
| 4. | 55121 | 8.2% | 5.5%(+2.70)#105 | 6.9%(+1.34)#7,383 |
| 5. | 55128 | 7.7% | 5.5%(+2.18)#121 | 6.9%(+0.818)#8,498 |
| 6. | 55103 | 7.7% | 5.5%(+2.17)#125 | 6.9%(+0.802)#8,551 |
| 7. | 55118 | 7.6% | 5.5%(+2.06)#133 | 6.9%(+0.696)#8,794 |
| 8. | 55120 | 7.4% | 5.5%(+1.90)#138 | 6.9%(+0.537)#9,203 |
| 9. | 55102 | 7.3% | 5.5%(+1.81)#140 | 6.9%(+0.441)#9,451 |
| 10. | 55104 | 7.0% | 5.5%(+1.48)#155 | 6.9%(+0.119)#10,308 |
| 11. | 55106 | 7.0% | 5.5%(+1.45)#159 | 6.9%(+0.082)#10,438 |
| 12. | 55116 | 6.7% | 5.5%(+1.16)#175 | 6.9%(-0.202)#11,259 |
| 13. | 55114 | 6.6% | 5.5%(+1.13)#180 | 6.9%(-0.233)#11,367 |
| 14. | 55112 | 6.4% | 5.5%(+0.915)#197 | 6.9%(-0.451)#12,059 |
| 15. | 55117 | 6.0% | 5.5%(+0.506)#235 | 6.9%(-0.860)#13,379 |
| 16. | 55109 | 5.4% | 5.5%(-0.084)#295 | 6.9%(-1.45)#15,293 |
| 17. | 55124 | 5.2% | 5.5%(-0.290)#316 | 6.9%(-1.66)#16,019 |
| 18. | 55110 | 5.1% | 5.5%(-0.455)#333 | 6.9%(-1.82)#16,608 |
| 19. | 55122 | 4.8% | 5.5%(-0.707)#357 | 6.9%(-2.07)#17,466 |
| 20. | 55105 | 4.7% | 5.5%(-0.791)#372 | 6.9%(-2.16)#17,738 |
| 21. | 55125 | 4.4% | 5.5%(-1.16)#417 | 6.9%(-2.52)#18,972 |
| 22. | 55113 | 4.3% | 5.5%(-1.19)#422 | 6.9%(-2.56)#19,105 |
| 23. | 55127 | 4.1% | 5.5%(-1.37)#445 | 6.9%(-2.74)#19,682 |
| 24. | 55101 | 3.9% | 5.5%(-1.57)#473 | 6.9%(-2.94)#20,340 |
| 25. | 55108 | 3.7% | 5.5%(-1.79)#504 | 6.9%(-3.15)#21,010 |
| 26. | 55126 | 3.3% | 5.5%(-2.20)#577 | 6.9%(-3.57)#22,346 |
| 27. | 55129 | 3.3% | 5.5%(-2.23)#583 | 6.9%(-3.59)#22,429 |
| 28. | 55123 | 3.2% | 5.5%(-2.32)#598 | 6.9%(-3.69)#22,729 |
| 29. | 55115 | 2.5% | 5.5%(-3.02)#684 | 6.9%(-4.38)#24,503 |
1
Common Questions
What are the Top 10 Zip Codes with the Highest Percentage of Population Employed in Accommodation & Food Services in Saint Paul, MN?
Top 10 Zip Codes with the Highest Percentage of Population Employed in Accommodation & Food Services in Saint Paul, MN are:
What zip code has the Highest Percentage of Population Employed in Accommodation & Food Services in Saint Paul, MN?
55107 has the Highest Percentage of Population Employed in Accommodation & Food Services in Saint Paul, MN with 9.2%.
What is the Percentage of Population Employed in Accommodation & Food Services in Minnesota?
Percentage of Population Employed in Accommodation & Food Services in Minnesota is 5.5%.
What is the Percentage of Population Employed in Accommodation & Food Services in the United States?
Percentage of Population Employed in Accommodation & Food Services in the United States is 6.9%.