Zip Codes with the Highest Percentage of Population Employed in Security & Protection in Saint Paul, MN
RELATED REPORTS & OPTIONS
Security & Protection
Saint Paul
Compare Zip Codes
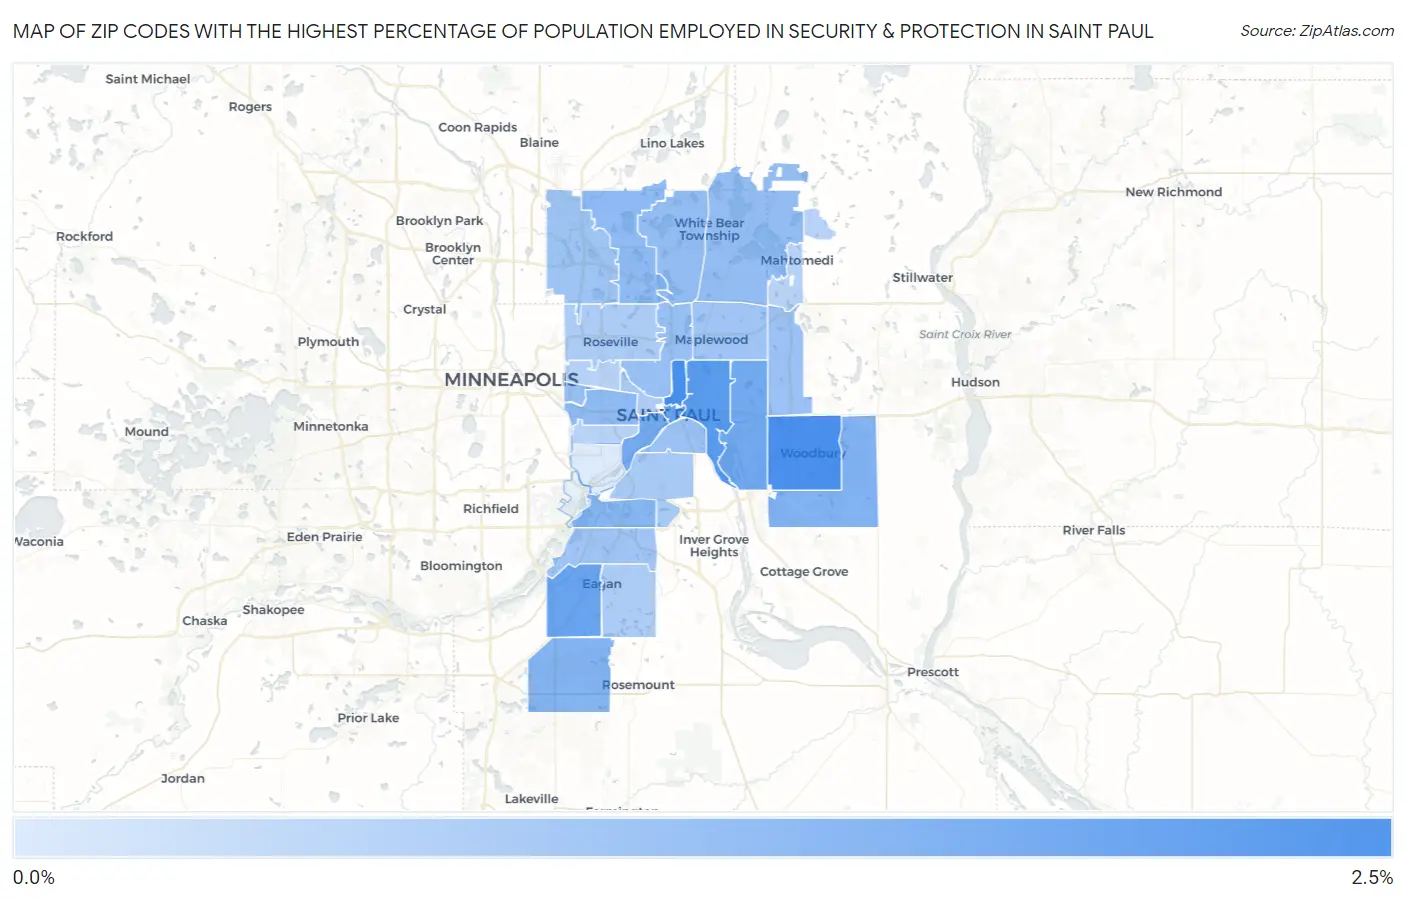
Map of Zip Codes with the Highest Percentage of Population Employed in Security & Protection in Saint Paul
0.27%
2.4%
Zip Codes with the Highest Percentage of Population Employed in Security & Protection in Saint Paul, MN
| Zip Code | % Employed | vs State | vs National | |
| 1. | 55130 | 2.4% | 1.3%(+1.08)#102 | 2.1%(+0.247)#10,080 |
| 2. | 55125 | 2.4% | 1.3%(+1.04)#110 | 2.1%(+0.208)#10,294 |
| 3. | 55106 | 2.2% | 1.3%(+0.853)#134 | 2.1%(+0.024)#11,432 |
| 4. | 55101 | 2.0% | 1.3%(+0.673)#162 | 2.1%(-0.156)#12,605 |
| 5. | 55122 | 1.9% | 1.3%(+0.575)#184 | 2.1%(-0.254)#13,262 |
| 6. | 55119 | 1.8% | 1.3%(+0.444)#200 | 2.1%(-0.385)#14,200 |
| 7. | 55102 | 1.8% | 1.3%(+0.441)#201 | 2.1%(-0.388)#14,228 |
| 8. | 55129 | 1.6% | 1.3%(+0.241)#245 | 2.1%(-0.588)#15,716 |
| 9. | 55124 | 1.5% | 1.3%(+0.223)#251 | 2.1%(-0.607)#15,864 |
| 10. | 55120 | 1.5% | 1.3%(+0.150)#277 | 2.1%(-0.679)#16,426 |
| 11. | 55104 | 1.4% | 1.3%(+0.071)#287 | 2.1%(-0.758)#17,019 |
| 12. | 55126 | 1.4% | 1.3%(+0.053)#294 | 2.1%(-0.777)#17,173 |
| 13. | 55127 | 1.3% | 1.3%(-0.001)#307 | 2.1%(-0.831)#17,601 |
| 14. | 55110 | 1.3% | 1.3%(-0.011)#311 | 2.1%(-0.840)#17,665 |
| 15. | 55114 | 1.3% | 1.3%(-0.053)#324 | 2.1%(-0.882)#18,011 |
| 16. | 55117 | 1.2% | 1.3%(-0.081)#332 | 2.1%(-0.910)#18,219 |
| 17. | 55128 | 1.2% | 1.3%(-0.097)#338 | 2.1%(-0.926)#18,337 |
| 18. | 55107 | 1.2% | 1.3%(-0.103)#340 | 2.1%(-0.932)#18,382 |
| 19. | 55112 | 1.2% | 1.3%(-0.162)#359 | 2.1%(-0.991)#18,833 |
| 20. | 55121 | 1.1% | 1.3%(-0.216)#379 | 2.1%(-1.05)#19,262 |
| 21. | 55109 | 1.1% | 1.3%(-0.217)#381 | 2.1%(-1.05)#19,268 |
| 22. | 55118 | 1.0% | 1.3%(-0.305)#401 | 2.1%(-1.13)#19,928 |
| 23. | 55113 | 0.97% | 1.3%(-0.354)#421 | 2.1%(-1.18)#20,329 |
| 24. | 55123 | 0.95% | 1.3%(-0.368)#427 | 2.1%(-1.20)#20,427 |
| 25. | 55103 | 0.94% | 1.3%(-0.384)#441 | 2.1%(-1.21)#20,539 |
| 26. | 55115 | 0.80% | 1.3%(-0.518)#490 | 2.1%(-1.35)#21,398 |
| 27. | 55105 | 0.79% | 1.3%(-0.531)#493 | 2.1%(-1.36)#21,474 |
| 28. | 55108 | 0.77% | 1.3%(-0.544)#499 | 2.1%(-1.37)#21,567 |
| 29. | 55116 | 0.27% | 1.3%(-1.05)#667 | 2.1%(-1.88)#24,295 |
1
Common Questions
What are the Top 10 Zip Codes with the Highest Percentage of Population Employed in Security & Protection in Saint Paul, MN?
Top 10 Zip Codes with the Highest Percentage of Population Employed in Security & Protection in Saint Paul, MN are:
What zip code has the Highest Percentage of Population Employed in Security & Protection in Saint Paul, MN?
55130 has the Highest Percentage of Population Employed in Security & Protection in Saint Paul, MN with 2.4%.
What is the Percentage of Population Employed in Security & Protection in Minnesota?
Percentage of Population Employed in Security & Protection in Minnesota is 1.3%.
What is the Percentage of Population Employed in Security & Protection in the United States?
Percentage of Population Employed in Security & Protection in the United States is 2.1%.