Zip Codes with the Highest Percentage of Population Employed in Office & Administration in Pontiac, MI
RELATED REPORTS & OPTIONS
Office & Administration
Pontiac
Compare Zip Codes
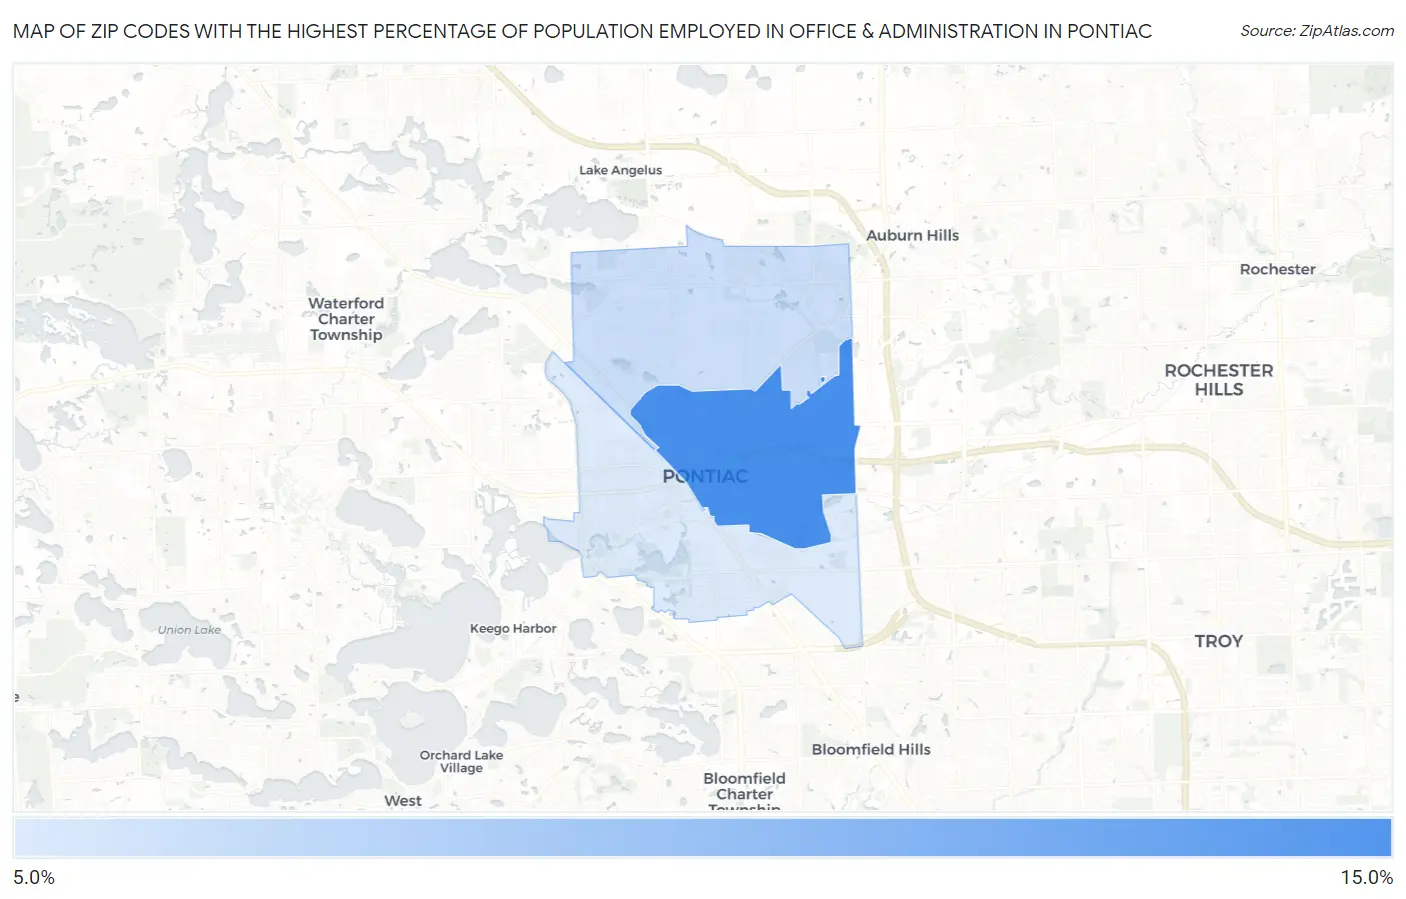
Map of Zip Codes with the Highest Percentage of Population Employed in Office & Administration in Pontiac
8.9%
11.1%
Zip Codes with the Highest Percentage of Population Employed in Office & Administration in Pontiac, MI
| Zip Code | % Employed | vs State | vs National | |
| 1. | 48342 | 11.1% | 10.8%(+0.260)#406 | 10.9%(+0.211)#13,628 |
| 2. | 48340 | 9.2% | 10.8%(-1.64)#631 | 10.9%(-1.69)#19,753 |
| 3. | 48341 | 8.9% | 10.8%(-1.92)#665 | 10.9%(-1.97)#20,581 |
1
Common Questions
What are the Top Zip Codes with the Highest Percentage of Population Employed in Office & Administration in Pontiac, MI?
Top Zip Codes with the Highest Percentage of Population Employed in Office & Administration in Pontiac, MI are:
What zip code has the Highest Percentage of Population Employed in Office & Administration in Pontiac, MI?
48342 has the Highest Percentage of Population Employed in Office & Administration in Pontiac, MI with 11.1%.
What is the Percentage of Population Employed in Office & Administration in Pontiac, MI?
Percentage of Population Employed in Office & Administration in Pontiac is 9.6%.
What is the Percentage of Population Employed in Office & Administration in Michigan?
Percentage of Population Employed in Office & Administration in Michigan is 10.8%.
What is the Percentage of Population Employed in Office & Administration in the United States?
Percentage of Population Employed in Office & Administration in the United States is 10.9%.