Zip Codes with the Highest Percentage of Population Employed in Health Diagnosing & Treating in Pontiac, MI
RELATED REPORTS & OPTIONS
Health Diagnosing & Treating
Pontiac
Compare Zip Codes
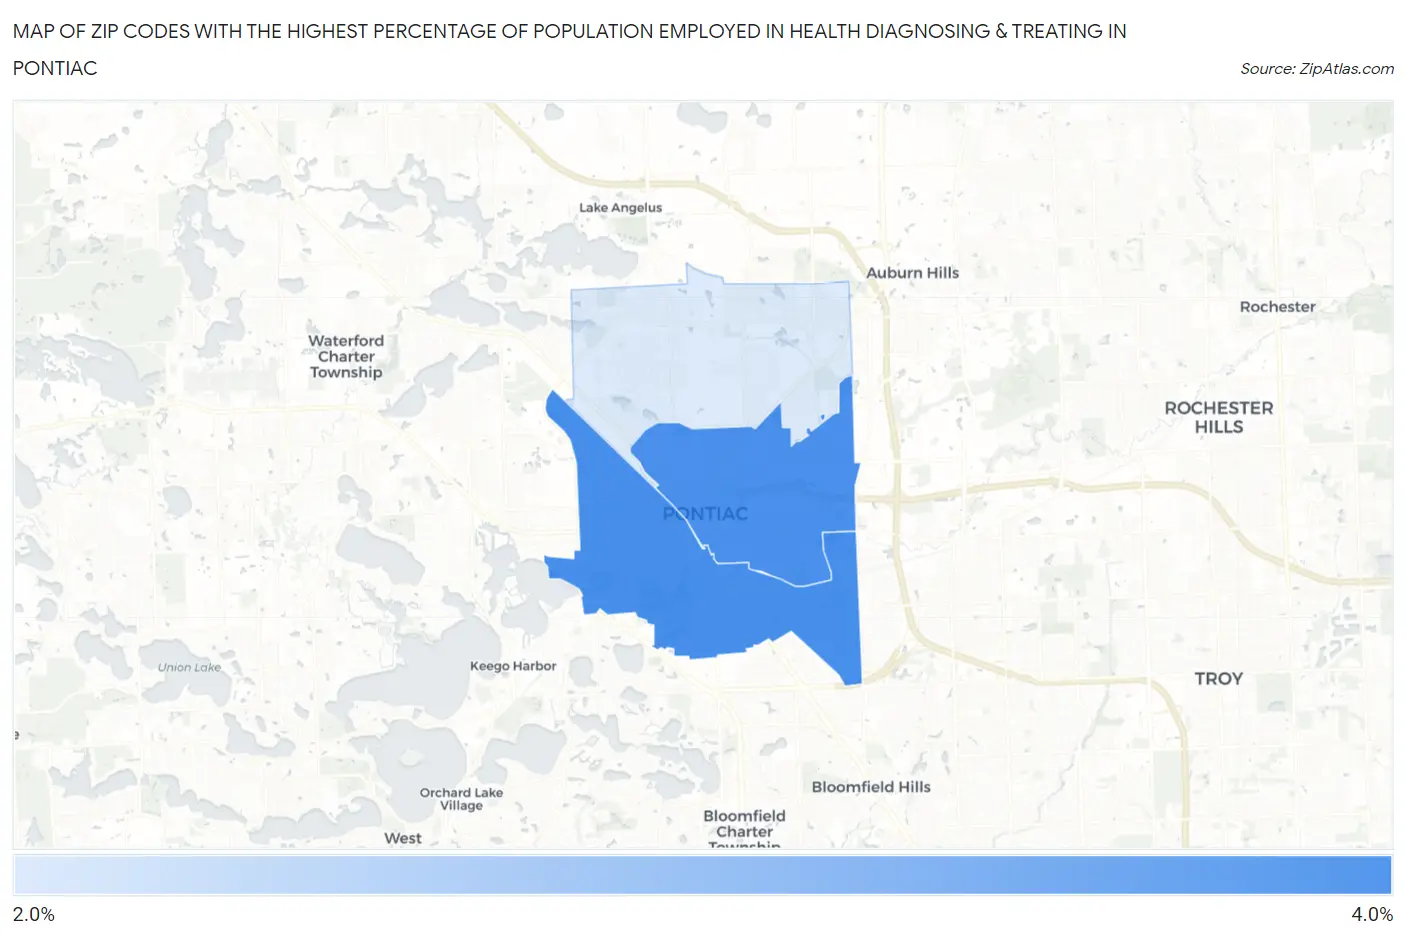
Map of Zip Codes with the Highest Percentage of Population Employed in Health Diagnosing & Treating in Pontiac
2.7%
3.7%
Zip Codes with the Highest Percentage of Population Employed in Health Diagnosing & Treating in Pontiac, MI
| Zip Code | % Employed | vs State | vs National | |
| 1. | 48341 | 3.7% | 6.6%(-2.96)#760 | 6.2%(-2.56)#22,341 |
| 2. | 48342 | 3.7% | 6.6%(-2.97)#761 | 6.2%(-2.57)#22,377 |
| 3. | 48340 | 2.7% | 6.6%(-3.92)#849 | 6.2%(-3.51)#24,973 |
1
Common Questions
What are the Top Zip Codes with the Highest Percentage of Population Employed in Health Diagnosing & Treating in Pontiac, MI?
Top Zip Codes with the Highest Percentage of Population Employed in Health Diagnosing & Treating in Pontiac, MI are:
What zip code has the Highest Percentage of Population Employed in Health Diagnosing & Treating in Pontiac, MI?
48341 has the Highest Percentage of Population Employed in Health Diagnosing & Treating in Pontiac, MI with 3.7%.
What is the Percentage of Population Employed in Health Diagnosing & Treating in Pontiac, MI?
Percentage of Population Employed in Health Diagnosing & Treating in Pontiac is 3.3%.
What is the Percentage of Population Employed in Health Diagnosing & Treating in Michigan?
Percentage of Population Employed in Health Diagnosing & Treating in Michigan is 6.6%.
What is the Percentage of Population Employed in Health Diagnosing & Treating in the United States?
Percentage of Population Employed in Health Diagnosing & Treating in the United States is 6.2%.