Zip Codes with the Highest Percentage of Population Employed in Administrative & Support Services in Pontiac, MI
RELATED REPORTS & OPTIONS
Administrative & Support Services
Pontiac
Compare Zip Codes
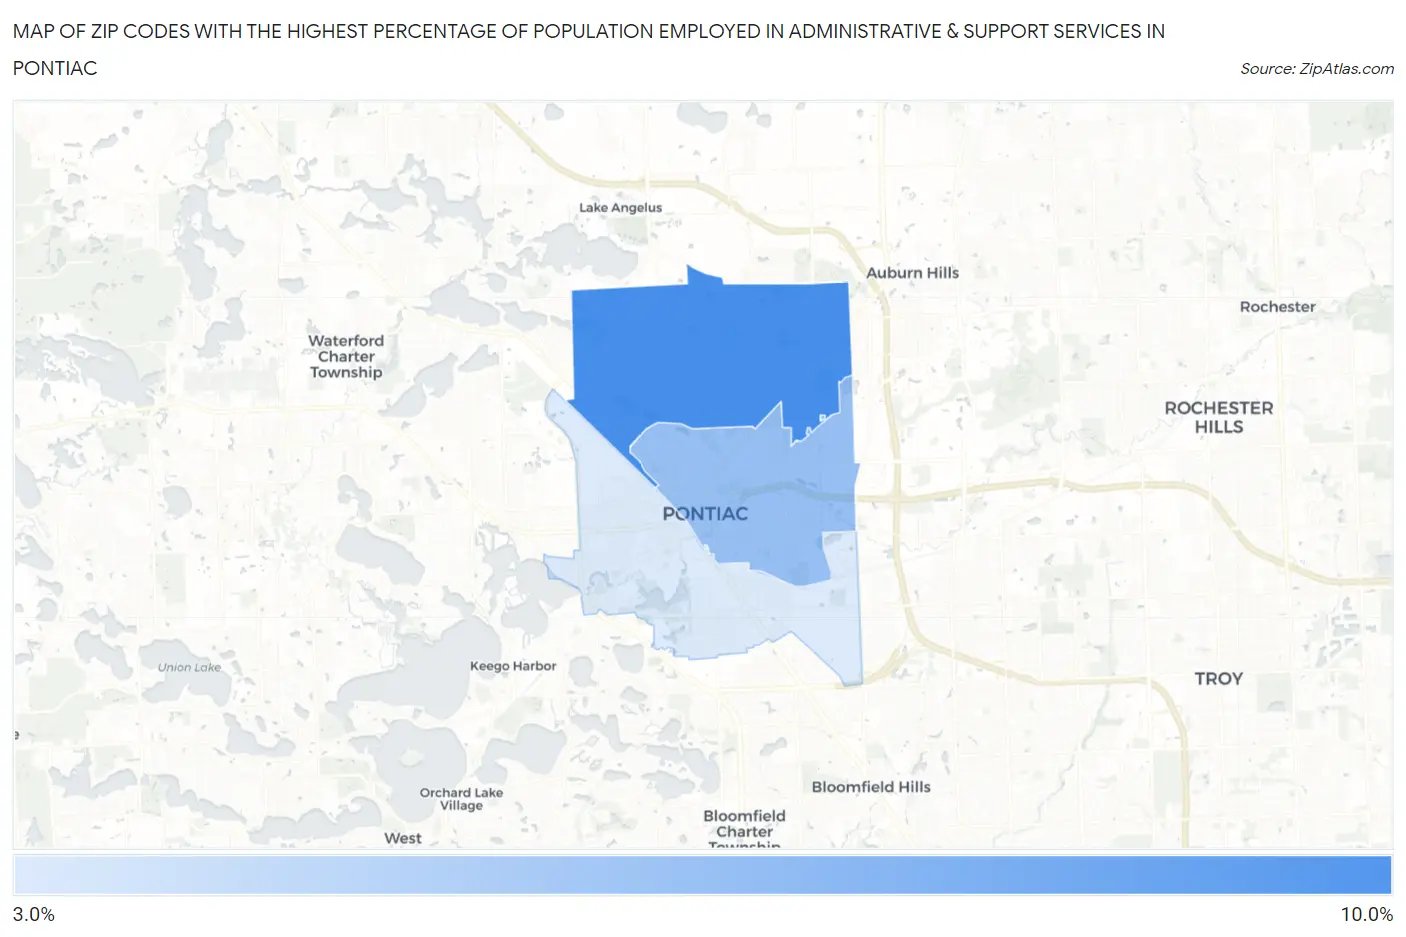
Map of Zip Codes with the Highest Percentage of Population Employed in Administrative & Support Services in Pontiac
3.4%
9.0%
Zip Codes with the Highest Percentage of Population Employed in Administrative & Support Services in Pontiac, MI
| Zip Code | % Employed | vs State | vs National | |
| 1. | 48340 | 9.0% | 3.7%(+5.25)#22 | 4.1%(+4.82)#1,700 |
| 2. | 48342 | 5.9% | 3.7%(+2.18)#117 | 4.1%(+1.76)#4,940 |
| 3. | 48341 | 3.4% | 3.7%(-0.365)#435 | 4.1%(-0.787)#13,631 |
1
Common Questions
What are the Top Zip Codes with the Highest Percentage of Population Employed in Administrative & Support Services in Pontiac, MI?
Top Zip Codes with the Highest Percentage of Population Employed in Administrative & Support Services in Pontiac, MI are:
What zip code has the Highest Percentage of Population Employed in Administrative & Support Services in Pontiac, MI?
48340 has the Highest Percentage of Population Employed in Administrative & Support Services in Pontiac, MI with 9.0%.
What is the Percentage of Population Employed in Administrative & Support Services in Pontiac, MI?
Percentage of Population Employed in Administrative & Support Services in Pontiac is 6.5%.
What is the Percentage of Population Employed in Administrative & Support Services in Michigan?
Percentage of Population Employed in Administrative & Support Services in Michigan is 3.7%.
What is the Percentage of Population Employed in Administrative & Support Services in the United States?
Percentage of Population Employed in Administrative & Support Services in the United States is 4.1%.