Zip Codes with the Highest Percentage of Population Employed in Food Preparation & Serving in Pontiac, MI
RELATED REPORTS & OPTIONS
Food Preparation & Serving
Pontiac
Compare Zip Codes
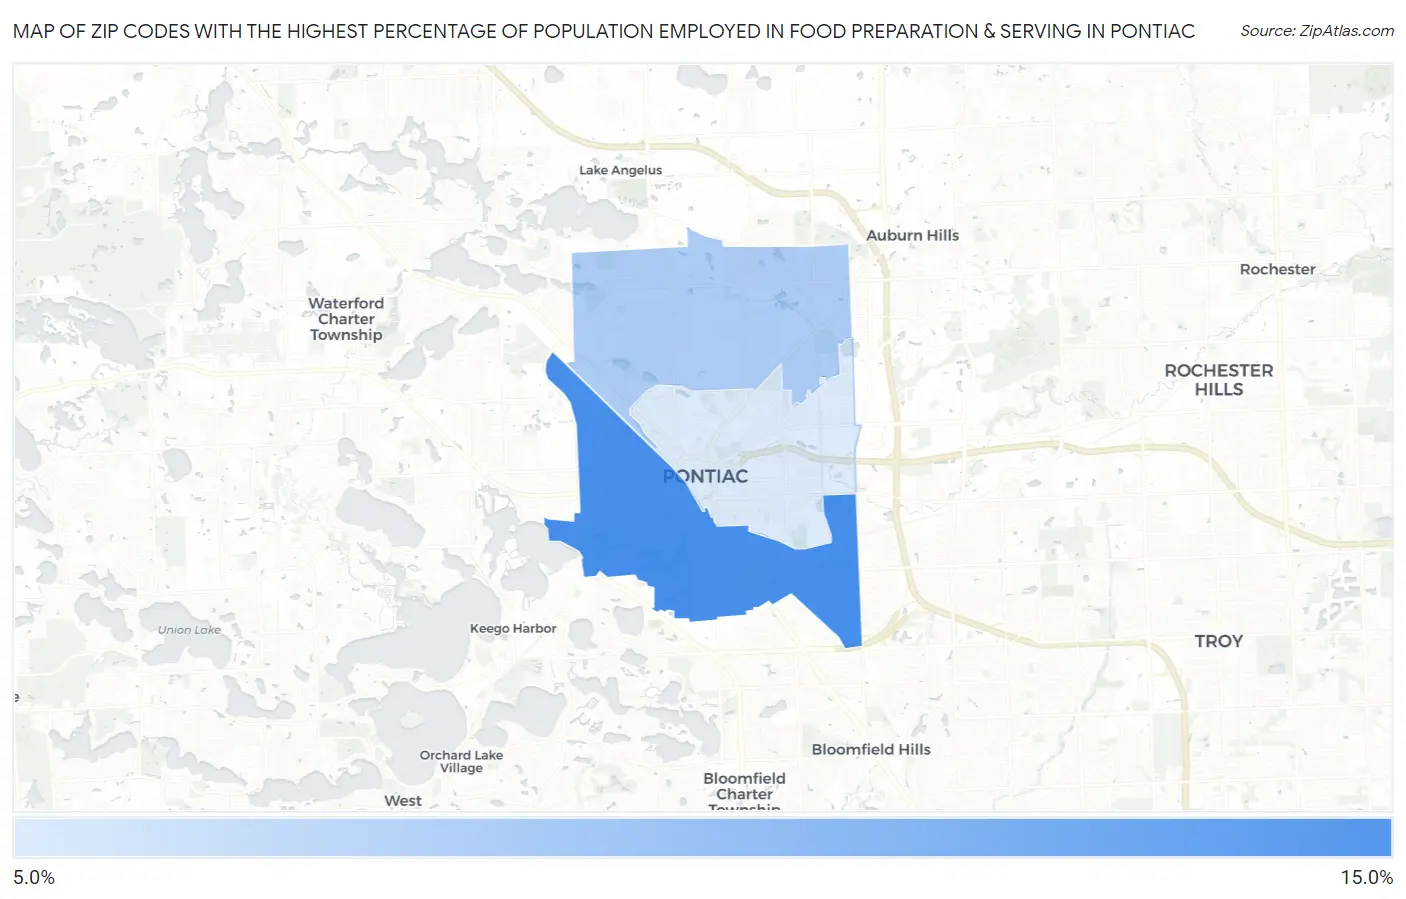
Map of Zip Codes with the Highest Percentage of Population Employed in Food Preparation & Serving in Pontiac
6.6%
10.3%
Zip Codes with the Highest Percentage of Population Employed in Food Preparation & Serving in Pontiac, MI
| Zip Code | % Employed | vs State | vs National | |
| 1. | 48341 | 10.3% | 5.7%(+4.59)#62 | 5.3%(+4.98)#2,444 |
| 2. | 48340 | 7.8% | 5.7%(+2.13)#167 | 5.3%(+2.51)#5,057 |
| 3. | 48342 | 6.6% | 5.7%(+0.971)#268 | 5.3%(+1.36)#7,499 |
1
Common Questions
What are the Top Zip Codes with the Highest Percentage of Population Employed in Food Preparation & Serving in Pontiac, MI?
Top Zip Codes with the Highest Percentage of Population Employed in Food Preparation & Serving in Pontiac, MI are:
What zip code has the Highest Percentage of Population Employed in Food Preparation & Serving in Pontiac, MI?
48341 has the Highest Percentage of Population Employed in Food Preparation & Serving in Pontiac, MI with 10.3%.
What is the Percentage of Population Employed in Food Preparation & Serving in Pontiac, MI?
Percentage of Population Employed in Food Preparation & Serving in Pontiac is 8.3%.
What is the Percentage of Population Employed in Food Preparation & Serving in Michigan?
Percentage of Population Employed in Food Preparation & Serving in Michigan is 5.7%.
What is the Percentage of Population Employed in Food Preparation & Serving in the United States?
Percentage of Population Employed in Food Preparation & Serving in the United States is 5.3%.