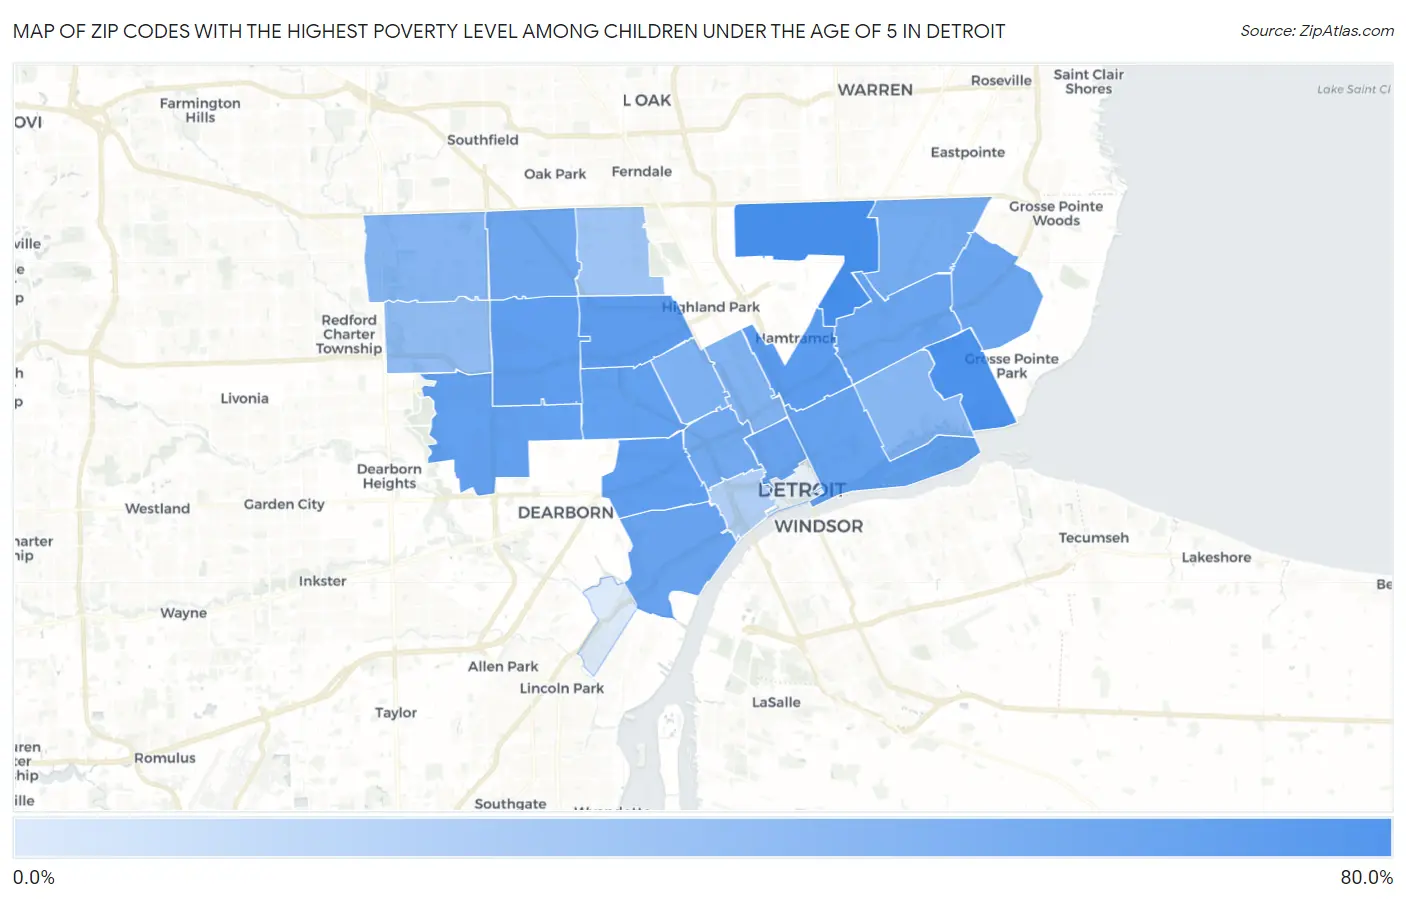
Zip Codes with the Highest Poverty Level Among Children Under the Age of 5 in Detroit, MI
RELATED REPORTS & OPTIONS
Highest Poverty | Child 0-5
Detroit
Compare Zip Codes
Map of Zip Codes with the Highest Poverty Level Among Children Under the Age of 5 in Detroit
4.2%
66.3%
Zip Codes with the Highest Poverty Level Among Children Under the Age of 5 in Detroit, MI
| Zip Code | Child Poverty | vs State | vs National | |
| 1. | 48234 | 66.3% | 20.1%(+46.1)#20 | 18.1%(+48.2)#1,332 |
| 2. | 48215 | 64.4% | 20.1%(+44.2)#23 | 18.1%(+46.3)#1,419 |
| 3. | 48211 | 57.2% | 20.1%(+37.1)#33 | 18.1%(+39.2)#1,878 |
| 4. | 48238 | 55.2% | 20.1%(+35.1)#35 | 18.1%(+37.2)#2,057 |
| 5. | 48227 | 53.6% | 20.1%(+33.5)#43 | 18.1%(+35.5)#2,180 |
| 6. | 48210 | 53.2% | 20.1%(+33.1)#44 | 18.1%(+35.2)#2,230 |
| 7. | 48204 | 52.6% | 20.1%(+32.5)#46 | 18.1%(+34.6)#2,288 |
| 8. | 48228 | 52.1% | 20.1%(+32.0)#47 | 18.1%(+34.0)#2,337 |
| 9. | 48207 | 51.0% | 20.1%(+30.9)#51 | 18.1%(+33.0)#2,425 |
| 10. | 48201 | 50.7% | 20.1%(+30.6)#52 | 18.1%(+32.7)#2,450 |
| 11. | 48209 | 50.7% | 20.1%(+30.6)#53 | 18.1%(+32.6)#2,458 |
| 12. | 48213 | 49.5% | 20.1%(+29.4)#60 | 18.1%(+31.5)#2,641 |
| 13. | 48224 | 47.7% | 20.1%(+27.6)#70 | 18.1%(+29.7)#2,841 |
| 14. | 48235 | 47.5% | 20.1%(+27.3)#71 | 18.1%(+29.4)#2,870 |
| 15. | 48208 | 45.4% | 20.1%(+25.3)#79 | 18.1%(+27.4)#3,125 |
| 16. | 48205 | 44.1% | 20.1%(+24.0)#85 | 18.1%(+26.1)#3,320 |
| 17. | 48206 | 39.5% | 20.1%(+19.3)#110 | 18.1%(+21.4)#4,130 |
| 18. | 48202 | 38.8% | 20.1%(+18.7)#114 | 18.1%(+20.8)#4,245 |
| 19. | 48219 | 36.5% | 20.1%(+16.4)#131 | 18.1%(+18.5)#4,697 |
| 20. | 48214 | 36.0% | 20.1%(+15.9)#139 | 18.1%(+18.0)#4,819 |
| 21. | 48223 | 32.4% | 20.1%(+12.3)#169 | 18.1%(+14.3)#5,734 |
| 22. | 48221 | 26.5% | 20.1%(+6.42)#244 | 18.1%(+8.48)#7,464 |
| 23. | 48216 | 20.5% | 20.1%(+0.424)#334 | 18.1%(+2.48)#9,787 |
| 24. | 48217 | 4.2% | 20.1%(-15.9)#702 | 18.1%(-13.9)#19,347 |
1
Common Questions
What are the Top 10 Zip Codes with the Highest Poverty Level Among Children Under the Age of 5 in Detroit, MI?
Top 10 Zip Codes with the Highest Poverty Level Among Children Under the Age of 5 in Detroit, MI are:
What zip code has the Highest Poverty Level Among Children Under the Age of 5 in Detroit, MI?
48234 has the Highest Poverty Level Among Children Under the Age of 5 in Detroit, MI with 66.3%.
What is the Poverty Level Among Children Under the Age of 5 in Detroit, MI?
Poverty Level Among Children Under the Age of 5 in Detroit is 46.7%.
What is the Poverty Level Among Children Under the Age of 5 in Michigan?
Poverty Level Among Children Under the Age of 5 in Michigan is 20.1%.
What is the Poverty Level Among Children Under the Age of 5 in the United States?
Poverty Level Among Children Under the Age of 5 in the United States is 18.1%.