Zip Codes with the Largest French Canadian Community in Detroit, MI

RELATED REPORTS & OPTIONS

French Canadian
Population
Families and Households
Female Fertility
Female Fertility (Unmarried)
Race (Community Size)
Race (Percentage)
Ancestry (Community Size)
AfricanAlbanianAmericanApacheArabArgentineanArmenianAssyrian / Chaldean / SyriacAustralianAustrianBahamianBangladeshiBarbadianBelgianBelizeanBermudanBhutaneseBlackfeetBrazilianBritishBritish West IndianBurmeseCanadianCentral AmericanCentral American IndianCherokeeChippewaChoctawColombianCosta RicanCreekCroatianCubanCzechCzechoslovakianDanishDominicanDutchEastern EuropeanEcuadorianEgyptianEnglishEthiopianEuropeanFilipinoFinnishFrenchFrench American IndianFrench CanadianGermanGhanaianGreekGuamanian / ChamorroGuatemalanHaitianHonduranHungarianIndian (Asian)IndonesianIranianIraqiIrishIroquoisIsraeliItalianJamaicanJapaneseJordanianKoreanLebaneseLiberianLithuanianLumbeeMacedonianMalteseMexicanMexican American IndianMoroccanNative HawaiianNavajoNew ZealanderNicaraguanNigerianNorthern EuropeanNorwegianOttawaPakistaniPalestinianPanamanianPennsylvania GermanPeruvianPolishPortuguesePotawatomiPuerto RicanRomanianRussianSalvadoranSamoanScandinavianScotch-IrishScottishSenegaleseSerbianSlavicSlovakSloveneSouth AfricanSouth AmericanSouth American IndianSpaniardSpanishSri LankanSubsaharan AfricanSudaneseSwedishSwissSyrianThaiTrinidadian and TobagonianTurkishUkrainianVenezuelanVietnameseWelshWest IndianYugoslavian
Ancestry (Percentage)
AfricanAlbanianAmericanApacheArabArgentineanArmenianAssyrian / Chaldean / SyriacAustralianAustrianBahamianBangladeshiBarbadianBelgianBelizeanBermudanBhutaneseBlackfeetBrazilianBritishBritish West IndianBurmeseCanadianCentral AmericanCentral American IndianCherokeeChippewaChoctawColombianCosta RicanCreekCroatianCubanCzechCzechoslovakianDanishDominicanDutchEastern EuropeanEcuadorianEgyptianEnglishEthiopianEuropeanFilipinoFinnishFrenchFrench American IndianFrench CanadianGermanGhanaianGreekGuamanian / ChamorroGuatemalanHaitianHonduranHungarianIndian (Asian)IndonesianIranianIraqiIrishIroquoisIsraeliItalianJamaicanJapaneseJordanianKoreanLebaneseLiberianLithuanianLumbeeMacedonianMalteseMexicanMexican American IndianMoroccanNative HawaiianNavajoNew ZealanderNicaraguanNigerianNorthern EuropeanNorwegianOttawaPakistaniPalestinianPanamanianPennsylvania GermanPeruvianPolishPortuguesePotawatomiPuerto RicanRomanianRussianSalvadoranSamoanScandinavianScotch-IrishScottishSenegaleseSerbianSlavicSlovakSloveneSouth AfricanSouth AmericanSouth American IndianSpaniardSpanishSri LankanSubsaharan AfricanSudaneseSwedishSwissSyrianThaiTrinidadian and TobagonianTurkishUkrainianVenezuelanVietnameseWelshWest IndianYugoslavian
Immigrant Origin (Total)
Immigrant Origin (Percentage)
Income
Income (Families)
Income (Households)
Poverty
Poverty (Families)
Unemployment
Employment Occupations
Employment Industries
Employer Class
Commute Time
Commute Means
School Enrollment
Education by Degree Field
Occupancy
Finances
Physical Characteristics
Detroit
Compare Zip Codes
Comparison Subject

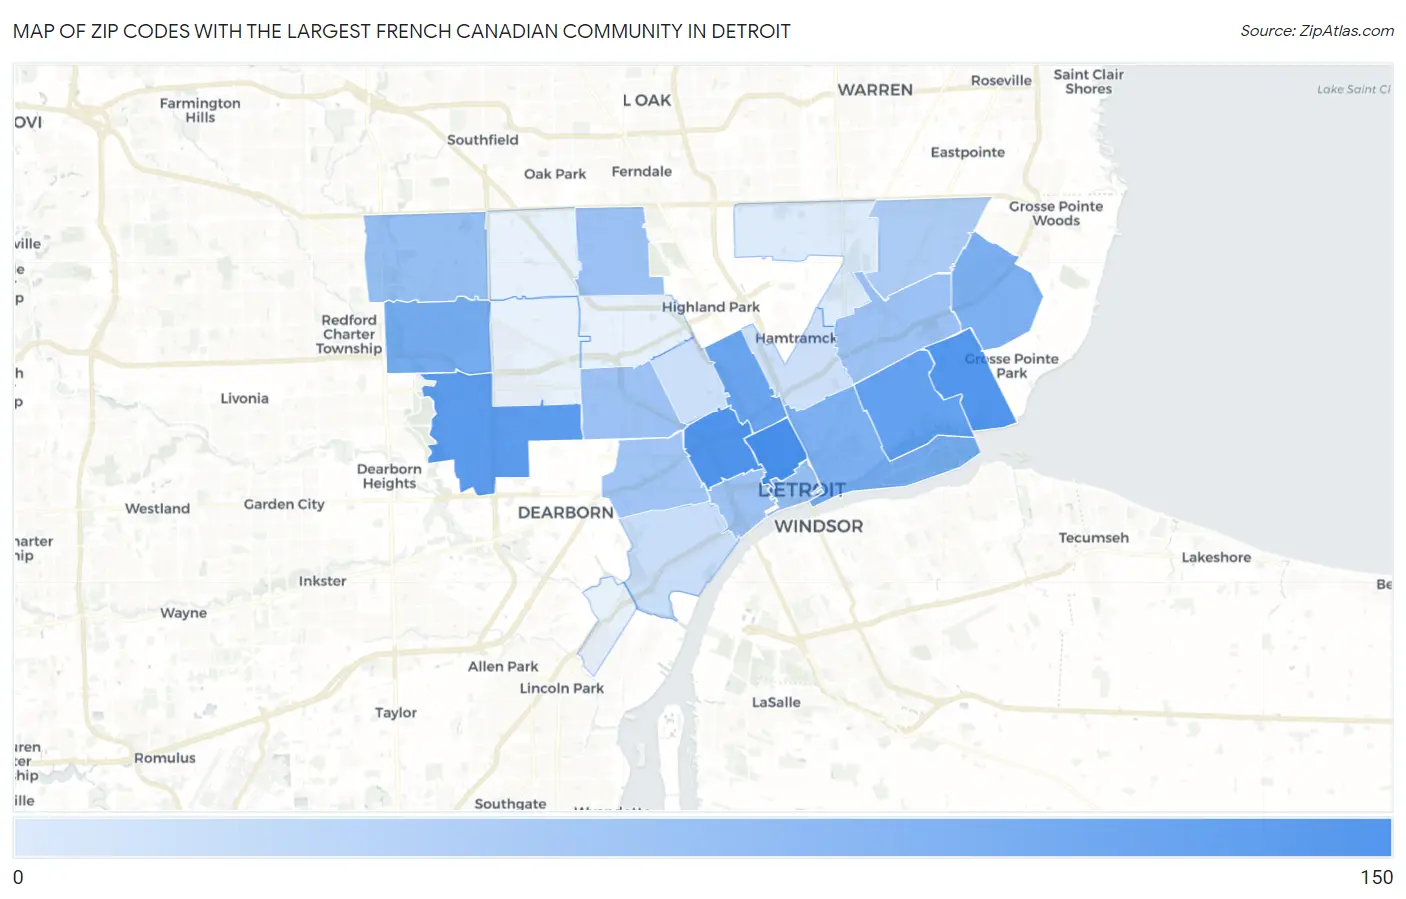
Map of Zip Codes with the Largest French Canadian Community in Detroit

0
150
Zip Codes with the Largest French Canadian Community in Detroit Map

Zip Codes with the Largest French Canadian Community in Detroit, MI

Zip Code French Canadian vs State vs National
1.48201139133,000(0.10%)#2951,802,745(0.01%)#3,423
2.48208113133,000(0.08%)#3351,802,745(0.01%)#4,182
3.48215108133,000(0.08%)#3411,802,745(0.01%)#4,350
4.4822894133,000(0.07%)#3641,802,745(0.01%)#4,874
5.4821476133,000(0.06%)#4231,802,745(0.00%)#5,785
6.4820263133,000(0.05%)#4741,802,745(0.00%)#6,581
7.4822350133,000(0.04%)#5191,802,745(0.00%)#7,431
8.4820743133,000(0.03%)#5521,802,745(0.00%)#8,058
9.4822442133,000(0.03%)#5571,802,745(0.00%)#8,132
10.4821923133,000(0.02%)#6581,802,745(0.00%)#10,572
11.4822623133,000(0.02%)#6591,802,745(0.00%)#10,646
12.4822121133,000(0.02%)#6781,802,745(0.00%)#10,903
13.4821321133,000(0.02%)#6791,802,745(0.00%)#10,936
14.4820420133,000(0.02%)#6881,802,745(0.00%)#11,099
15.4821620133,000(0.02%)#6901,802,745(0.00%)#11,167
16.4821018133,000(0.01%)#7011,802,745(0.00%)#11,467
17.4820514133,000(0.01%)#7281,802,745(0.00%)#12,348
18.482097133,000(0.01%)#7981,802,745(0.00%)#14,544
19.482066133,000(0.00%)#8171,802,745(0.00%)#14,942
20.482116133,000(0.00%)#8181,802,745(0.00%)#15,012
21.482344133,000(0.00%)#8471,802,745(0.00%)#15,720

Common Questions

What are the Top 10 Zip Codes with the Largest French Canadian Community in Detroit, MI?
Top 10 Zip Codes with the Largest French Canadian Community in Detroit, MI are:
#1
139
#2
113
#3
108
#4
94
#5
76
#6
63
#7
50
#8
43
#9
42
#10
23
What zip code has the Largest French Canadian Community in Detroit, MI?
48201 has the Largest French Canadian Community in Detroit, MI with 139.
What is the Total French Canadian Population in Detroit, MI?
Total French Canadian Population in Detroit is 932.
What is the Total French Canadian Population in Michigan?
Total French Canadian Population in Michigan is 133,000.
What is the Total French Canadian Population in the United States?
Total French Canadian Population in the United States is 1,802,745.