Zip Codes with the Highest Percentage of Households With Two or more Vehicles in Detroit, MI
RELATED REPORTS & OPTIONS
Households with 2 or more Cars
Detroit
Compare Zip Codes
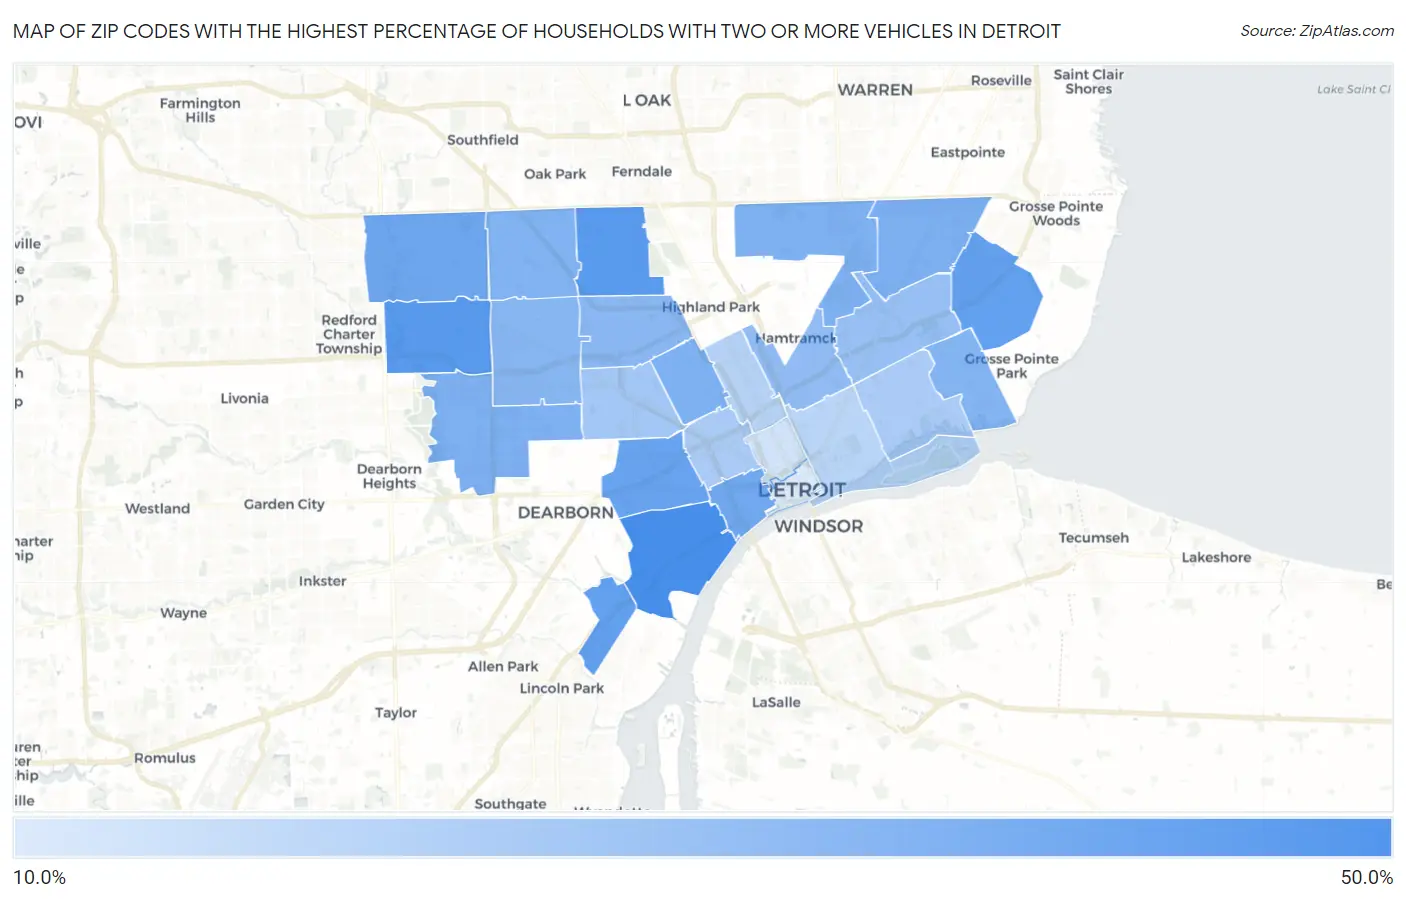
Map of Zip Codes with the Highest Percentage of Households With Two or more Vehicles in Detroit
12.4%
45.0%
Zip Codes with the Highest Percentage of Households With Two or more Vehicles in Detroit, MI
| Zip Code | Housholds With 2+ Cars | vs State | vs National | |
| 1. | 48209 | 45.0% | 58.6%(-13.6)#911 | 59.1%(-14.1)#29,518 |
| 2. | 48221 | 40.9% | 58.6%(-17.7)#923 | 59.1%(-18.2)#30,268 |
| 3. | 48223 | 40.9% | 58.6%(-17.7)#925 | 59.1%(-18.2)#30,274 |
| 4. | 48217 | 38.5% | 58.6%(-20.1)#932 | 59.1%(-20.6)#30,635 |
| 5. | 48224 | 38.1% | 58.6%(-20.5)#933 | 59.1%(-21.0)#30,680 |
| 6. | 48210 | 37.2% | 58.6%(-21.4)#937 | 59.1%(-21.9)#30,800 |
| 7. | 48219 | 35.7% | 58.6%(-22.9)#944 | 59.1%(-23.4)#30,974 |
| 8. | 48216 | 35.2% | 58.6%(-23.4)#945 | 59.1%(-23.9)#31,034 |
| 9. | 48205 | 32.3% | 58.6%(-26.3)#948 | 59.1%(-26.8)#31,295 |
| 10. | 48228 | 32.2% | 58.6%(-26.4)#949 | 59.1%(-26.9)#31,305 |
| 11. | 48206 | 32.0% | 58.6%(-26.6)#950 | 59.1%(-27.1)#31,321 |
| 12. | 48234 | 31.8% | 58.6%(-26.8)#951 | 59.1%(-27.3)#31,338 |
| 13. | 48235 | 31.6% | 58.6%(-27.0)#952 | 59.1%(-27.5)#31,353 |
| 14. | 48215 | 30.8% | 58.6%(-27.8)#953 | 59.1%(-28.3)#31,416 |
| 15. | 48227 | 29.9% | 58.6%(-28.7)#956 | 59.1%(-29.2)#31,475 |
| 16. | 48238 | 29.5% | 58.6%(-29.1)#958 | 59.1%(-29.6)#31,500 |
| 17. | 48211 | 28.0% | 58.6%(-30.6)#960 | 59.1%(-31.1)#31,606 |
| 18. | 48213 | 26.4% | 58.6%(-32.2)#961 | 59.1%(-32.7)#31,699 |
| 19. | 48204 | 24.2% | 58.6%(-34.4)#965 | 59.1%(-34.9)#31,817 |
| 20. | 48208 | 22.7% | 58.6%(-35.9)#966 | 59.1%(-36.4)#31,886 |
| 21. | 48214 | 22.4% | 58.6%(-36.2)#967 | 59.1%(-36.7)#31,898 |
| 22. | 48202 | 20.2% | 58.6%(-38.4)#969 | 59.1%(-38.9)#31,984 |
| 23. | 48207 | 19.3% | 58.6%(-39.3)#970 | 59.1%(-39.8)#32,022 |
| 24. | 48201 | 14.7% | 58.6%(-43.9)#975 | 59.1%(-44.4)#32,174 |
| 25. | 48226 | 12.4% | 58.6%(-46.2)#976 | 59.1%(-46.7)#32,244 |
1
Common Questions
What are the Top 10 Zip Codes with the Highest Percentage of Households With Two or more Vehicles in Detroit, MI?
Top 10 Zip Codes with the Highest Percentage of Households With Two or more Vehicles in Detroit, MI are:
What zip code has the Highest Percentage of Households With Two or more Vehicles in Detroit, MI?
48209 has the Highest Percentage of Households With Two or more Vehicles in Detroit, MI with 45.0%.
What is the Percentage of Households With Two or more Vehicles in Detroit, MI?
Percentage of Households With Two or more Vehicles in Detroit is 31.4%.
What is the Percentage of Households With Two or more Vehicles in Michigan?
Percentage of Households With Two or more Vehicles in Michigan is 58.6%.
What is the Percentage of Households With Two or more Vehicles in the United States?
Percentage of Households With Two or more Vehicles in the United States is 59.1%.