Zip Codes with the Highest Percentage of Population Employed in Community & Social Service in Detroit, MI
RELATED REPORTS & OPTIONS
Community & Social Service
Detroit
Compare Zip Codes
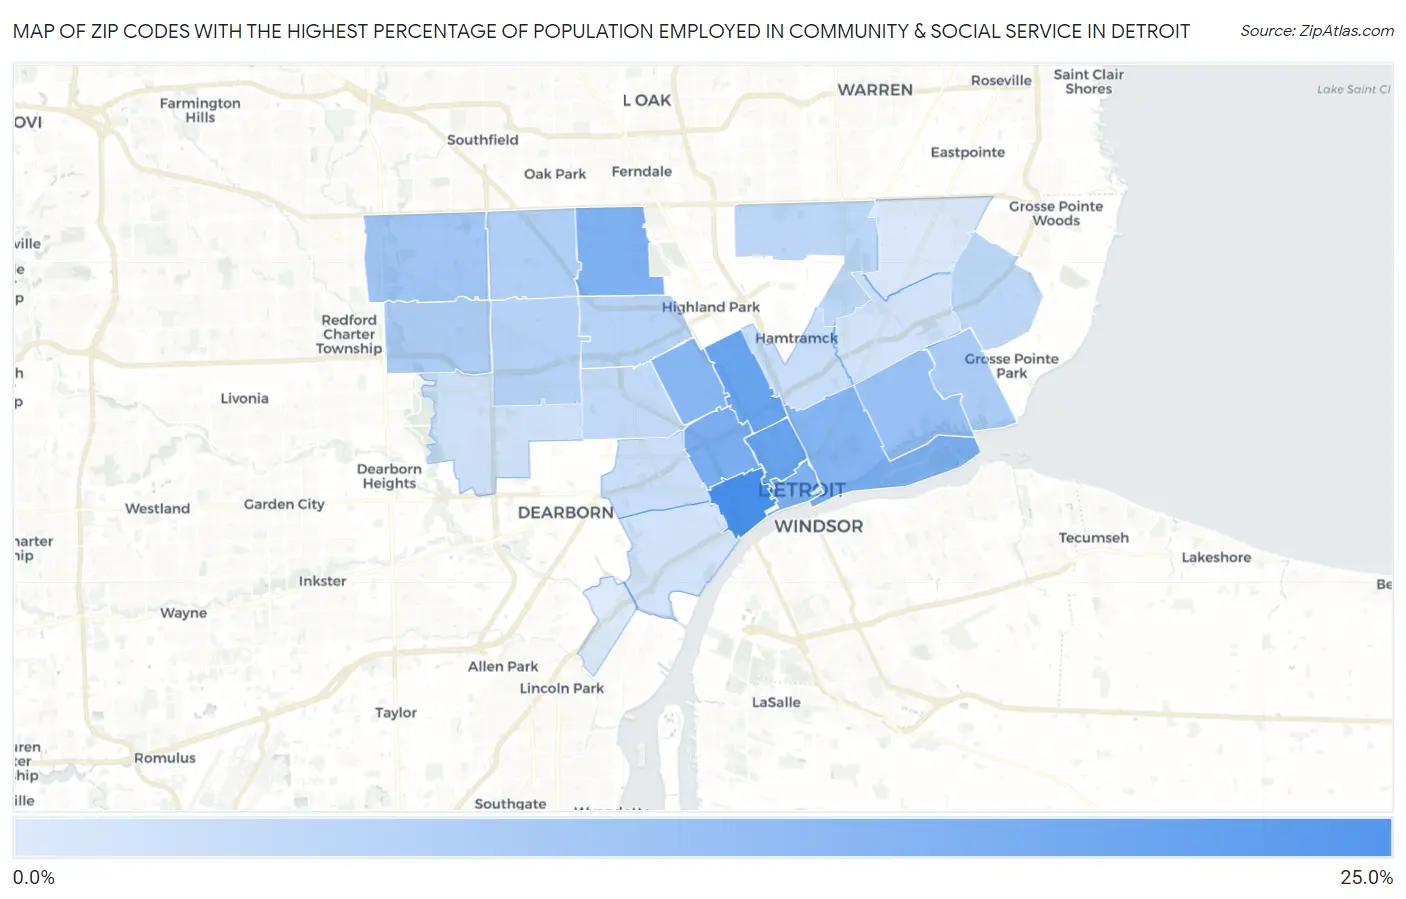
Map of Zip Codes with the Highest Percentage of Population Employed in Community & Social Service in Detroit
3.5%
20.7%
Zip Codes with the Highest Percentage of Population Employed in Community & Social Service in Detroit, MI
| Zip Code | % Employed | vs State | vs National | |
| 1. | 48216 | 20.7% | 9.7%(+11.0)#18 | 11.2%(+9.50)#1,808 |
| 2. | 48201 | 16.8% | 9.7%(+7.14)#41 | 11.2%(+5.60)#3,501 |
| 3. | 48202 | 16.5% | 9.7%(+6.83)#46 | 11.2%(+5.29)#3,692 |
| 4. | 48208 | 14.6% | 9.7%(+4.93)#68 | 11.2%(+3.40)#5,351 |
| 5. | 48226 | 14.1% | 9.7%(+4.45)#79 | 11.2%(+2.91)#5,937 |
| 6. | 48221 | 13.9% | 9.7%(+4.24)#83 | 11.2%(+2.71)#6,193 |
| 7. | 48207 | 13.6% | 9.7%(+3.96)#92 | 11.2%(+2.42)#6,568 |
| 8. | 48206 | 13.0% | 9.7%(+3.33)#108 | 11.2%(+1.79)#7,539 |
| 9. | 48214 | 11.0% | 9.7%(+1.36)#202 | 11.2%(-0.173)#11,531 |
| 10. | 48219 | 10.2% | 9.7%(+0.510)#256 | 11.2%(-1.03)#13,634 |
| 11. | 48215 | 9.2% | 9.7%(-0.526)#343 | 11.2%(-2.06)#16,398 |
| 12. | 48223 | 8.8% | 9.7%(-0.862)#369 | 11.2%(-2.40)#17,305 |
| 13. | 48235 | 8.4% | 9.7%(-1.32)#418 | 11.2%(-2.86)#18,588 |
| 14. | 48227 | 7.8% | 9.7%(-1.86)#484 | 11.2%(-3.40)#20,110 |
| 15. | 48238 | 7.5% | 9.7%(-2.15)#517 | 11.2%(-3.69)#20,814 |
| 16. | 48234 | 7.1% | 9.7%(-2.57)#574 | 11.2%(-4.11)#21,887 |
| 17. | 48224 | 7.0% | 9.7%(-2.67)#585 | 11.2%(-4.20)#22,114 |
| 18. | 48204 | 6.4% | 9.7%(-3.30)#650 | 11.2%(-4.84)#23,547 |
| 19. | 48211 | 5.8% | 9.7%(-3.83)#715 | 11.2%(-5.36)#24,674 |
| 20. | 48210 | 5.6% | 9.7%(-4.05)#743 | 11.2%(-5.59)#25,118 |
| 21. | 48228 | 4.9% | 9.7%(-4.76)#803 | 11.2%(-6.30)#26,325 |
| 22. | 48209 | 4.8% | 9.7%(-4.83)#810 | 11.2%(-6.37)#26,444 |
| 23. | 48213 | 4.7% | 9.7%(-4.93)#814 | 11.2%(-6.47)#26,596 |
| 24. | 48205 | 3.9% | 9.7%(-5.82)#862 | 11.2%(-7.36)#27,730 |
| 25. | 48217 | 3.5% | 9.7%(-6.16)#875 | 11.2%(-7.70)#28,078 |
1
Common Questions
What are the Top 10 Zip Codes with the Highest Percentage of Population Employed in Community & Social Service in Detroit, MI?
Top 10 Zip Codes with the Highest Percentage of Population Employed in Community & Social Service in Detroit, MI are:
What zip code has the Highest Percentage of Population Employed in Community & Social Service in Detroit, MI?
48216 has the Highest Percentage of Population Employed in Community & Social Service in Detroit, MI with 20.7%.
What is the Percentage of Population Employed in Community & Social Service in Detroit, MI?
Percentage of Population Employed in Community & Social Service in Detroit is 8.8%.
What is the Percentage of Population Employed in Community & Social Service in Michigan?
Percentage of Population Employed in Community & Social Service in Michigan is 9.7%.
What is the Percentage of Population Employed in Community & Social Service in the United States?
Percentage of Population Employed in Community & Social Service in the United States is 11.2%.