Zip Codes with the Largest Native / Alaskan Community in Detroit, MI

RELATED REPORTS & OPTIONS

Native / Alaskan
Population
Families and Households
Female Fertility
Female Fertility (Unmarried)
Race (Community Size)
Race (Percentage)
Ancestry (Community Size)
AfricanAlbanianAmericanApacheArabArgentineanArmenianAssyrian / Chaldean / SyriacAustralianAustrianBahamianBangladeshiBarbadianBelgianBelizeanBermudanBhutaneseBlackfeetBrazilianBritishBritish West IndianBurmeseCanadianCentral AmericanCentral American IndianCherokeeChippewaChoctawColombianCosta RicanCreekCroatianCubanCzechCzechoslovakianDanishDominicanDutchEastern EuropeanEcuadorianEgyptianEnglishEthiopianEuropeanFilipinoFinnishFrenchFrench American IndianFrench CanadianGermanGhanaianGreekGuamanian / ChamorroGuatemalanHaitianHonduranHungarianIndian (Asian)IndonesianIranianIraqiIrishIroquoisIsraeliItalianJamaicanJapaneseJordanianKoreanLebaneseLiberianLithuanianLumbeeMacedonianMalteseMexicanMexican American IndianMoroccanNative HawaiianNavajoNew ZealanderNicaraguanNigerianNorthern EuropeanNorwegianOttawaPakistaniPalestinianPanamanianPennsylvania GermanPeruvianPolishPortuguesePotawatomiPuerto RicanRomanianRussianSalvadoranSamoanScandinavianScotch-IrishScottishSenegaleseSerbianSlavicSlovakSloveneSouth AfricanSouth AmericanSouth American IndianSpaniardSpanishSri LankanSubsaharan AfricanSudaneseSwedishSwissSyrianThaiTrinidadian and TobagonianTurkishUkrainianVenezuelanVietnameseWelshWest IndianYugoslavian
Ancestry (Percentage)
AfricanAlbanianAmericanApacheArabArgentineanArmenianAssyrian / Chaldean / SyriacAustralianAustrianBahamianBangladeshiBarbadianBelgianBelizeanBermudanBhutaneseBlackfeetBrazilianBritishBritish West IndianBurmeseCanadianCentral AmericanCentral American IndianCherokeeChippewaChoctawColombianCosta RicanCreekCroatianCubanCzechCzechoslovakianDanishDominicanDutchEastern EuropeanEcuadorianEgyptianEnglishEthiopianEuropeanFilipinoFinnishFrenchFrench American IndianFrench CanadianGermanGhanaianGreekGuamanian / ChamorroGuatemalanHaitianHonduranHungarianIndian (Asian)IndonesianIranianIraqiIrishIroquoisIsraeliItalianJamaicanJapaneseJordanianKoreanLebaneseLiberianLithuanianLumbeeMacedonianMalteseMexicanMexican American IndianMoroccanNative HawaiianNavajoNew ZealanderNicaraguanNigerianNorthern EuropeanNorwegianOttawaPakistaniPalestinianPanamanianPennsylvania GermanPeruvianPolishPortuguesePotawatomiPuerto RicanRomanianRussianSalvadoranSamoanScandinavianScotch-IrishScottishSenegaleseSerbianSlavicSlovakSloveneSouth AfricanSouth AmericanSouth American IndianSpaniardSpanishSri LankanSubsaharan AfricanSudaneseSwedishSwissSyrianThaiTrinidadian and TobagonianTurkishUkrainianVenezuelanVietnameseWelshWest IndianYugoslavian
Immigrant Origin (Total)
Immigrant Origin (Percentage)
Income
Income (Families)
Income (Households)
Poverty
Poverty (Families)
Unemployment
Employment Occupations
Employment Industries
Employer Class
Commute Time
Commute Means
School Enrollment
Education by Degree Field
Occupancy
Finances
Physical Characteristics
Detroit
Compare Zip Codes
Comparison Subject

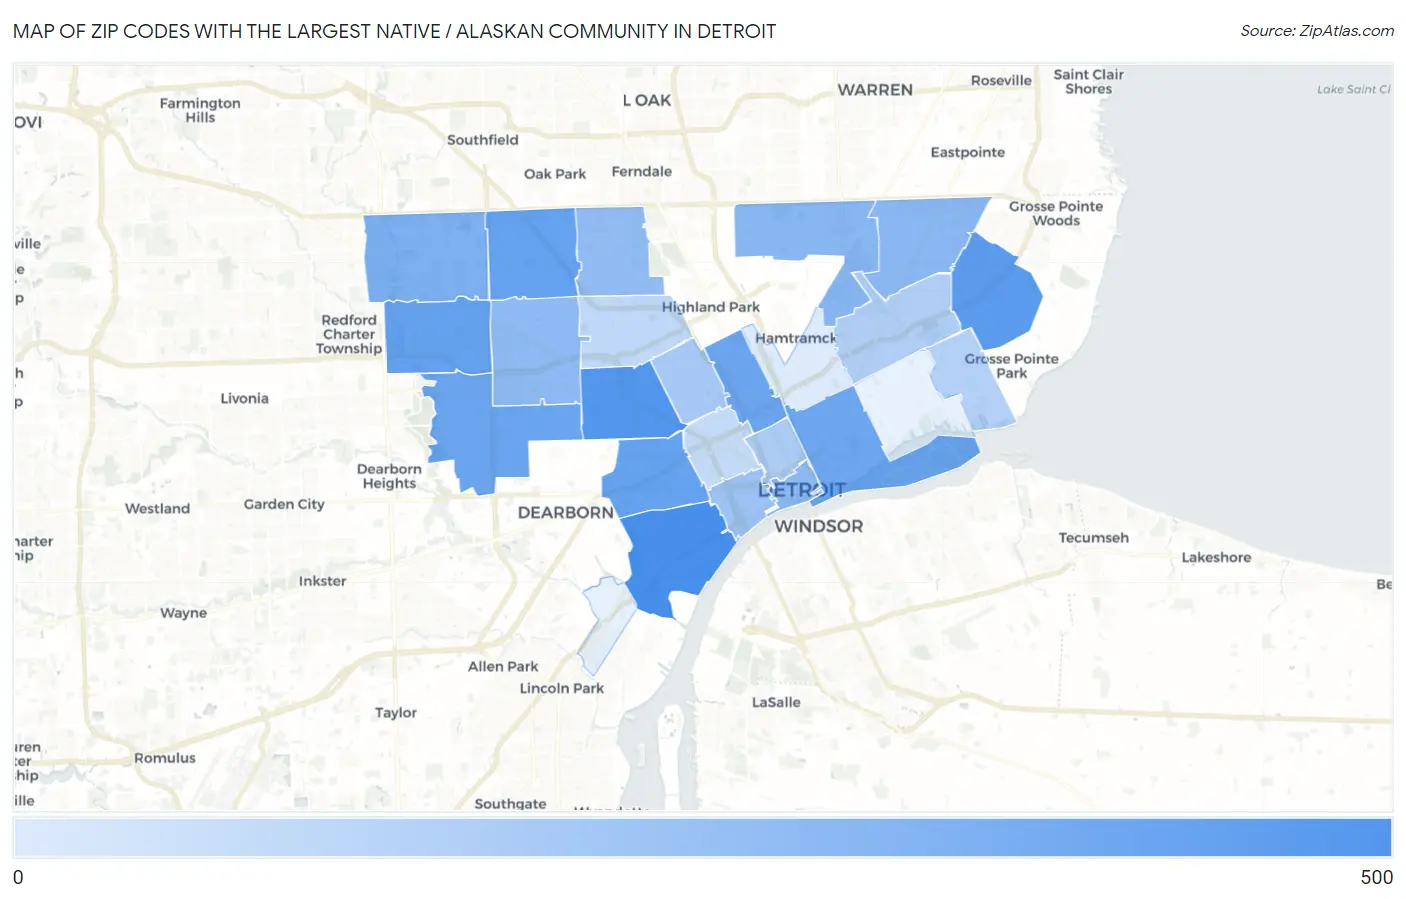
Map of Zip Codes with the Largest Native / Alaskan Community in Detroit

0
500
Zip Codes with the Largest Native / Alaskan Community in Detroit Map

Zip Codes with the Largest Native / Alaskan Community in Detroit, MI

Zip Code Native / Alaskan vs State vs National
1.4820940245,662(0.88%)#122,786,431(0.01%)#1,585
2.4820427445,662(0.60%)#292,786,431(0.01%)#2,349
3.4822422345,662(0.49%)#382,786,431(0.01%)#2,831
4.4823515345,662(0.34%)#722,786,431(0.01%)#3,812
5.4821015145,662(0.33%)#752,786,431(0.01%)#3,844
6.4822314845,662(0.32%)#782,786,431(0.01%)#3,901
7.4822812245,662(0.27%)#902,786,431(0.00%)#4,524
8.4820212045,662(0.26%)#912,786,431(0.00%)#4,601
9.4820711145,662(0.24%)#982,786,431(0.00%)#4,843
10.482197145,662(0.16%)#1572,786,431(0.00%)#6,312
11.482344745,662(0.10%)#2362,786,431(0.00%)#7,862
12.482054445,662(0.10%)#2462,786,431(0.00%)#8,102
13.482273945,662(0.09%)#2692,786,431(0.00%)#8,531
14.482263945,662(0.09%)#2752,786,431(0.00%)#8,592
15.482213645,662(0.08%)#2902,786,431(0.00%)#8,801
16.482162345,662(0.05%)#3752,786,431(0.00%)#10,482
17.482061845,662(0.04%)#4162,786,431(0.00%)#11,283
18.482011445,662(0.03%)#4572,786,431(0.00%)#12,187
19.482131345,662(0.03%)#4722,786,431(0.00%)#12,404
20.482151145,662(0.02%)#5042,786,431(0.00%)#12,998
21.48238745,662(0.02%)#5572,786,431(0.00%)#14,272
22.48208645,662(0.01%)#5892,786,431(0.00%)#14,772
23.48211245,662(0.00%)#6772,786,431(0.00%)#16,782

Common Questions

What are the Top 10 Zip Codes with the Largest Native / Alaskan Community in Detroit, MI?
Top 10 Zip Codes with the Largest Native / Alaskan Community in Detroit, MI are:
#1
402
#2
274
#3
223
#4
153
#5
151
#6
148
#7
122
#8
120
#9
111
#10
71
What zip code has the Largest Native / Alaskan Community in Detroit, MI?
48209 has the Largest Native / Alaskan Community in Detroit, MI with 402.
What is the Total Native / Alaskan Population in Detroit, MI?
Total Native / Alaskan Population in Detroit is 2,274.
What is the Total Native / Alaskan Population in Michigan?
Total Native / Alaskan Population in Michigan is 45,662.
What is the Total Native / Alaskan Population in the United States?
Total Native / Alaskan Population in the United States is 2,786,431.