Quimby, IA Map & Demographics
Quimby Map
Quimby Overview
$28,364
PER CAPITA INCOME
$66,250
AVG FAMILY INCOME
$57,500
AVG HOUSEHOLD INCOME
49.1%
WAGE / INCOME GAP [ % ]
50.9¢/ $1
WAGE / INCOME GAP [ $ ]
0.34
INEQUALITY / GINI INDEX
329
TOTAL POPULATION
167
MALE POPULATION
162
FEMALE POPULATION
103.09
MALES / 100 FEMALES
97.01
FEMALES / 100 MALES
50.4
MEDIAN AGE
2.6
AVG FAMILY SIZE
1.9
AVG HOUSEHOLD SIZE
190
LABOR FORCE [ PEOPLE ]
64.8%
PERCENT IN LABOR FORCE
6.8%
UNEMPLOYMENT RATE
Quimby Zip Codes
Quimby Area Codes
Income in Quimby
Income Overview in Quimby
Per Capita Income in Quimby is $28,364, while median incomes of families and households are $66,250 and $57,500 respectively.
| Characteristic | Number | Measure |
| Per Capita Income | 329 | $28,364 |
| Median Family Income | 90 | $66,250 |
| Mean Family Income | 90 | $72,701 |
| Median Household Income | 170 | $57,500 |
| Mean Household Income | 170 | $61,121 |
| Income Deficit | 90 | $0 |
| Wage / Income Gap (%) | 329 | 49.13% |
| Wage / Income Gap ($) | 329 | 50.87¢ per $1 |
| Gini / Inequality Index | 329 | 0.34 |
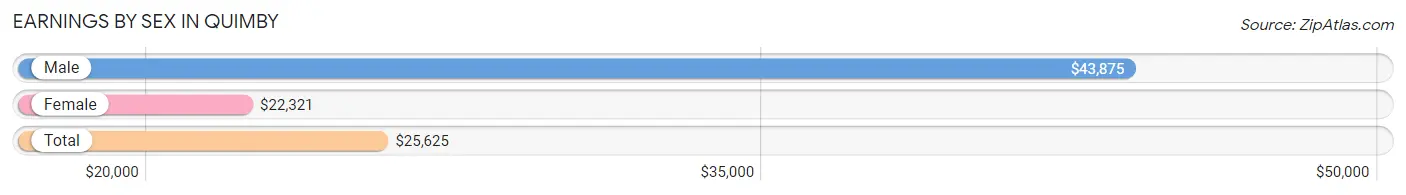
Earnings by Sex in Quimby
Average Earnings in Quimby are $25,625, $43,875 for men and $22,321 for women, a difference of 49.1%.
| Sex | Number | Average Earnings |
| Male | 97 (47.1%) | $43,875 |
| Female | 109 (52.9%) | $22,321 |
| Total | 206 (100.0%) | $25,625 |
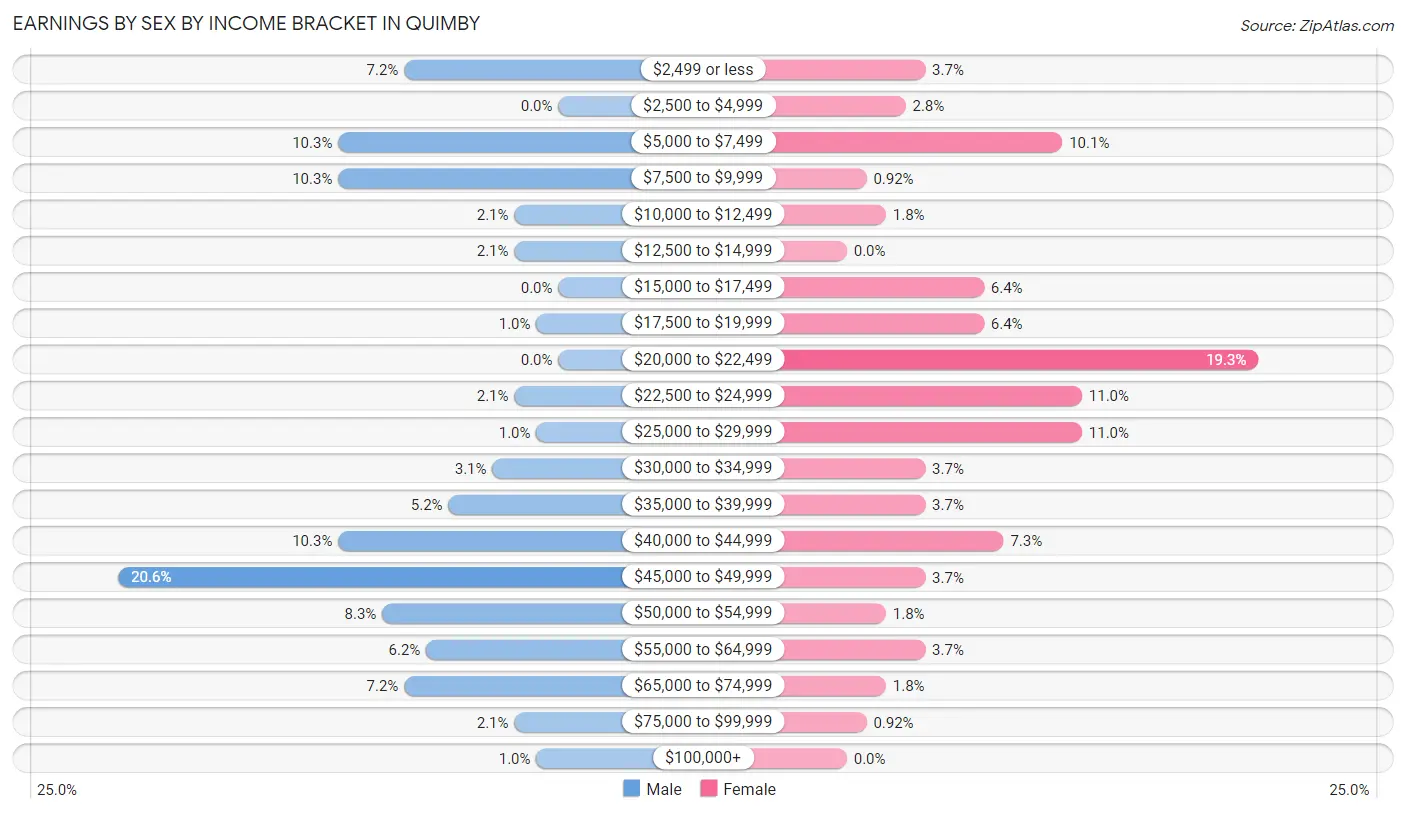
Earnings by Sex by Income Bracket in Quimby
The most common earnings brackets in Quimby are $45,000 to $49,999 for men (20 | 20.6%) and $20,000 to $22,499 for women (21 | 19.3%).
| Income | Male | Female |
| $2,499 or less | 7 (7.2%) | 4 (3.7%) |
| $2,500 to $4,999 | 0 (0.0%) | 3 (2.8%) |
| $5,000 to $7,499 | 10 (10.3%) | 11 (10.1%) |
| $7,500 to $9,999 | 10 (10.3%) | 1 (0.9%) |
| $10,000 to $12,499 | 2 (2.1%) | 2 (1.8%) |
| $12,500 to $14,999 | 2 (2.1%) | 0 (0.0%) |
| $15,000 to $17,499 | 0 (0.0%) | 7 (6.4%) |
| $17,500 to $19,999 | 1 (1.0%) | 7 (6.4%) |
| $20,000 to $22,499 | 0 (0.0%) | 21 (19.3%) |
| $22,500 to $24,999 | 2 (2.1%) | 12 (11.0%) |
| $25,000 to $29,999 | 1 (1.0%) | 12 (11.0%) |
| $30,000 to $34,999 | 3 (3.1%) | 4 (3.7%) |
| $35,000 to $39,999 | 5 (5.1%) | 4 (3.7%) |
| $40,000 to $44,999 | 10 (10.3%) | 8 (7.3%) |
| $45,000 to $49,999 | 20 (20.6%) | 4 (3.7%) |
| $50,000 to $54,999 | 8 (8.3%) | 2 (1.8%) |
| $55,000 to $64,999 | 6 (6.2%) | 4 (3.7%) |
| $65,000 to $74,999 | 7 (7.2%) | 2 (1.8%) |
| $75,000 to $99,999 | 2 (2.1%) | 1 (0.9%) |
| $100,000+ | 1 (1.0%) | 0 (0.0%) |
| Total | 97 (100.0%) | 109 (100.0%) |
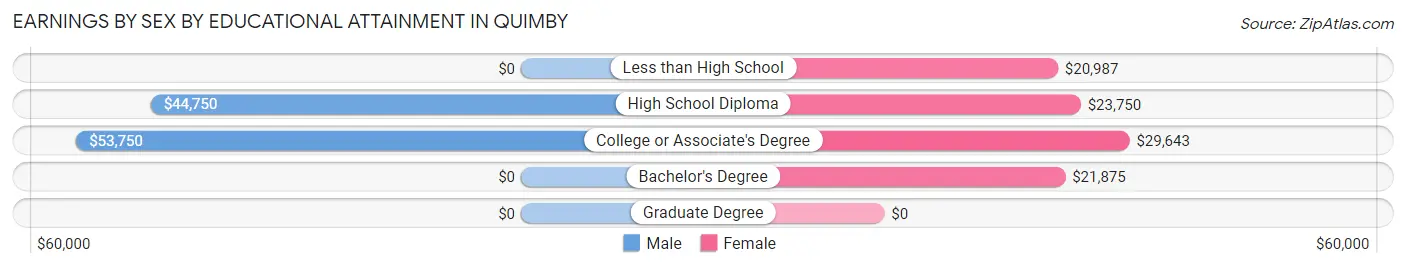
Earnings by Sex by Educational Attainment in Quimby
Average earnings in Quimby are $45,391 for men and $22,969 for women, a difference of 49.4%. Men with an educational attainment of college or associate's degree enjoy the highest average annual earnings of $53,750, while those with high school diploma education earn the least with $44,750. Women with an educational attainment of college or associate's degree earn the most with the average annual earnings of $29,643, while those with less than high school education have the smallest earnings of $20,987.
| Educational Attainment | Male Income | Female Income |
| Less than High School | - | - |
| High School Diploma | $44,750 | $23,750 |
| College or Associate's Degree | $53,750 | $29,643 |
| Bachelor's Degree | - | - |
| Graduate Degree | - | - |
| Total | $45,391 | $22,969 |
Family Income in Quimby
Family Income Brackets in Quimby
According to the Quimby family income data, there are 28 families falling into the $100,000 to $149,999 income range, which is the most common income bracket and makes up 31.1% of all families.
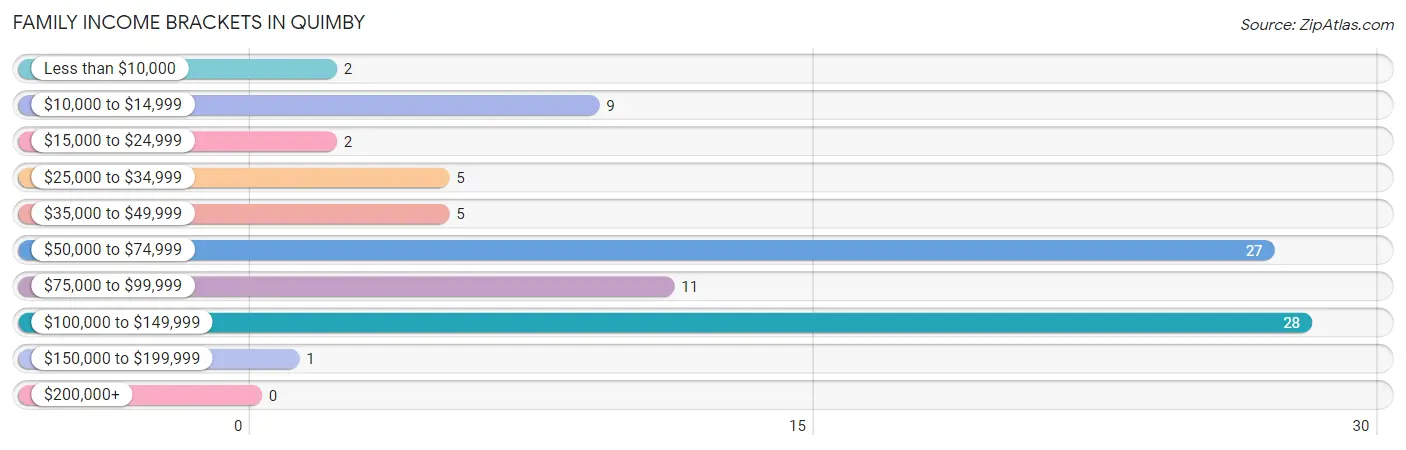
| Income Bracket | # Families | % Families |
| Less than $10,000 | 2 | 2.2% |
| $10,000 to $14,999 | 9 | 10.0% |
| $15,000 to $24,999 | 2 | 2.2% |
| $25,000 to $34,999 | 5 | 5.6% |
| $35,000 to $49,999 | 5 | 5.6% |
| $50,000 to $74,999 | 27 | 30.0% |
| $75,000 to $99,999 | 11 | 12.2% |
| $100,000 to $149,999 | 28 | 31.1% |
| $150,000 to $199,999 | 1 | 1.1% |
| $200,000+ | 0 | 0.0% |
Family Income by Famaliy Size in Quimby
3-person families (14 | 15.6%) account for the highest median family income in Quimby with $90,000 per family, while 3-person families (14 | 15.6%) have the highest median income of $30,000 per family member.
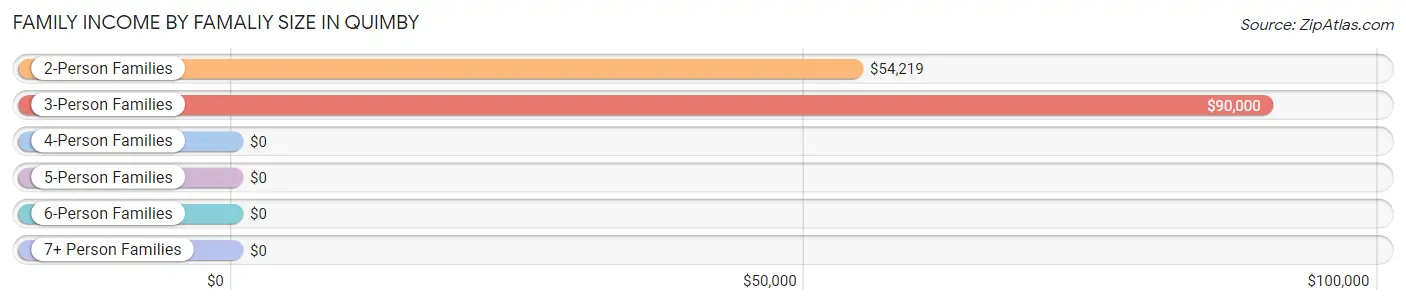
| Income Bracket | # Families | Median Income |
| 2-Person Families | 51 (56.7%) | $54,219 |
| 3-Person Families | 14 (15.6%) | $90,000 |
| 4-Person Families | 3 (3.3%) | $0 |
| 5-Person Families | 20 (22.2%) | $0 |
| 6-Person Families | 2 (2.2%) | $0 |
| 7+ Person Families | 0 (0.0%) | $0 |
| Total | 90 (100.0%) | $66,250 |
Family Income by Number of Earners in Quimby
The median family income in Quimby is $66,250, with families comprising 3+ earners (28) having the highest median family income of $118,158, while families with no earners (16) have the lowest median family income of $45,000, accounting for 31.1% and 17.8% of families, respectively.
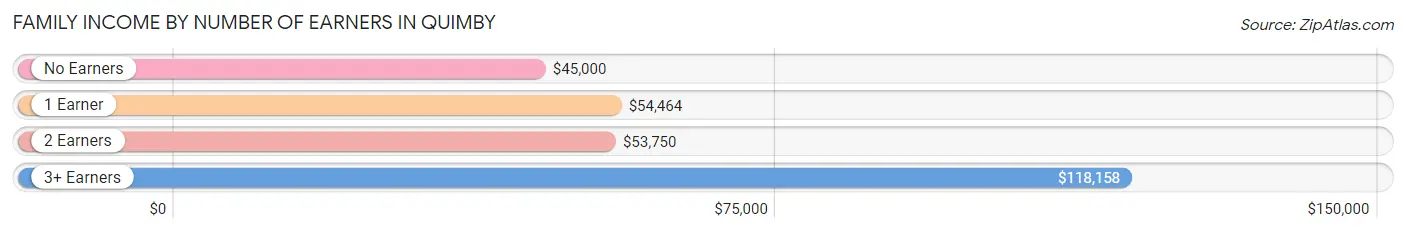
| Number of Earners | # Families | Median Income |
| No Earners | 16 (17.8%) | $45,000 |
| 1 Earner | 21 (23.3%) | $54,464 |
| 2 Earners | 25 (27.8%) | $53,750 |
| 3+ Earners | 28 (31.1%) | $118,158 |
| Total | 90 (100.0%) | $66,250 |
Household Income in Quimby
Household Income Brackets in Quimby
With 35 households falling in the category, the $75,000 to $99,999 income range is the most frequent in Quimby, accounting for 20.6% of all households.
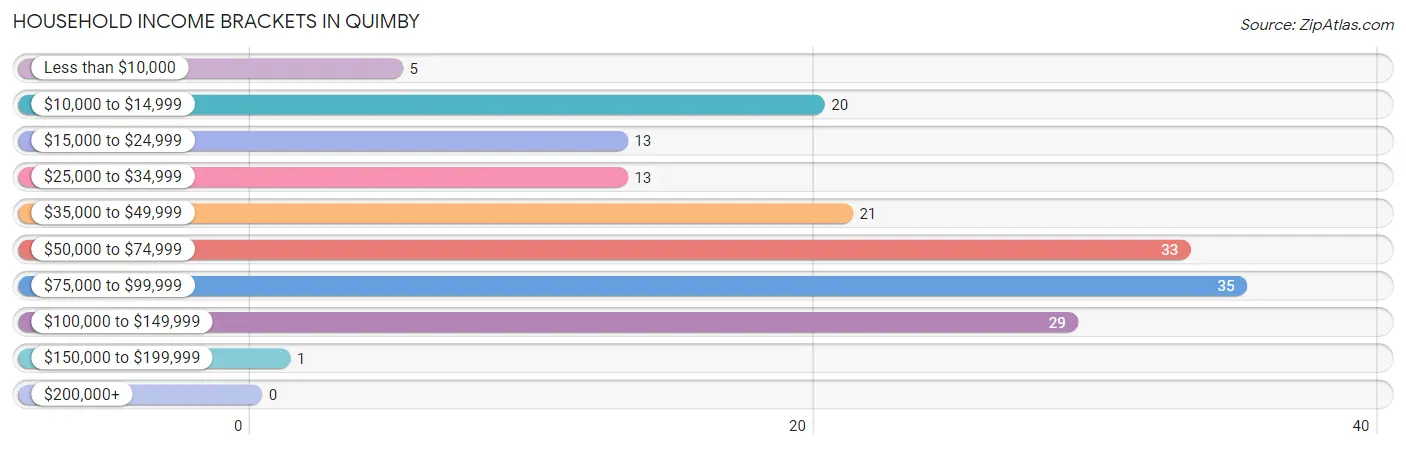
| Income Bracket | # Households | % Households |
| Less than $10,000 | 5 | 2.9% |
| $10,000 to $14,999 | 20 | 11.8% |
| $15,000 to $24,999 | 13 | 7.6% |
| $25,000 to $34,999 | 13 | 7.6% |
| $35,000 to $49,999 | 21 | 12.4% |
| $50,000 to $74,999 | 33 | 19.4% |
| $75,000 to $99,999 | 35 | 20.6% |
| $100,000 to $149,999 | 29 | 17.1% |
| $150,000 to $199,999 | 1 | 0.6% |
| $200,000+ | 0 | 0.0% |
Household Income by Householder Age in Quimby
The median household income in Quimby is $57,500, with the highest median household income of $90,893 found in the 25 to 44 years age bracket for the primary householder. A total of 53 households (31.2%) fall into this category. Meanwhile, the 15 to 24 years age bracket for the primary householder has the lowest median household income of $0, with 2 households (1.2%) in this group.
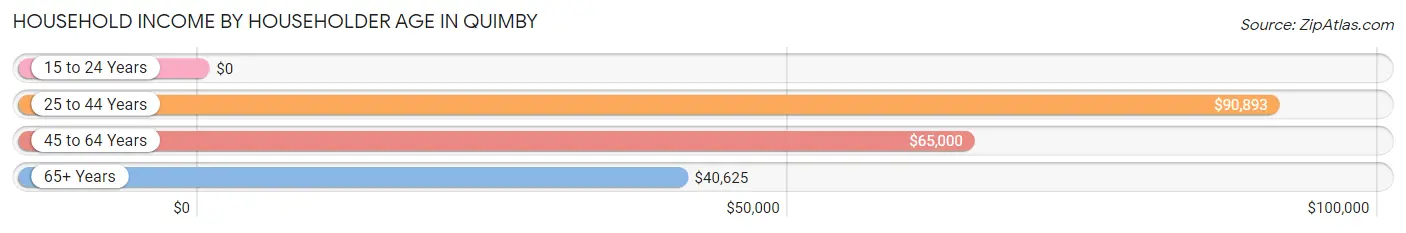
| Income Bracket | # Households | Median Income |
| 15 to 24 Years | 2 (1.2%) | $0 |
| 25 to 44 Years | 53 (31.2%) | $90,893 |
| 45 to 64 Years | 34 (20.0%) | $65,000 |
| 65+ Years | 81 (47.6%) | $40,625 |
| Total | 170 (100.0%) | $57,500 |
Poverty in Quimby
Income Below Poverty by Sex and Age in Quimby
With 12.6% poverty level for males and 9.3% for females among the residents of Quimby, 65 to 74 year old males and 25 to 34 year old females are the most vulnerable to poverty, with 16 males (35.6%) and 3 females (50.0%) in their respective age groups living below the poverty level.
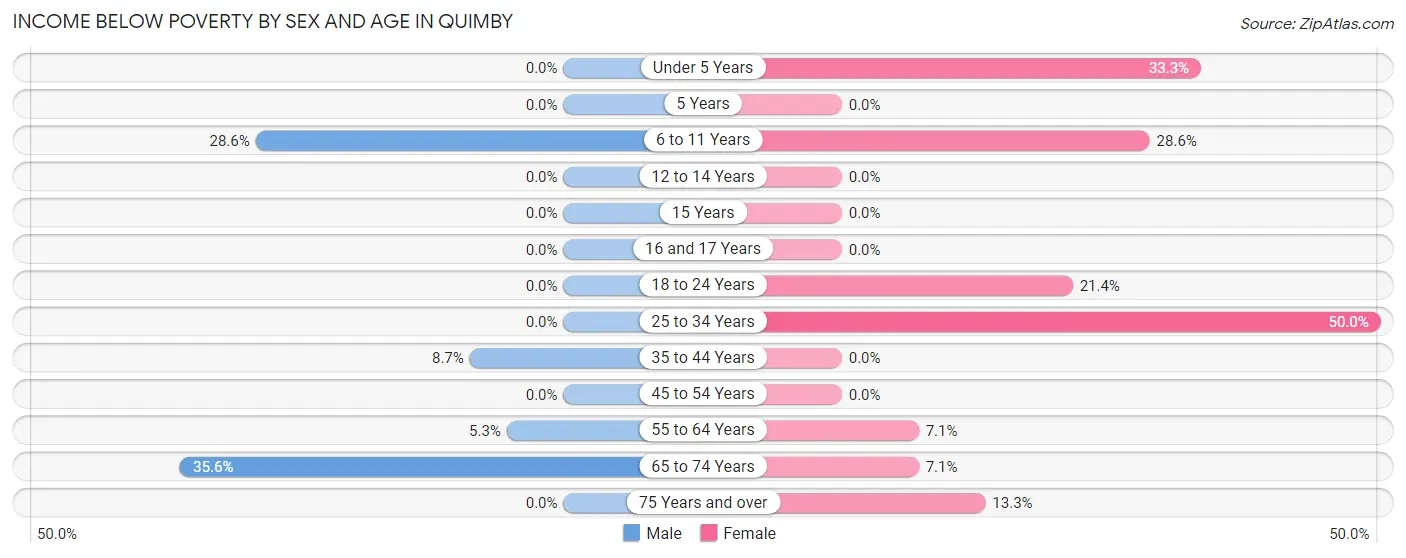
| Age Bracket | Male | Female |
| Under 5 Years | 0 (0.0%) | 1 (33.3%) |
| 5 Years | 0 (0.0%) | 0 (0.0%) |
| 6 to 11 Years | 2 (28.6%) | 2 (28.6%) |
| 12 to 14 Years | 0 (0.0%) | 0 (0.0%) |
| 15 Years | 0 (0.0%) | 0 (0.0%) |
| 16 and 17 Years | 0 (0.0%) | 0 (0.0%) |
| 18 to 24 Years | 0 (0.0%) | 3 (21.4%) |
| 25 to 34 Years | 0 (0.0%) | 3 (50.0%) |
| 35 to 44 Years | 2 (8.7%) | 0 (0.0%) |
| 45 to 54 Years | 0 (0.0%) | 0 (0.0%) |
| 55 to 64 Years | 1 (5.3%) | 2 (7.1%) |
| 65 to 74 Years | 16 (35.6%) | 2 (7.1%) |
| 75 Years and over | 0 (0.0%) | 2 (13.3%) |
| Total | 21 (12.6%) | 15 (9.3%) |
Income Above Poverty by Sex and Age in Quimby
According to the poverty statistics in Quimby, males aged under 5 years and females aged 15 years are the age groups that are most secure financially, with 100.0% of males and 100.0% of females in these age groups living above the poverty line.
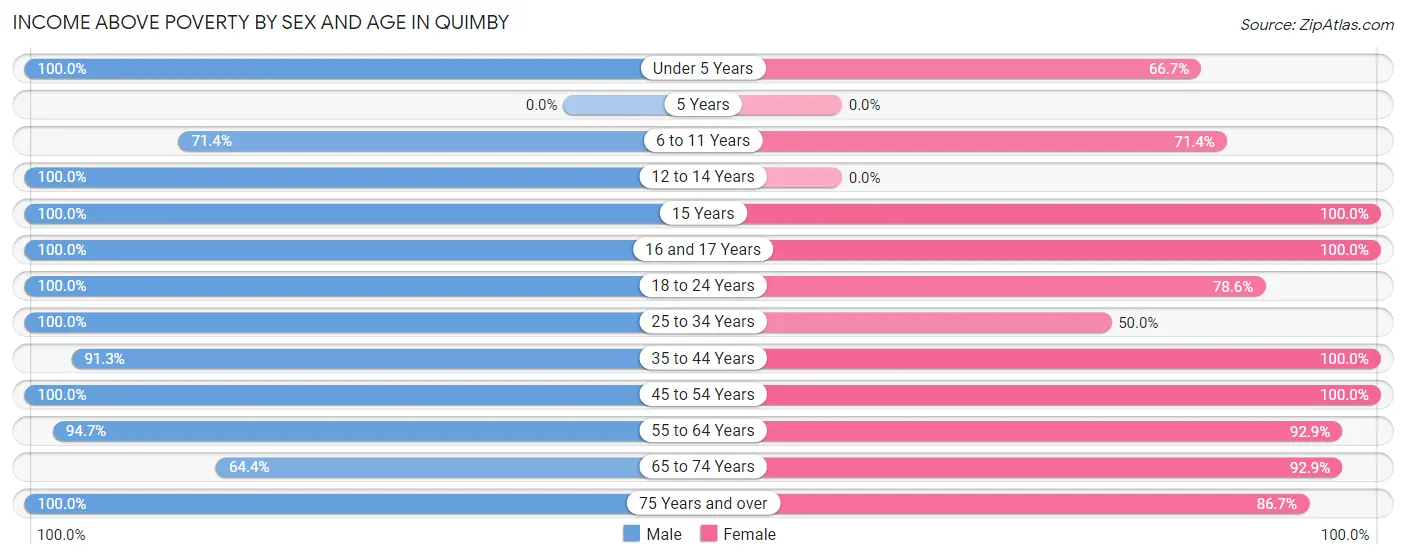
| Age Bracket | Male | Female |
| Under 5 Years | 11 (100.0%) | 2 (66.7%) |
| 5 Years | 0 (0.0%) | 0 (0.0%) |
| 6 to 11 Years | 5 (71.4%) | 5 (71.4%) |
| 12 to 14 Years | 4 (100.0%) | 0 (0.0%) |
| 15 Years | 2 (100.0%) | 2 (100.0%) |
| 16 and 17 Years | 1 (100.0%) | 12 (100.0%) |
| 18 to 24 Years | 14 (100.0%) | 11 (78.6%) |
| 25 to 34 Years | 19 (100.0%) | 3 (50.0%) |
| 35 to 44 Years | 21 (91.3%) | 30 (100.0%) |
| 45 to 54 Years | 11 (100.0%) | 17 (100.0%) |
| 55 to 64 Years | 18 (94.7%) | 26 (92.9%) |
| 65 to 74 Years | 29 (64.4%) | 26 (92.9%) |
| 75 Years and over | 11 (100.0%) | 13 (86.7%) |
| Total | 146 (87.4%) | 147 (90.7%) |
Income Below Poverty Among Married-Couple Families in Quimby
The poverty statistics for married-couple families in Quimby show that 12.7% or 9 of the total 71 families live below the poverty line. Families with no children have the highest poverty rate of 20.4%, comprising of 9 families. On the other hand, families with 1 or 2 children have the lowest poverty rate of 0.0%, which includes 0 families.
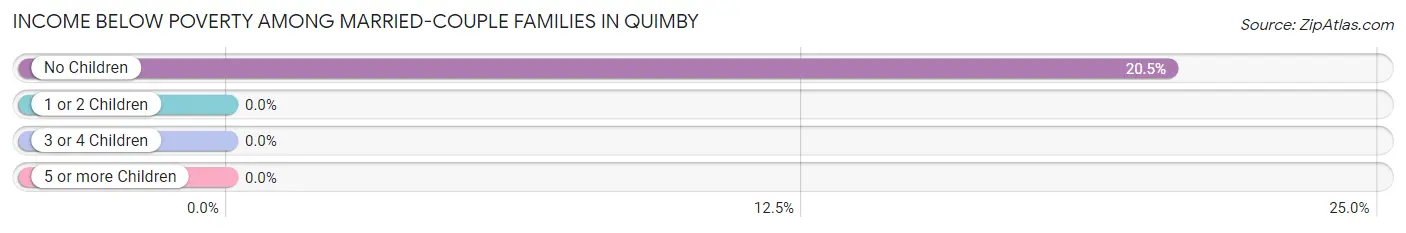
| Children | Above Poverty | Below Poverty |
| No Children | 35 (79.5%) | 9 (20.4%) |
| 1 or 2 Children | 25 (100.0%) | 0 (0.0%) |
| 3 or 4 Children | 2 (100.0%) | 0 (0.0%) |
| 5 or more Children | 0 (0.0%) | 0 (0.0%) |
| Total | 62 (87.3%) | 9 (12.7%) |
Income Below Poverty Among Single-Parent Households in Quimby
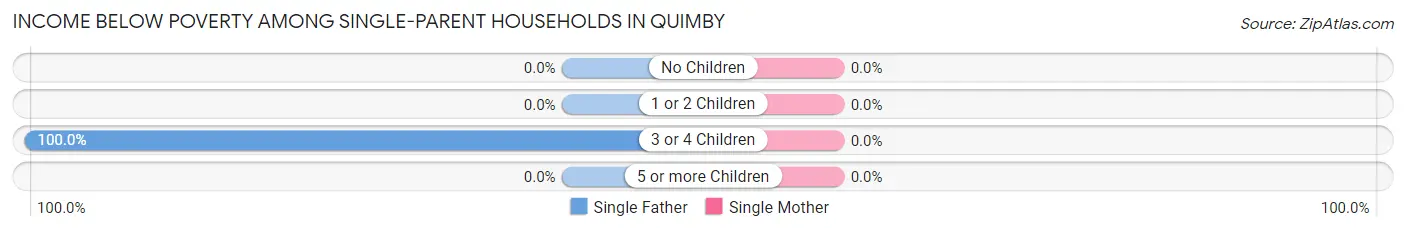
| Children | Single Father | Single Mother |
| No Children | 0 (0.0%) | 0 (0.0%) |
| 1 or 2 Children | 0 (0.0%) | 0 (0.0%) |
| 3 or 4 Children | 2 (100.0%) | 0 (0.0%) |
| 5 or more Children | 0 (0.0%) | 0 (0.0%) |
| Total | 2 (16.7%) | 0 (0.0%) |
Income Below Poverty Among Married-Couple vs Single-Parent Households in Quimby
The poverty data for Quimby shows that 9 of the married-couple family households (12.7%) and 2 of the single-parent households (10.5%) are living below the poverty level. Within the married-couple family households, those with no children have the highest poverty rate, with 9 households (20.4%) falling below the poverty line. Among the single-parent households, those with 3 or 4 children have the highest poverty rate, with 2 household (100.0%) living below poverty.
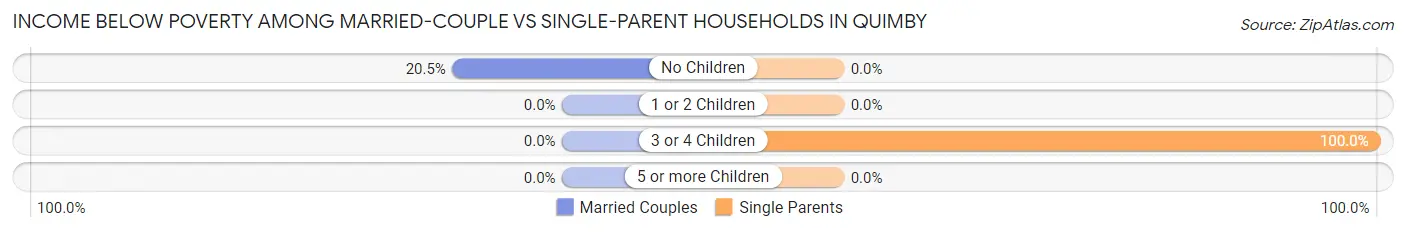
| Children | Married-Couple Families | Single-Parent Households |
| No Children | 9 (20.4%) | 0 (0.0%) |
| 1 or 2 Children | 0 (0.0%) | 0 (0.0%) |
| 3 or 4 Children | 0 (0.0%) | 2 (100.0%) |
| 5 or more Children | 0 (0.0%) | 0 (0.0%) |
| Total | 9 (12.7%) | 2 (10.5%) |
Race in Quimby
The most populous races in Quimby are White / Caucasian (329 | 100.0%), and Hispanic or Latino (58 | 17.6%).
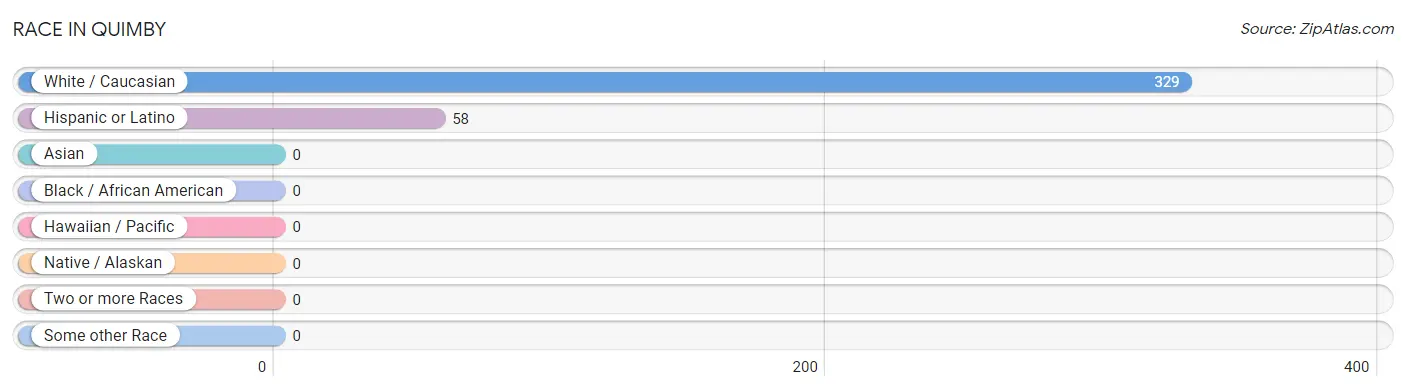
| Race | # Population | % Population |
| Asian | 0 | 0.0% |
| Black / African American | 0 | 0.0% |
| Hawaiian / Pacific | 0 | 0.0% |
| Hispanic or Latino | 58 | 17.6% |
| Native / Alaskan | 0 | 0.0% |
| White / Caucasian | 329 | 100.0% |
| Two or more Races | 0 | 0.0% |
| Some other Race | 0 | 0.0% |
| Total | 329 | 100.0% |
Ancestry in Quimby
The most populous ancestries reported in Quimby are German (113 | 34.4%), Irish (63 | 19.2%), Mexican (58 | 17.6%), English (45 | 13.7%), and Swedish (15 | 4.6%), together accounting for 89.4% of all Quimby residents.
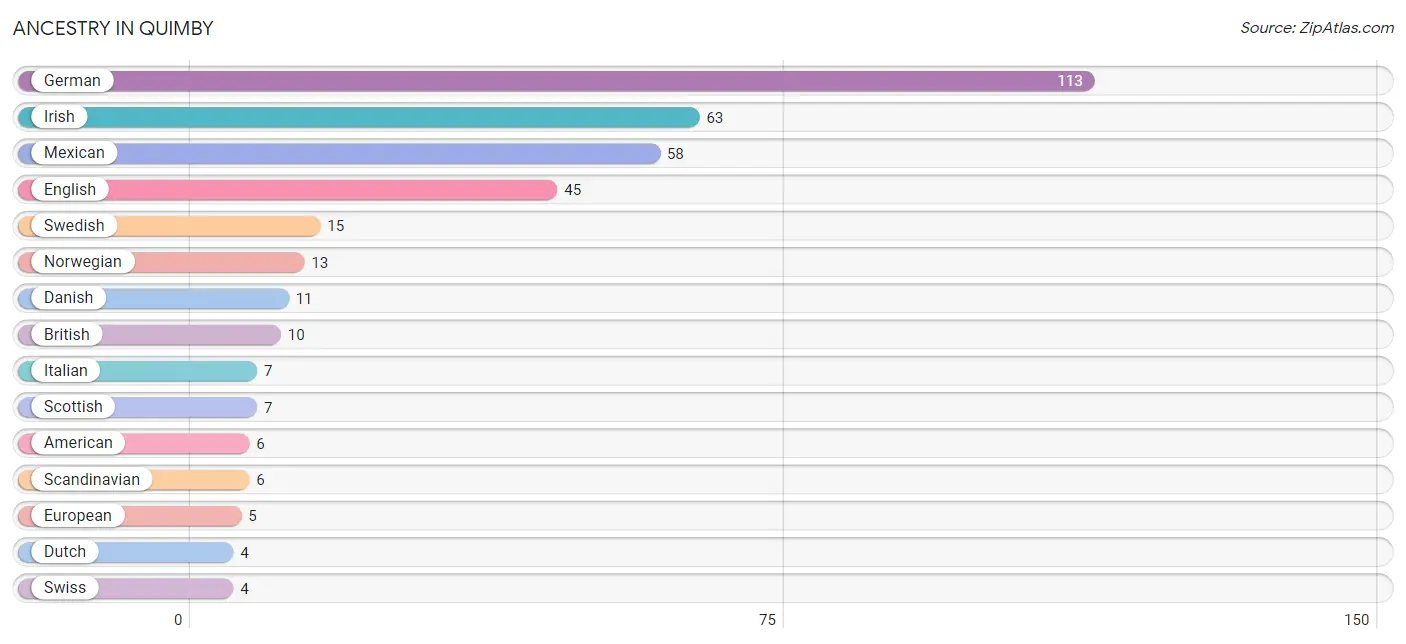
| Ancestry | # Population | % Population |
| American | 6 | 1.8% |
| British | 10 | 3.0% |
| Czech | 2 | 0.6% |
| Danish | 11 | 3.3% |
| Dutch | 4 | 1.2% |
| English | 45 | 13.7% |
| European | 5 | 1.5% |
| French | 1 | 0.3% |
| German | 113 | 34.4% |
| Irish | 63 | 19.2% |
| Italian | 7 | 2.1% |
| Mexican | 58 | 17.6% |
| Norwegian | 13 | 4.0% |
| Scandinavian | 6 | 1.8% |
| Scotch-Irish | 3 | 0.9% |
| Scottish | 7 | 2.1% |
| Swedish | 15 | 4.6% |
| Swiss | 4 | 1.2% | View All 18 Rows |
Immigrants in Quimby
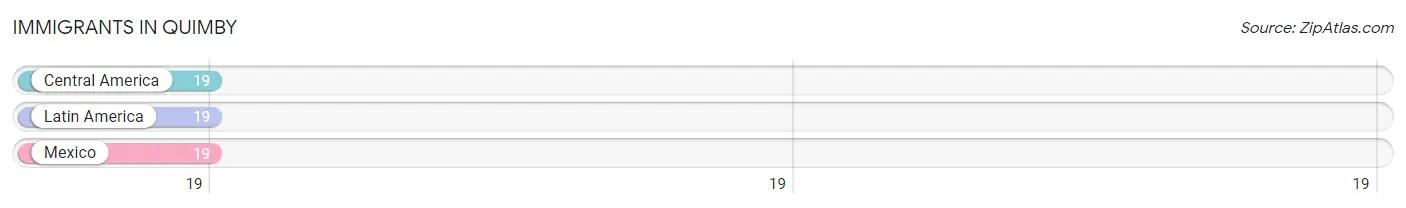
The most numerous immigrant groups reported in Quimby came from Central America (19 | 5.8%), Latin America (19 | 5.8%), and Mexico (19 | 5.8%), together accounting for 17.3% of all Quimby residents.
| Immigration Origin | # Population | % Population |
| Central America | 19 | 5.8% |
| Latin America | 19 | 5.8% |
| Mexico | 19 | 5.8% | View All 3 Rows |
Sex and Age in Quimby
Sex and Age in Quimby
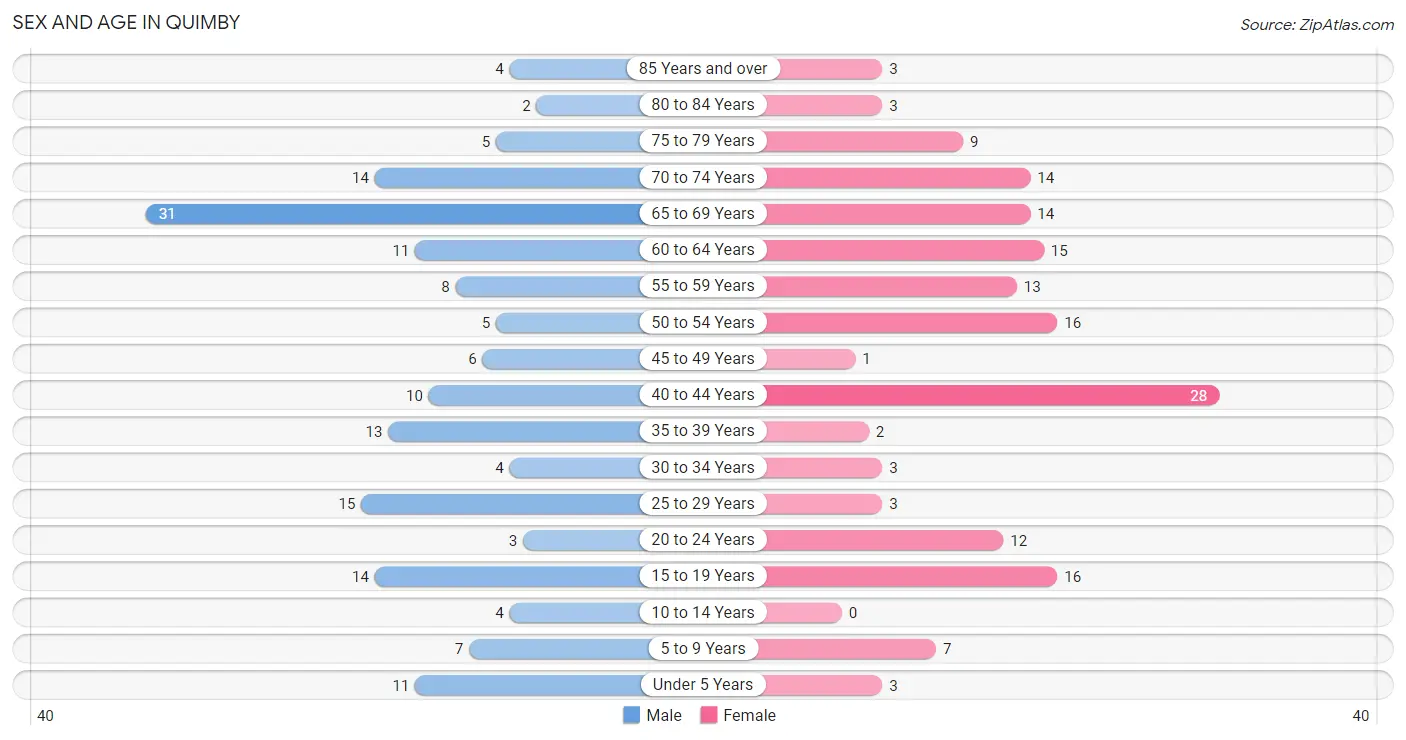
The most populous age groups in Quimby are 65 to 69 Years (31 | 18.6%) for men and 40 to 44 Years (28 | 17.3%) for women.
| Age Bracket | Male | Female |
| Under 5 Years | 11 (6.6%) | 3 (1.8%) |
| 5 to 9 Years | 7 (4.2%) | 7 (4.3%) |
| 10 to 14 Years | 4 (2.4%) | 0 (0.0%) |
| 15 to 19 Years | 14 (8.4%) | 16 (9.9%) |
| 20 to 24 Years | 3 (1.8%) | 12 (7.4%) |
| 25 to 29 Years | 15 (9.0%) | 3 (1.8%) |
| 30 to 34 Years | 4 (2.4%) | 3 (1.8%) |
| 35 to 39 Years | 13 (7.8%) | 2 (1.2%) |
| 40 to 44 Years | 10 (6.0%) | 28 (17.3%) |
| 45 to 49 Years | 6 (3.6%) | 1 (0.6%) |
| 50 to 54 Years | 5 (3.0%) | 16 (9.9%) |
| 55 to 59 Years | 8 (4.8%) | 13 (8.0%) |
| 60 to 64 Years | 11 (6.6%) | 15 (9.3%) |
| 65 to 69 Years | 31 (18.6%) | 14 (8.6%) |
| 70 to 74 Years | 14 (8.4%) | 14 (8.6%) |
| 75 to 79 Years | 5 (3.0%) | 9 (5.6%) |
| 80 to 84 Years | 2 (1.2%) | 3 (1.8%) |
| 85 Years and over | 4 (2.4%) | 3 (1.8%) |
| Total | 167 (100.0%) | 162 (100.0%) |
Families and Households in Quimby
Median Family Size in Quimby
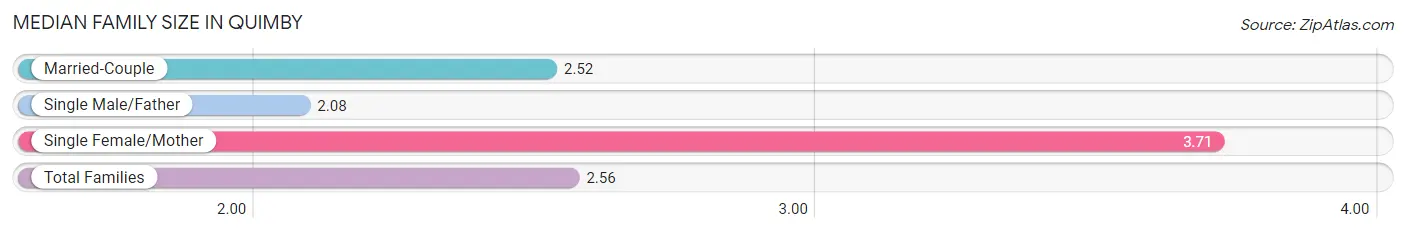
The median family size in Quimby is 2.56 persons per family, with single female/mother families (7 | 7.8%) accounting for the largest median family size of 3.71 persons per family. On the other hand, single male/father families (12 | 13.3%) represent the smallest median family size with 2.08 persons per family.
| Family Type | # Families | Family Size |
| Married-Couple | 71 (78.9%) | 2.52 |
| Single Male/Father | 12 (13.3%) | 2.08 |
| Single Female/Mother | 7 (7.8%) | 3.71 |
| Total Families | 90 (100.0%) | 2.56 |
Median Household Size in Quimby
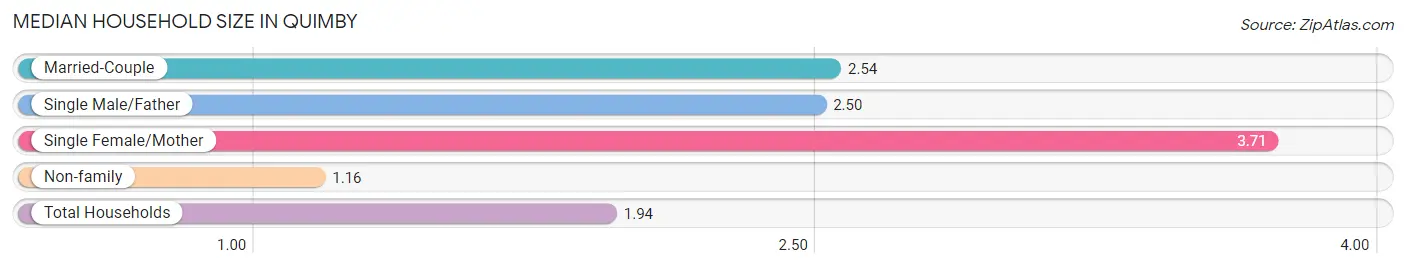
The median household size in Quimby is 1.94 persons per household, with single female/mother households (7 | 4.1%) accounting for the largest median household size of 3.71 persons per household. non-family households (80 | 47.1%) represent the smallest median household size with 1.16 persons per household.
| Household Type | # Households | Household Size |
| Married-Couple | 71 (41.8%) | 2.54 |
| Single Male/Father | 12 (7.1%) | 2.50 |
| Single Female/Mother | 7 (4.1%) | 3.71 |
| Non-family | 80 (47.1%) | 1.16 |
| Total Households | 170 (100.0%) | 1.94 |
Household Size by Marriage Status in Quimby
Out of a total of 170 households in Quimby, 90 (52.9%) are family households, while 80 (47.1%) are nonfamily households. The most numerous type of family households are 2-person households, comprising 49, and the most common type of nonfamily households are 1-person households, comprising 64.
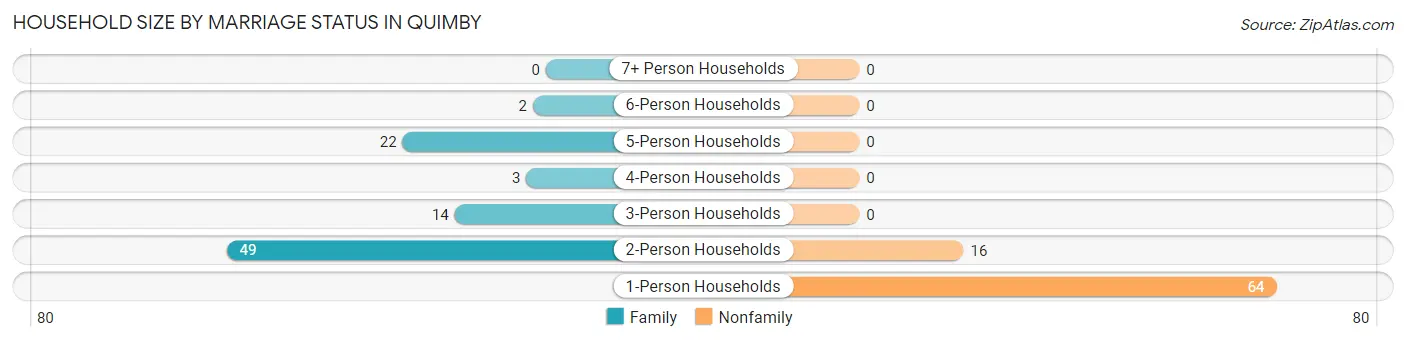
| Household Size | Family Households | Nonfamily Households |
| 1-Person Households | - | 64 (37.7%) |
| 2-Person Households | 49 (28.8%) | 16 (9.4%) |
| 3-Person Households | 14 (8.2%) | 0 (0.0%) |
| 4-Person Households | 3 (1.8%) | 0 (0.0%) |
| 5-Person Households | 22 (12.9%) | 0 (0.0%) |
| 6-Person Households | 2 (1.2%) | 0 (0.0%) |
| 7+ Person Households | 0 (0.0%) | 0 (0.0%) |
| Total | 90 (52.9%) | 80 (47.1%) |
Female Fertility in Quimby
Fertility by Age in Quimby
Average fertility rate in Quimby is 14.0 births per 1,000 women. Women in the age bracket of 15 to 19 years have the highest fertility rate with 63.0 births per 1,000 women. Women in the age bracket of 15 to 19 years acount for 100.0% of all women with births.
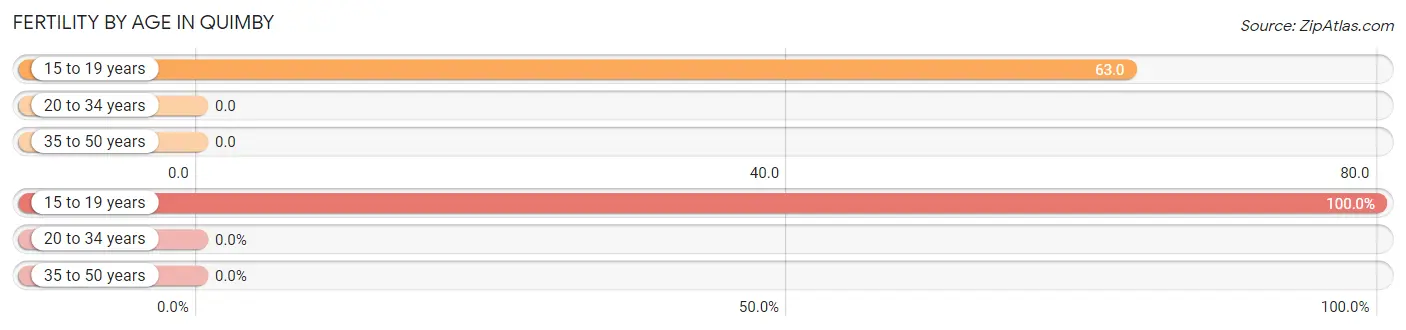
| Age Bracket | Women with Births | Births / 1,000 Women |
| 15 to 19 years | 1 (100.0%) | 63.0 |
| 20 to 34 years | 0 (0.0%) | 0.0 |
| 35 to 50 years | 0 (0.0%) | 0.0 |
| Total | 1 (100.0%) | 14.0 |
Fertility by Age by Marriage Status in Quimby
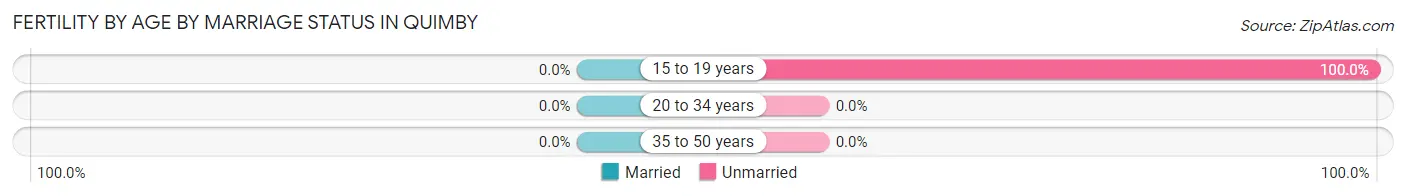
| Age Bracket | Married | Unmarried |
| 15 to 19 years | 0 (0.0%) | 1 (100.0%) |
| 20 to 34 years | 0 (0.0%) | 0 (0.0%) |
| 35 to 50 years | 0 (0.0%) | 0 (0.0%) |
| Total | 0 (0.0%) | 1 (100.0%) |
Fertility by Education in Quimby
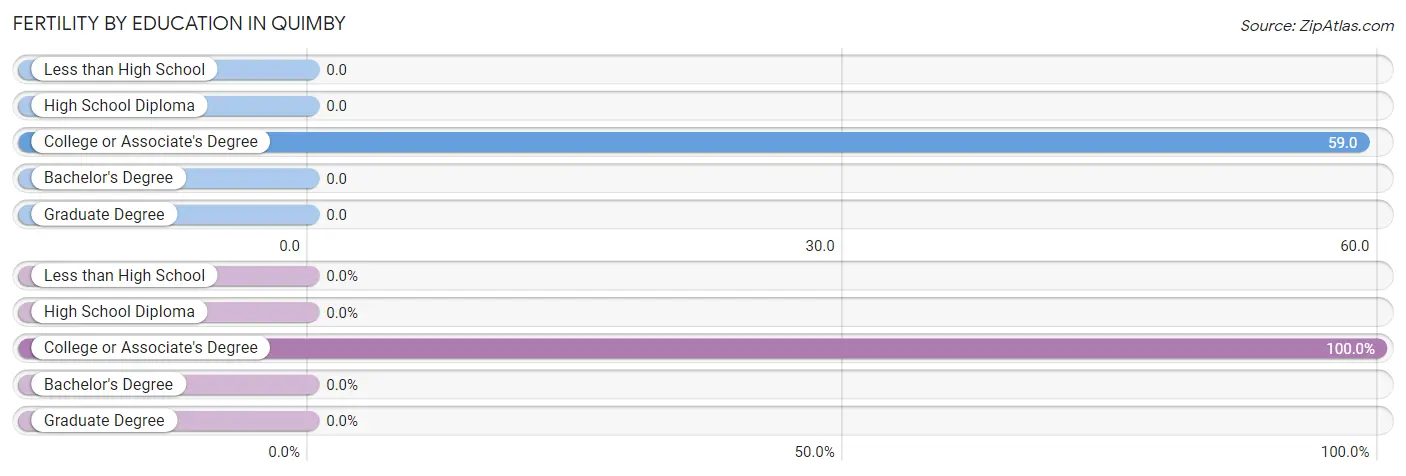
| Educational Attainment | Women with Births | Births / 1,000 Women |
| Less than High School | 0 (0.0%) | 0.0 |
| High School Diploma | 0 (0.0%) | 0.0 |
| College or Associate's Degree | 1 (100.0%) | 59.0 |
| Bachelor's Degree | 0 (0.0%) | 0.0 |
| Graduate Degree | 0 (0.0%) | 0.0 |
| Total | 1 (100.0%) | 14.0 |
Fertility by Education by Marriage Status in Quimby
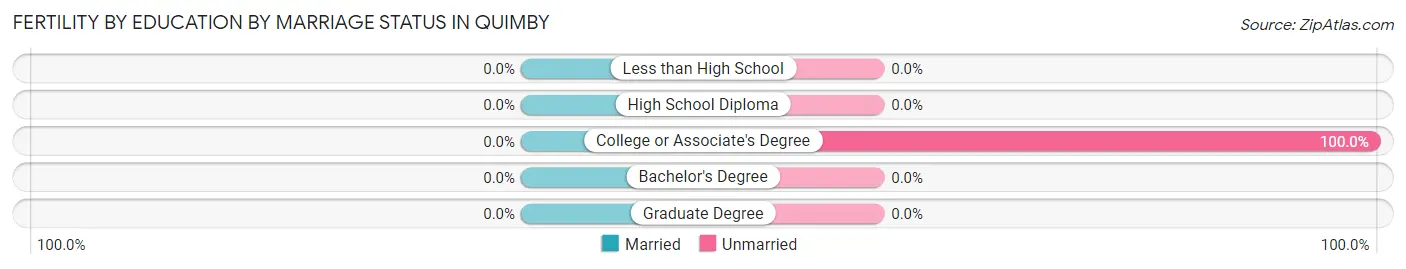
| Educational Attainment | Married | Unmarried |
| Less than High School | 0 (0.0%) | 0 (0.0%) |
| High School Diploma | 0 (0.0%) | 0 (0.0%) |
| College or Associate's Degree | 0 (0.0%) | 1 (100.0%) |
| Bachelor's Degree | 0 (0.0%) | 0 (0.0%) |
| Graduate Degree | 0 (0.0%) | 0 (0.0%) |
| Total | 0 (0.0%) | 1 (100.0%) |
Employment Characteristics in Quimby
Employment by Class of Employer in Quimby
Among the 176 employed individuals in Quimby, private company employees (98 | 55.7%), self-employed (not incorporated) (32 | 18.2%), and local government employees (24 | 13.6%) make up the most common classes of employment.
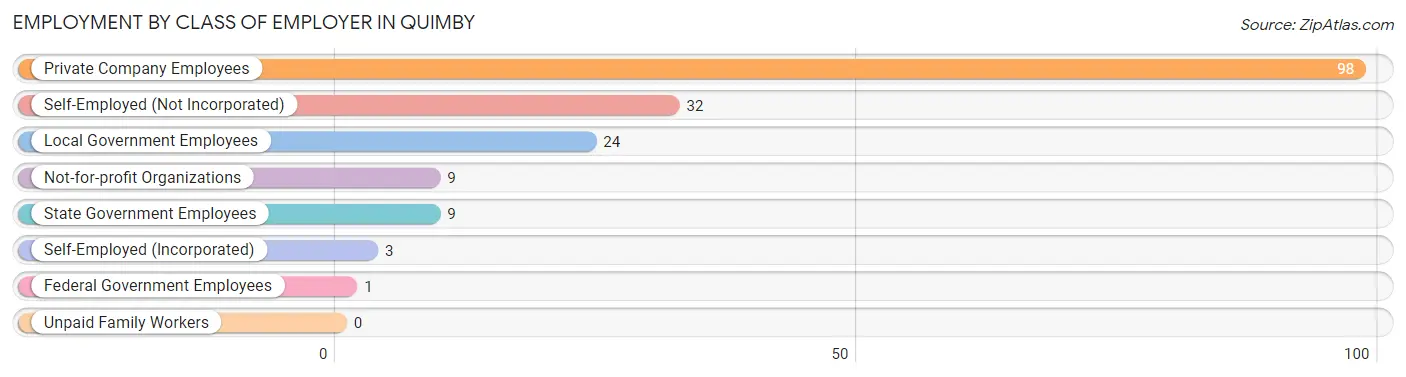
| Employer Class | # Employees | % Employees |
| Private Company Employees | 98 | 55.7% |
| Self-Employed (Incorporated) | 3 | 1.7% |
| Self-Employed (Not Incorporated) | 32 | 18.2% |
| Not-for-profit Organizations | 9 | 5.1% |
| Local Government Employees | 24 | 13.6% |
| State Government Employees | 9 | 5.1% |
| Federal Government Employees | 1 | 0.6% |
| Unpaid Family Workers | 0 | 0.0% |
| Total | 176 | 100.0% |
Employment Status by Age in Quimby
According to the labor force statistics for Quimby, out of the total population over 16 years of age (293), 64.8% or 190 individuals are in the labor force, with 6.8% or 13 of them unemployed. The age group with the highest labor force participation rate is 25 to 29 years, with 100.0% or 18 individuals in the labor force. Within the labor force, the 16 to 19 years age range has the highest percentage of unemployed individuals, with 83.3% or 10 of them being unemployed.
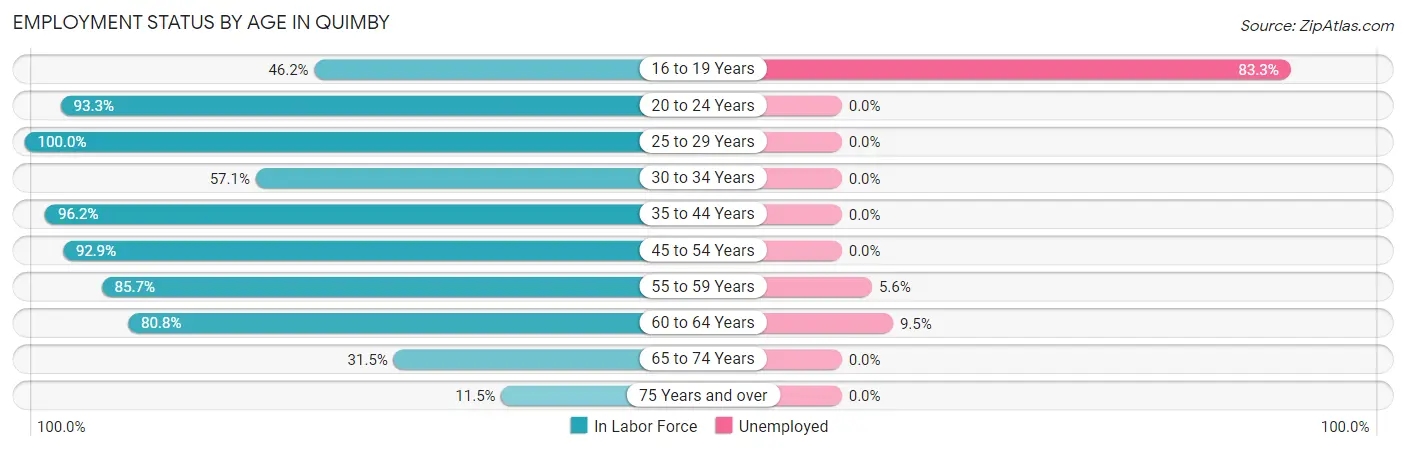
| Age Bracket | In Labor Force | Unemployed |
| 16 to 19 Years | 12 (46.2%) | 10 (83.3%) |
| 20 to 24 Years | 14 (93.3%) | 0 (0.0%) |
| 25 to 29 Years | 18 (100.0%) | 0 (0.0%) |
| 30 to 34 Years | 4 (57.1%) | 0 (0.0%) |
| 35 to 44 Years | 51 (96.2%) | 0 (0.0%) |
| 45 to 54 Years | 26 (92.9%) | 0 (0.0%) |
| 55 to 59 Years | 18 (85.7%) | 1 (5.6%) |
| 60 to 64 Years | 21 (80.8%) | 2 (9.5%) |
| 65 to 74 Years | 23 (31.5%) | 0 (0.0%) |
| 75 Years and over | 3 (11.5%) | 0 (0.0%) |
| Total | 190 (64.8%) | 13 (6.8%) |
Employment Status by Educational Attainment in Quimby
According to labor force statistics for Quimby, 90.2% of individuals (138) out of the total population between 25 and 64 years of age (153) are in the labor force, with 2.2% or 3 of them being unemployed. The group with the highest labor force participation rate are those with the educational attainment of less than high school, with 100.0% or 26 individuals in the labor force. Within the labor force, individuals with high school diploma education have the highest percentage of unemployment, with 5.2% or 3 of them being unemployed.
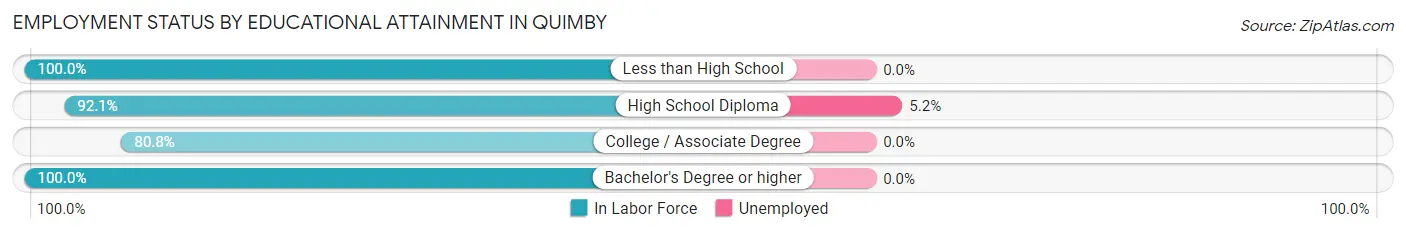
| Educational Attainment | In Labor Force | Unemployed |
| Less than High School | 26 (100.0%) | 0 (0.0%) |
| High School Diploma | 58 (92.1%) | 3 (5.2%) |
| College / Associate Degree | 42 (80.8%) | 0 (0.0%) |
| Bachelor's Degree or higher | 12 (100.0%) | 0 (0.0%) |
| Total | 138 (90.2%) | 3 (2.2%) |
Employment Occupations by Sex in Quimby
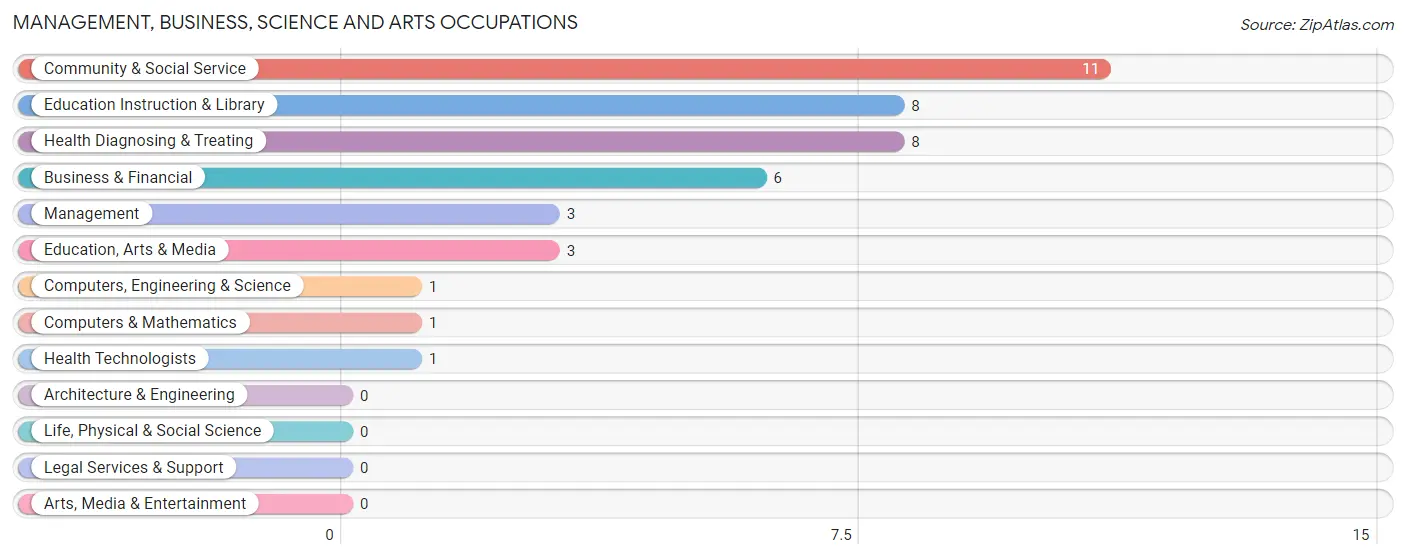
Management, Business, Science and Arts Occupations
The most common Management, Business, Science and Arts occupations in Quimby are Community & Social Service (11 | 6.2%), Education Instruction & Library (8 | 4.5%), Health Diagnosing & Treating (8 | 4.5%), Business & Financial (6 | 3.4%), and Management (3 | 1.7%).
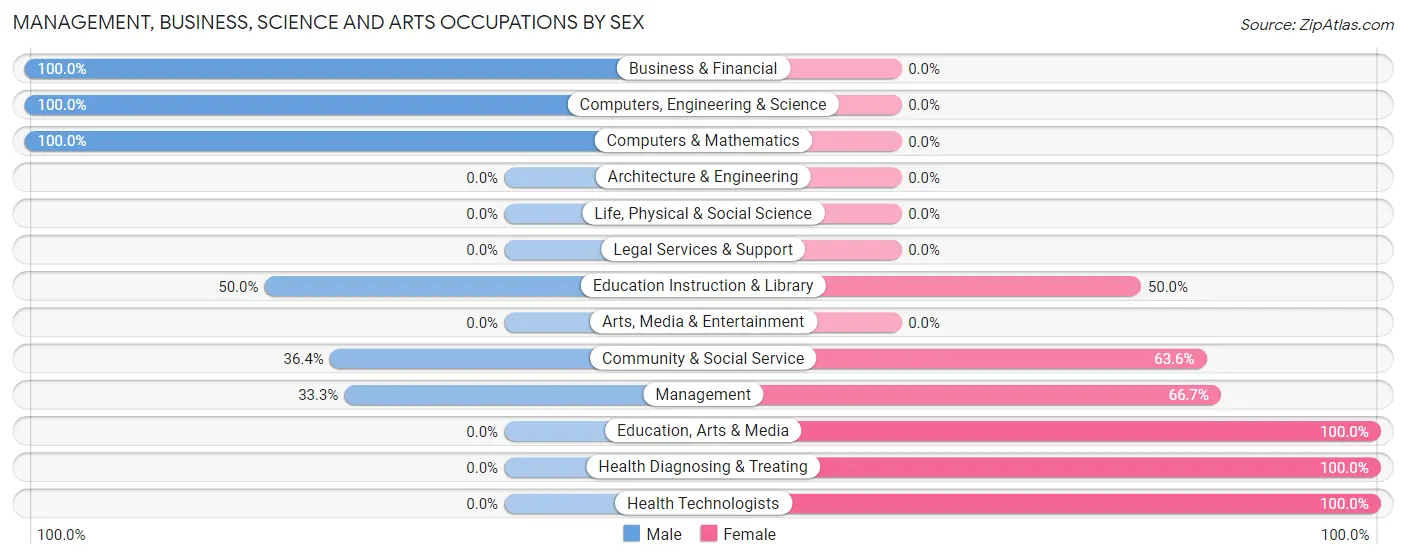
Management, Business, Science and Arts Occupations by Sex
Within the Management, Business, Science and Arts occupations in Quimby, the most male-oriented occupations are Business & Financial (100.0%), Computers, Engineering & Science (100.0%), and Computers & Mathematics (100.0%), while the most female-oriented occupations are Education, Arts & Media (100.0%), Health Diagnosing & Treating (100.0%), and Health Technologists (100.0%).
| Occupation | Male | Female |
| Management | 1 (33.3%) | 2 (66.7%) |
| Business & Financial | 6 (100.0%) | 0 (0.0%) |
| Computers, Engineering & Science | 1 (100.0%) | 0 (0.0%) |
| Computers & Mathematics | 1 (100.0%) | 0 (0.0%) |
| Architecture & Engineering | 0 (0.0%) | 0 (0.0%) |
| Life, Physical & Social Science | 0 (0.0%) | 0 (0.0%) |
| Community & Social Service | 4 (36.4%) | 7 (63.6%) |
| Education, Arts & Media | 0 (0.0%) | 3 (100.0%) |
| Legal Services & Support | 0 (0.0%) | 0 (0.0%) |
| Education Instruction & Library | 4 (50.0%) | 4 (50.0%) |
| Arts, Media & Entertainment | 0 (0.0%) | 0 (0.0%) |
| Health Diagnosing & Treating | 0 (0.0%) | 8 (100.0%) |
| Health Technologists | 0 (0.0%) | 1 (100.0%) |
| Total (Category) | 12 (41.4%) | 17 (58.6%) |
| Total (Overall) | 71 (40.1%) | 106 (59.9%) |
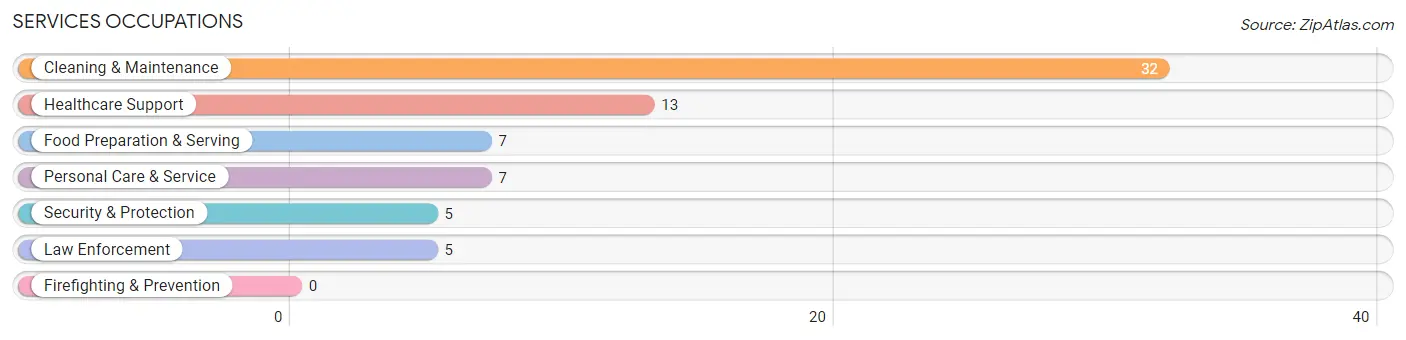
Services Occupations
The most common Services occupations in Quimby are Cleaning & Maintenance (32 | 18.1%), Healthcare Support (13 | 7.3%), Food Preparation & Serving (7 | 4.0%), Personal Care & Service (7 | 4.0%), and Security & Protection (5 | 2.8%).
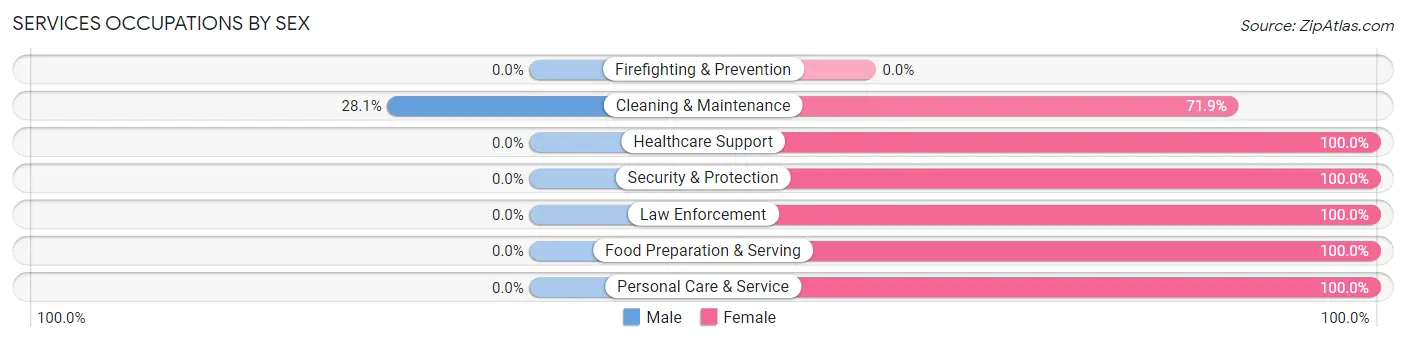
Services Occupations by Sex
| Occupation | Male | Female |
| Healthcare Support | 0 (0.0%) | 13 (100.0%) |
| Security & Protection | 0 (0.0%) | 5 (100.0%) |
| Firefighting & Prevention | 0 (0.0%) | 0 (0.0%) |
| Law Enforcement | 0 (0.0%) | 5 (100.0%) |
| Food Preparation & Serving | 0 (0.0%) | 7 (100.0%) |
| Cleaning & Maintenance | 9 (28.1%) | 23 (71.9%) |
| Personal Care & Service | 0 (0.0%) | 7 (100.0%) |
| Total (Category) | 9 (14.1%) | 55 (85.9%) |
| Total (Overall) | 71 (40.1%) | 106 (59.9%) |
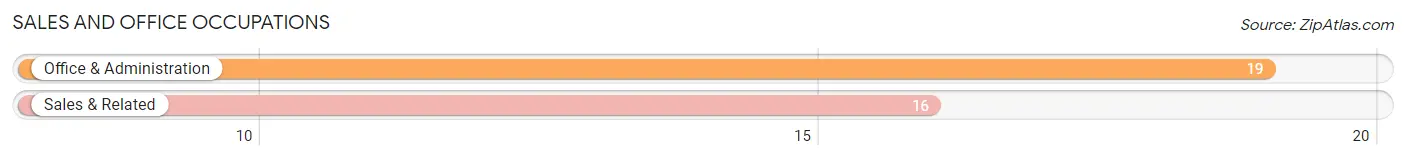
Sales and Office Occupations
The most common Sales and Office occupations in Quimby are Office & Administration (19 | 10.7%), and Sales & Related (16 | 9.0%).
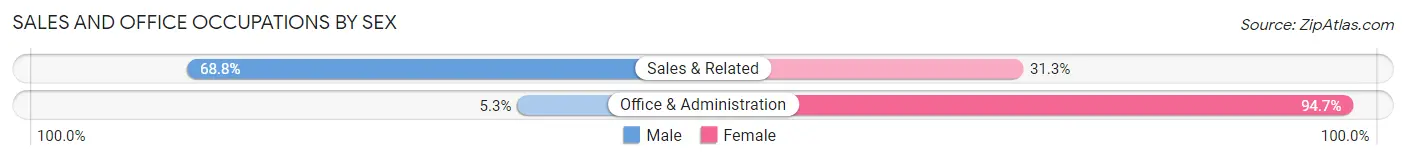
Sales and Office Occupations by Sex
| Occupation | Male | Female |
| Sales & Related | 11 (68.8%) | 5 (31.2%) |
| Office & Administration | 1 (5.3%) | 18 (94.7%) |
| Total (Category) | 12 (34.3%) | 23 (65.7%) |
| Total (Overall) | 71 (40.1%) | 106 (59.9%) |
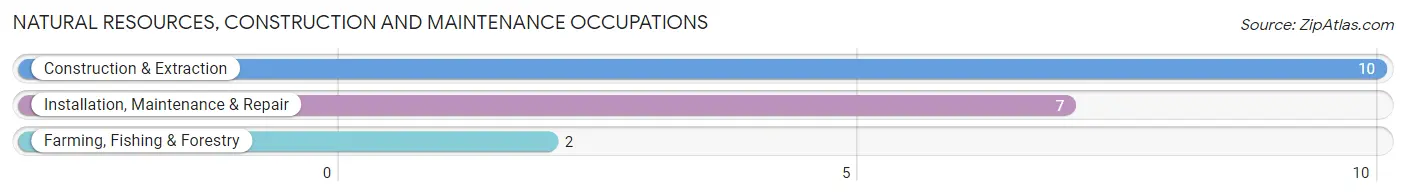
Natural Resources, Construction and Maintenance Occupations
The most common Natural Resources, Construction and Maintenance occupations in Quimby are Construction & Extraction (10 | 5.7%), Installation, Maintenance & Repair (7 | 4.0%), and Farming, Fishing & Forestry (2 | 1.1%).
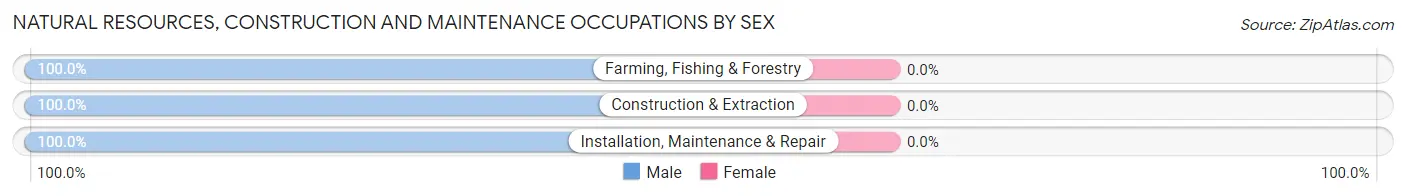
Natural Resources, Construction and Maintenance Occupations by Sex
| Occupation | Male | Female |
| Farming, Fishing & Forestry | 2 (100.0%) | 0 (0.0%) |
| Construction & Extraction | 10 (100.0%) | 0 (0.0%) |
| Installation, Maintenance & Repair | 7 (100.0%) | 0 (0.0%) |
| Total (Category) | 19 (100.0%) | 0 (0.0%) |
| Total (Overall) | 71 (40.1%) | 106 (59.9%) |
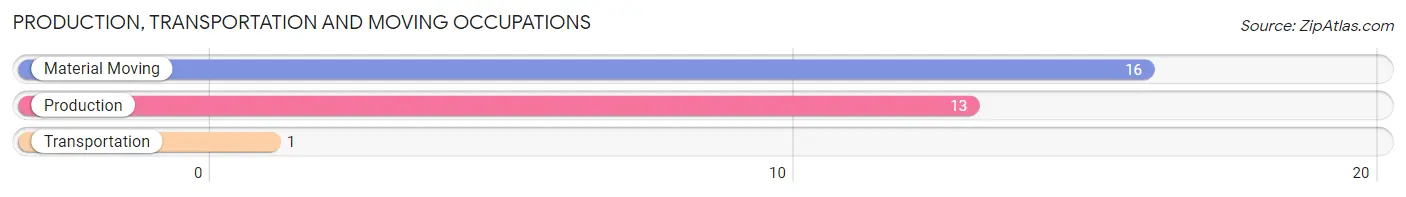
Production, Transportation and Moving Occupations
The most common Production, Transportation and Moving occupations in Quimby are Material Moving (16 | 9.0%), Production (13 | 7.3%), and Transportation (1 | 0.6%).
Production, Transportation and Moving Occupations by Sex
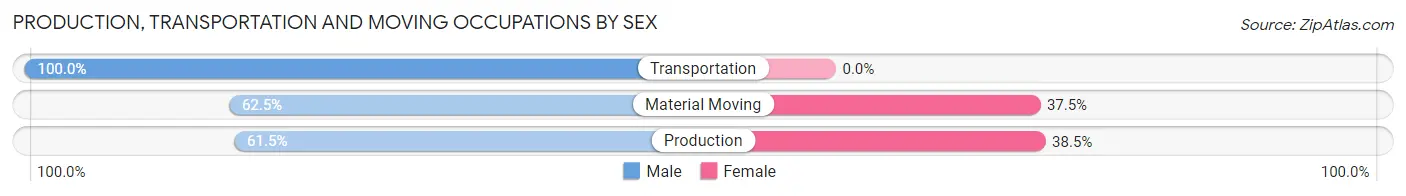
| Occupation | Male | Female |
| Production | 8 (61.5%) | 5 (38.5%) |
| Transportation | 1 (100.0%) | 0 (0.0%) |
| Material Moving | 10 (62.5%) | 6 (37.5%) |
| Total (Category) | 19 (63.3%) | 11 (36.7%) |
| Total (Overall) | 71 (40.1%) | 106 (59.9%) |
Employment Industries by Sex in Quimby
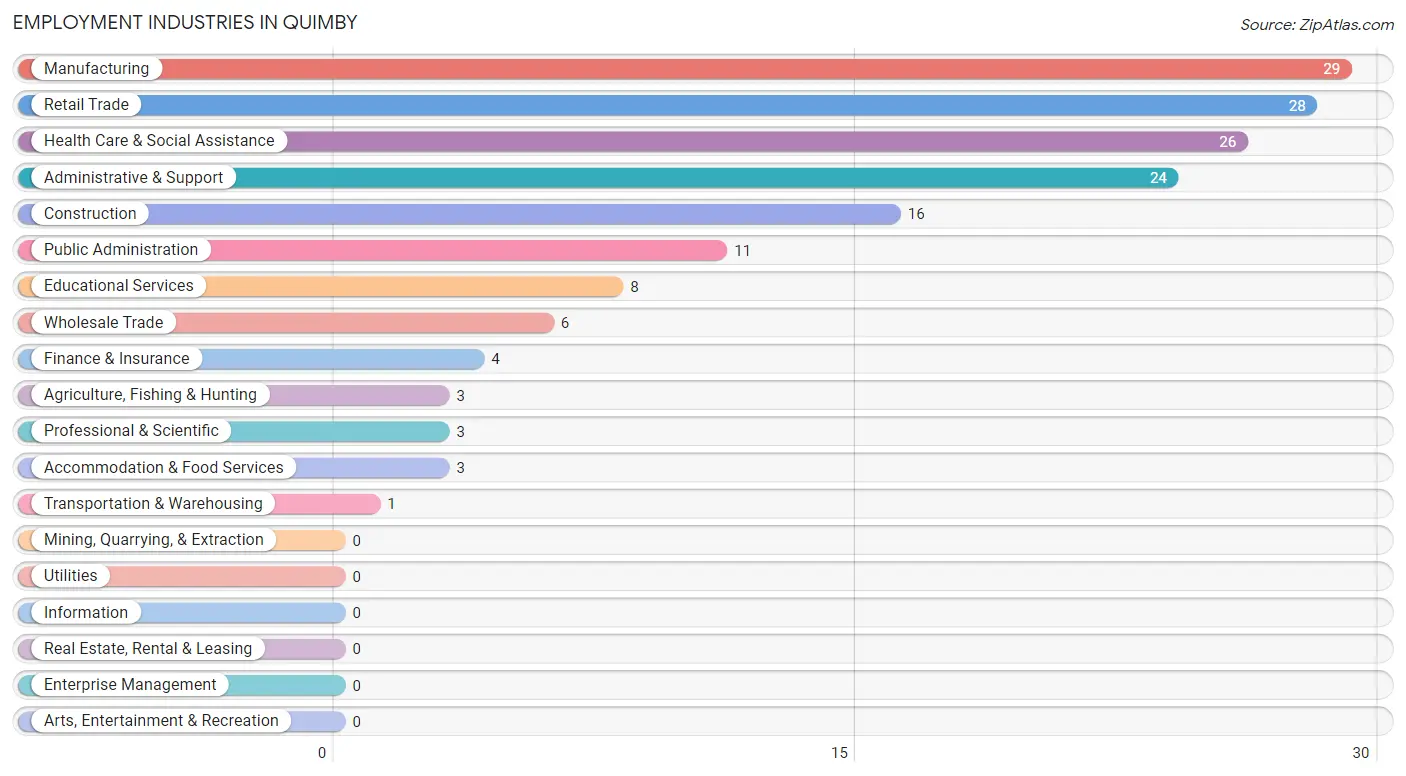
Employment Industries in Quimby
The major employment industries in Quimby include Manufacturing (29 | 16.4%), Retail Trade (28 | 15.8%), Health Care & Social Assistance (26 | 14.7%), Administrative & Support (24 | 13.6%), and Construction (16 | 9.0%).
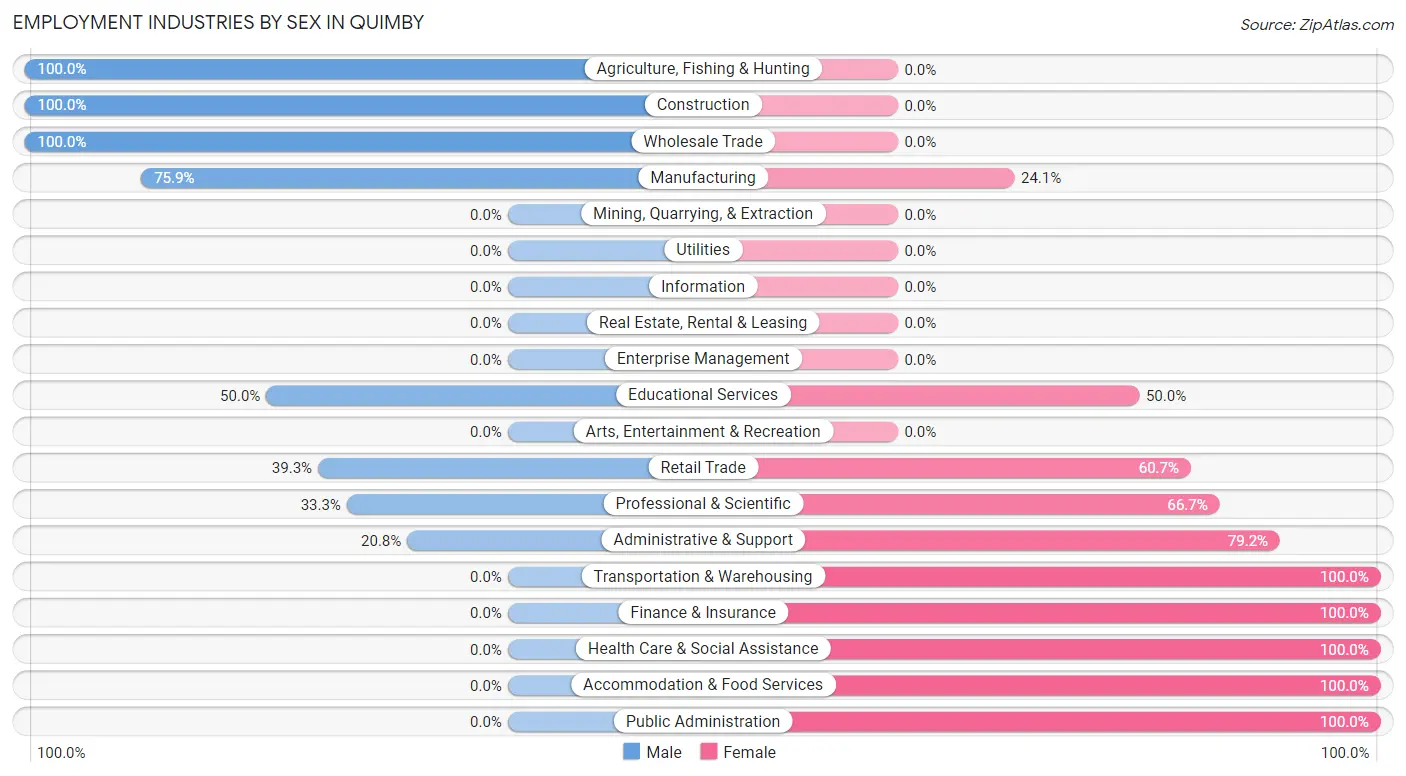
Employment Industries by Sex in Quimby
The Quimby industries that see more men than women are Agriculture, Fishing & Hunting (100.0%), Construction (100.0%), and Wholesale Trade (100.0%), whereas the industries that tend to have a higher number of women are Transportation & Warehousing (100.0%), Finance & Insurance (100.0%), and Health Care & Social Assistance (100.0%).
| Industry | Male | Female |
| Agriculture, Fishing & Hunting | 3 (100.0%) | 0 (0.0%) |
| Mining, Quarrying, & Extraction | 0 (0.0%) | 0 (0.0%) |
| Construction | 16 (100.0%) | 0 (0.0%) |
| Manufacturing | 22 (75.9%) | 7 (24.1%) |
| Wholesale Trade | 6 (100.0%) | 0 (0.0%) |
| Retail Trade | 11 (39.3%) | 17 (60.7%) |
| Transportation & Warehousing | 0 (0.0%) | 1 (100.0%) |
| Utilities | 0 (0.0%) | 0 (0.0%) |
| Information | 0 (0.0%) | 0 (0.0%) |
| Finance & Insurance | 0 (0.0%) | 4 (100.0%) |
| Real Estate, Rental & Leasing | 0 (0.0%) | 0 (0.0%) |
| Professional & Scientific | 1 (33.3%) | 2 (66.7%) |
| Enterprise Management | 0 (0.0%) | 0 (0.0%) |
| Administrative & Support | 5 (20.8%) | 19 (79.2%) |
| Educational Services | 4 (50.0%) | 4 (50.0%) |
| Health Care & Social Assistance | 0 (0.0%) | 26 (100.0%) |
| Arts, Entertainment & Recreation | 0 (0.0%) | 0 (0.0%) |
| Accommodation & Food Services | 0 (0.0%) | 3 (100.0%) |
| Public Administration | 0 (0.0%) | 11 (100.0%) |
| Total | 71 (40.1%) | 106 (59.9%) |
Education in Quimby
School Enrollment in Quimby
The most common levels of schooling among the 54 students in Quimby are high school (21 | 38.9%), nursery / preschool (11 | 20.4%), and elementary school (10 | 18.5%).
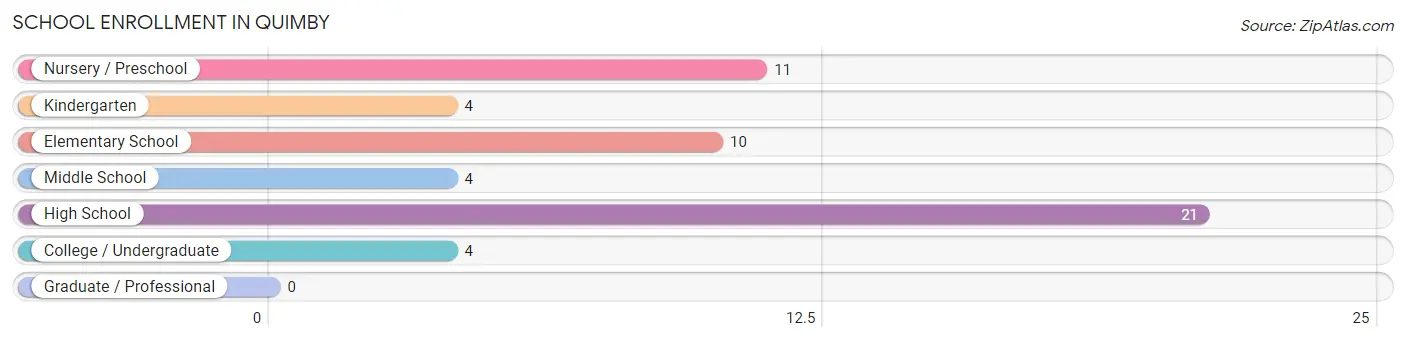
| School Level | # Students | % Students |
| Nursery / Preschool | 11 | 20.4% |
| Kindergarten | 4 | 7.4% |
| Elementary School | 10 | 18.5% |
| Middle School | 4 | 7.4% |
| High School | 21 | 38.9% |
| College / Undergraduate | 4 | 7.4% |
| Graduate / Professional | 0 | 0.0% |
| Total | 54 | 100.0% |
School Enrollment by Age by Funding Source in Quimby
Out of a total of 54 students who are enrolled in schools in Quimby, 2 (3.7%) attend a private institution, while the remaining 52 (96.3%) are enrolled in public schools. The age group of 15 to 17 year olds has the highest likelihood of being enrolled in private schools, with 2 (11.8% in the age bracket) enrolled. Conversely, the age group of 3 to 4 year olds has the lowest likelihood of being enrolled in a private school, with 11 (100.0% in the age bracket) attending a public institution.
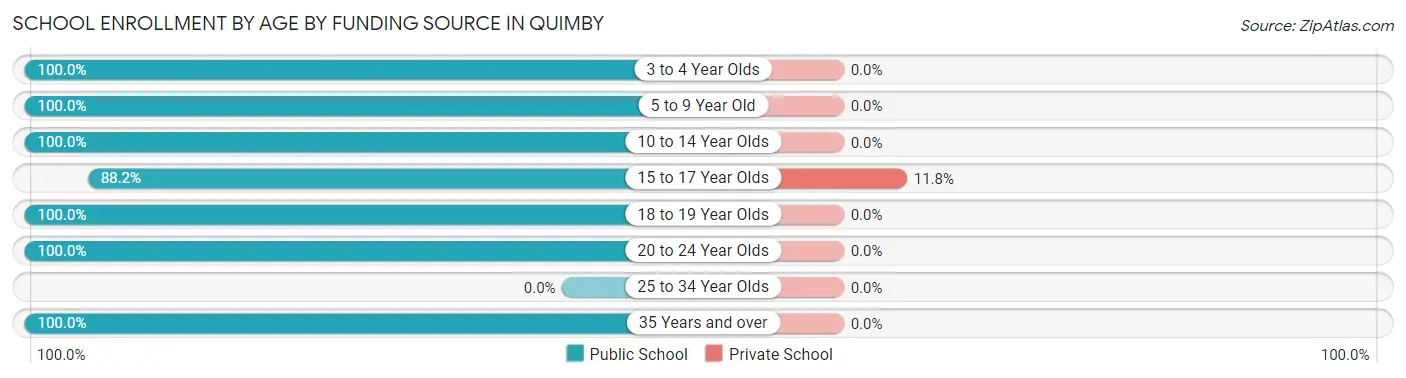
| Age Bracket | Public School | Private School |
| 3 to 4 Year Olds | 11 (100.0%) | 0 (0.0%) |
| 5 to 9 Year Old | 14 (100.0%) | 0 (0.0%) |
| 10 to 14 Year Olds | 4 (100.0%) | 0 (0.0%) |
| 15 to 17 Year Olds | 15 (88.2%) | 2 (11.8%) |
| 18 to 19 Year Olds | 2 (100.0%) | 0 (0.0%) |
| 20 to 24 Year Olds | 3 (100.0%) | 0 (0.0%) |
| 25 to 34 Year Olds | 0 (0.0%) | 0 (0.0%) |
| 35 Years and over | 3 (100.0%) | 0 (0.0%) |
| Total | 52 (96.3%) | 2 (3.7%) |
Educational Attainment by Field of Study in Quimby
Business (10 | 37.0%), education (5 | 18.5%), psychology (3 | 11.1%), science & technology (3 | 11.1%), and arts & humanities (3 | 11.1%) are the most common fields of study among 27 individuals in Quimby who have obtained a bachelor's degree or higher.
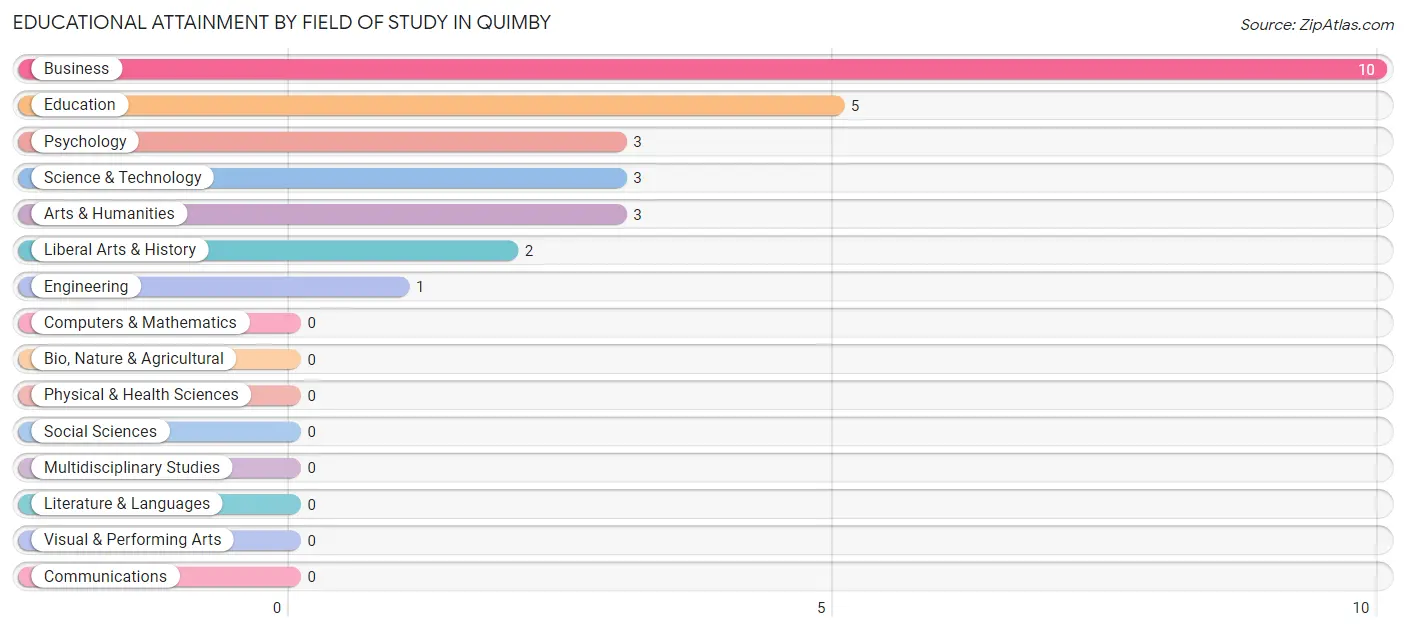
| Field of Study | # Graduates | % Graduates |
| Computers & Mathematics | 0 | 0.0% |
| Bio, Nature & Agricultural | 0 | 0.0% |
| Physical & Health Sciences | 0 | 0.0% |
| Psychology | 3 | 11.1% |
| Social Sciences | 0 | 0.0% |
| Engineering | 1 | 3.7% |
| Multidisciplinary Studies | 0 | 0.0% |
| Science & Technology | 3 | 11.1% |
| Business | 10 | 37.0% |
| Education | 5 | 18.5% |
| Literature & Languages | 0 | 0.0% |
| Liberal Arts & History | 2 | 7.4% |
| Visual & Performing Arts | 0 | 0.0% |
| Communications | 0 | 0.0% |
| Arts & Humanities | 3 | 11.1% |
| Total | 27 | 100.0% |
Transportation & Commute in Quimby
Vehicle Availability by Sex in Quimby
The most prevalent vehicle ownership categories in Quimby are males with 2 vehicles (38, accounting for 53.5%) and females with 2 vehicles (43, making up 36.2%).
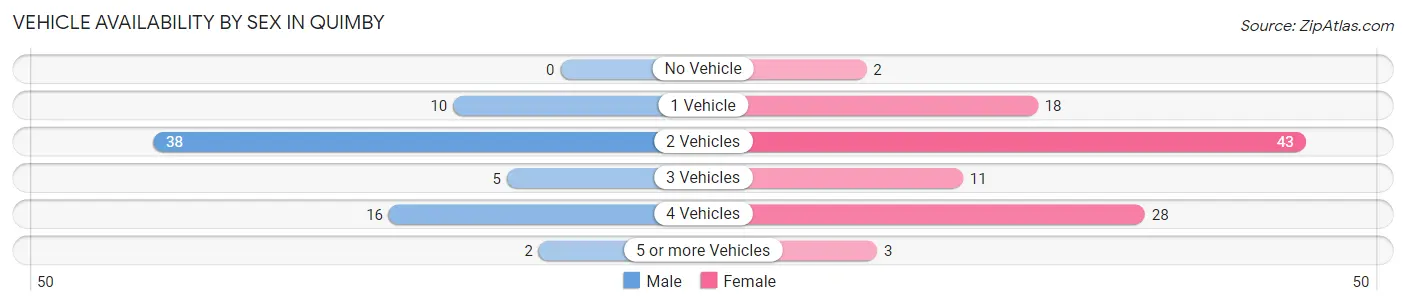
| Vehicles Available | Male | Female |
| No Vehicle | 0 (0.0%) | 2 (1.9%) |
| 1 Vehicle | 10 (14.1%) | 18 (17.1%) |
| 2 Vehicles | 38 (53.5%) | 43 (40.9%) |
| 3 Vehicles | 5 (7.0%) | 11 (10.5%) |
| 4 Vehicles | 16 (22.5%) | 28 (26.7%) |
| 5 or more Vehicles | 2 (2.8%) | 3 (2.9%) |
| Total | 71 (100.0%) | 105 (100.0%) |
Commute Time in Quimby
The most frequently occuring commute durations in Quimby are 20 to 24 minutes (54 commuters, 31.6%), 15 to 19 minutes (35 commuters, 20.5%), and 30 to 34 minutes (19 commuters, 11.1%).
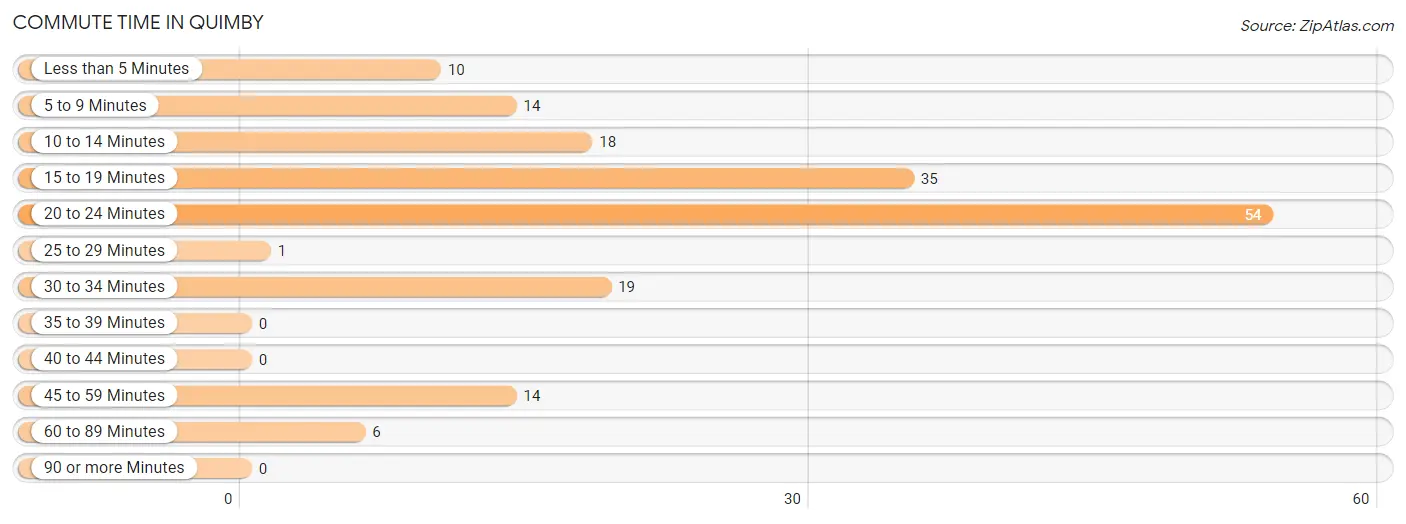
| Commute Time | # Commuters | % Commuters |
| Less than 5 Minutes | 10 | 5.9% |
| 5 to 9 Minutes | 14 | 8.2% |
| 10 to 14 Minutes | 18 | 10.5% |
| 15 to 19 Minutes | 35 | 20.5% |
| 20 to 24 Minutes | 54 | 31.6% |
| 25 to 29 Minutes | 1 | 0.6% |
| 30 to 34 Minutes | 19 | 11.1% |
| 35 to 39 Minutes | 0 | 0.0% |
| 40 to 44 Minutes | 0 | 0.0% |
| 45 to 59 Minutes | 14 | 8.2% |
| 60 to 89 Minutes | 6 | 3.5% |
| 90 or more Minutes | 0 | 0.0% |
Commute Time by Sex in Quimby
The most common commute times in Quimby are 45 to 59 minutes (12 commuters, 16.9%) for males and 20 to 24 minutes (45 commuters, 45.0%) for females.
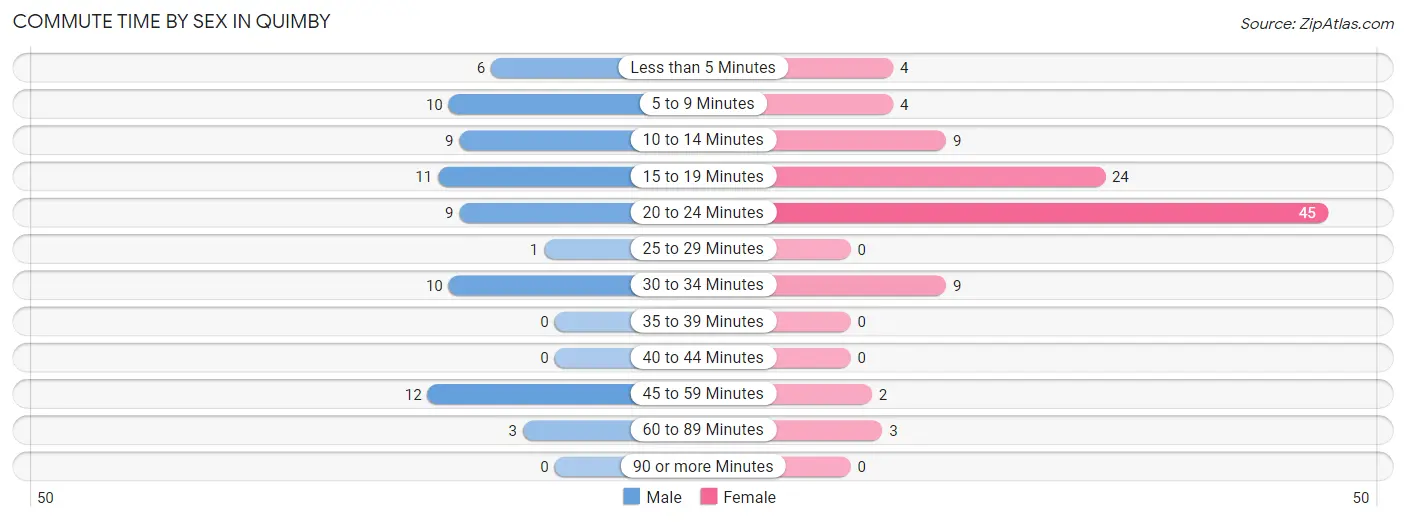
| Commute Time | Male | Female |
| Less than 5 Minutes | 6 (8.5%) | 4 (4.0%) |
| 5 to 9 Minutes | 10 (14.1%) | 4 (4.0%) |
| 10 to 14 Minutes | 9 (12.7%) | 9 (9.0%) |
| 15 to 19 Minutes | 11 (15.5%) | 24 (24.0%) |
| 20 to 24 Minutes | 9 (12.7%) | 45 (45.0%) |
| 25 to 29 Minutes | 1 (1.4%) | 0 (0.0%) |
| 30 to 34 Minutes | 10 (14.1%) | 9 (9.0%) |
| 35 to 39 Minutes | 0 (0.0%) | 0 (0.0%) |
| 40 to 44 Minutes | 0 (0.0%) | 0 (0.0%) |
| 45 to 59 Minutes | 12 (16.9%) | 2 (2.0%) |
| 60 to 89 Minutes | 3 (4.2%) | 3 (3.0%) |
| 90 or more Minutes | 0 (0.0%) | 0 (0.0%) |
Time of Departure to Work by Sex in Quimby
The most frequent times of departure to work in Quimby are 7:30 AM to 7:59 AM (14, 19.7%) for males and 10:00 AM to 10:59 AM (23, 23.0%) for females.
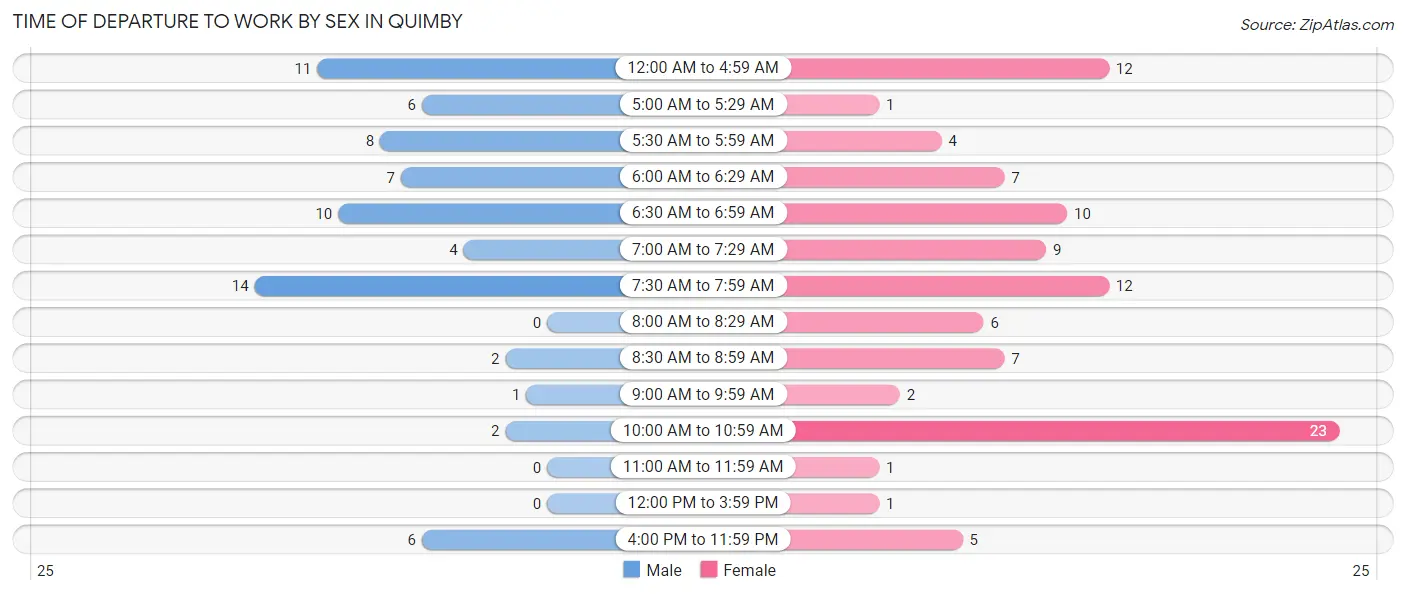
| Time of Departure | Male | Female |
| 12:00 AM to 4:59 AM | 11 (15.5%) | 12 (12.0%) |
| 5:00 AM to 5:29 AM | 6 (8.5%) | 1 (1.0%) |
| 5:30 AM to 5:59 AM | 8 (11.3%) | 4 (4.0%) |
| 6:00 AM to 6:29 AM | 7 (9.9%) | 7 (7.0%) |
| 6:30 AM to 6:59 AM | 10 (14.1%) | 10 (10.0%) |
| 7:00 AM to 7:29 AM | 4 (5.6%) | 9 (9.0%) |
| 7:30 AM to 7:59 AM | 14 (19.7%) | 12 (12.0%) |
| 8:00 AM to 8:29 AM | 0 (0.0%) | 6 (6.0%) |
| 8:30 AM to 8:59 AM | 2 (2.8%) | 7 (7.0%) |
| 9:00 AM to 9:59 AM | 1 (1.4%) | 2 (2.0%) |
| 10:00 AM to 10:59 AM | 2 (2.8%) | 23 (23.0%) |
| 11:00 AM to 11:59 AM | 0 (0.0%) | 1 (1.0%) |
| 12:00 PM to 3:59 PM | 0 (0.0%) | 1 (1.0%) |
| 4:00 PM to 11:59 PM | 6 (8.5%) | 5 (5.0%) |
| Total | 71 (100.0%) | 100 (100.0%) |
Housing Occupancy in Quimby
Occupancy by Ownership in Quimby
Of the total 170 dwellings in Quimby, owner-occupied units account for 150 (88.2%), while renter-occupied units make up 20 (11.8%).
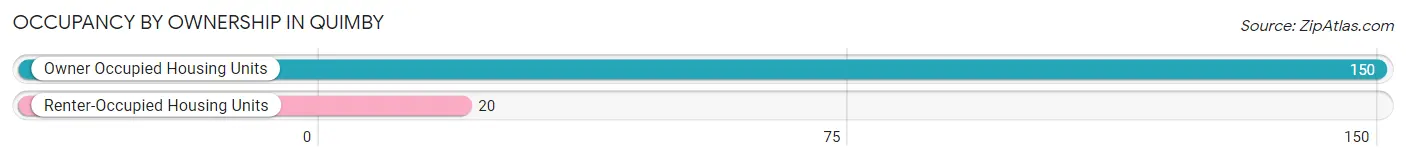
| Occupancy | # Housing Units | % Housing Units |
| Owner Occupied Housing Units | 150 | 88.2% |
| Renter-Occupied Housing Units | 20 | 11.8% |
| Total Occupied Housing Units | 170 | 100.0% |
Occupancy by Household Size in Quimby
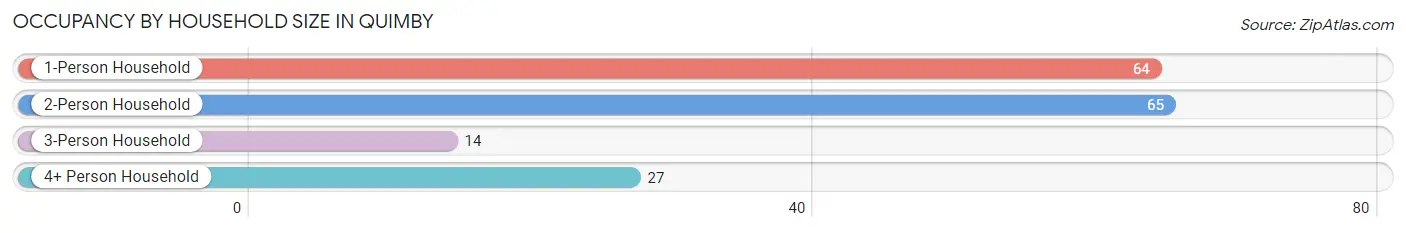
| Household Size | # Housing Units | % Housing Units |
| 1-Person Household | 64 | 37.7% |
| 2-Person Household | 65 | 38.2% |
| 3-Person Household | 14 | 8.2% |
| 4+ Person Household | 27 | 15.9% |
| Total Housing Units | 170 | 100.0% |
Occupancy by Ownership by Household Size in Quimby
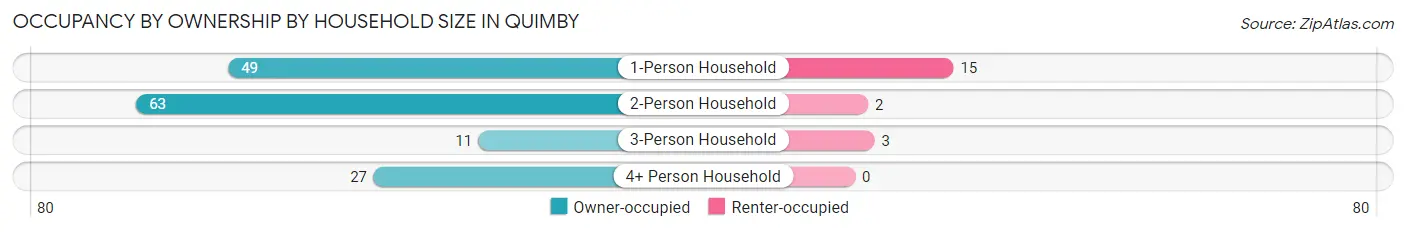
| Household Size | Owner-occupied | Renter-occupied |
| 1-Person Household | 49 (76.6%) | 15 (23.4%) |
| 2-Person Household | 63 (96.9%) | 2 (3.1%) |
| 3-Person Household | 11 (78.6%) | 3 (21.4%) |
| 4+ Person Household | 27 (100.0%) | 0 (0.0%) |
| Total Housing Units | 150 (88.2%) | 20 (11.8%) |
Occupancy by Educational Attainment in Quimby
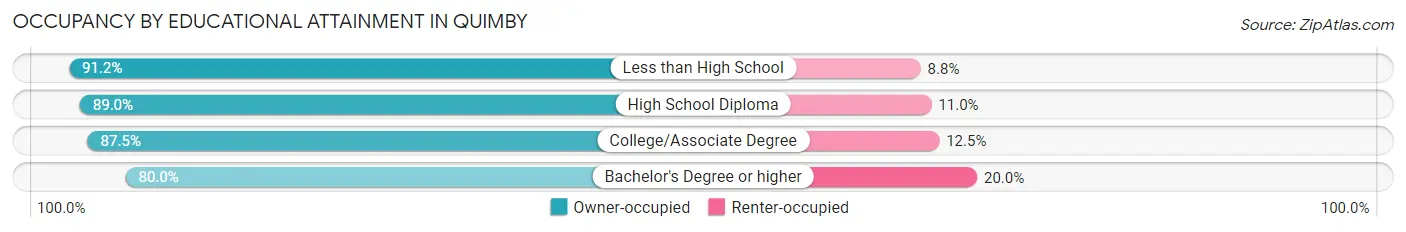
| Household Size | Owner-occupied | Renter-occupied |
| Less than High School | 31 (91.2%) | 3 (8.8%) |
| High School Diploma | 65 (89.0%) | 8 (11.0%) |
| College/Associate Degree | 42 (87.5%) | 6 (12.5%) |
| Bachelor's Degree or higher | 12 (80.0%) | 3 (20.0%) |
Occupancy by Age of Householder in Quimby
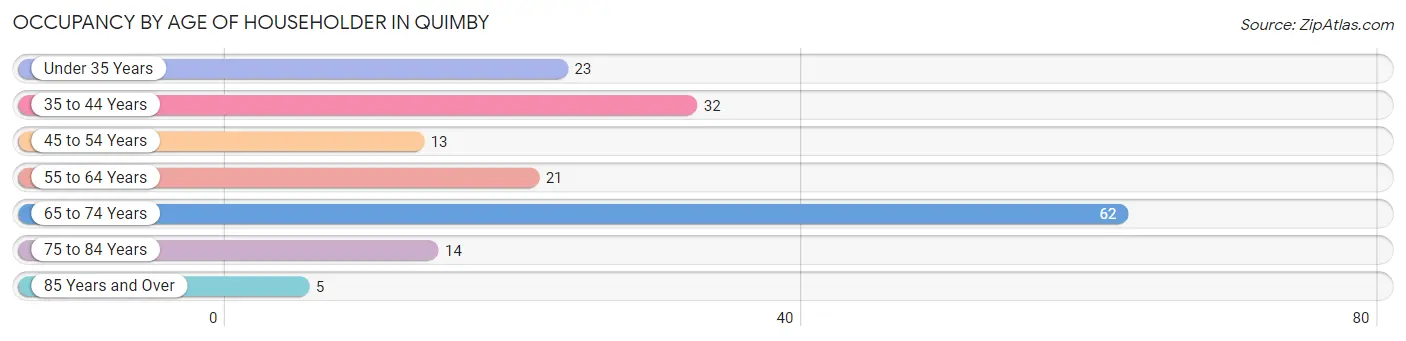
| Age Bracket | # Households | % Households |
| Under 35 Years | 23 | 13.5% |
| 35 to 44 Years | 32 | 18.8% |
| 45 to 54 Years | 13 | 7.6% |
| 55 to 64 Years | 21 | 12.3% |
| 65 to 74 Years | 62 | 36.5% |
| 75 to 84 Years | 14 | 8.2% |
| 85 Years and Over | 5 | 2.9% |
| Total | 170 | 100.0% |
Housing Finances in Quimby
Median Income by Occupancy in Quimby
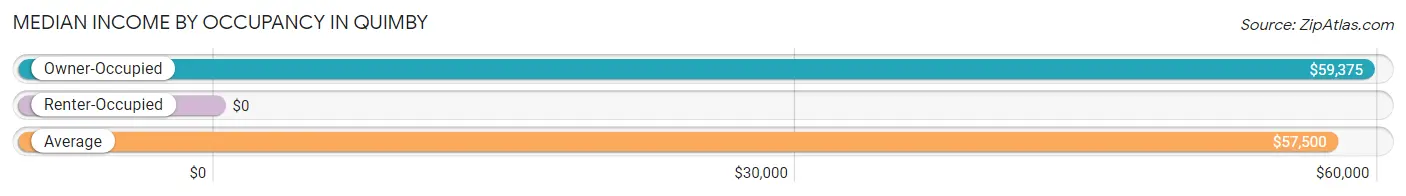
| Occupancy Type | # Households | Median Income |
| Owner-Occupied | 150 (88.2%) | $59,375 |
| Renter-Occupied | 20 (11.8%) | $0 |
| Average | 170 (100.0%) | $57,500 |
Occupancy by Householder Income Bracket in Quimby
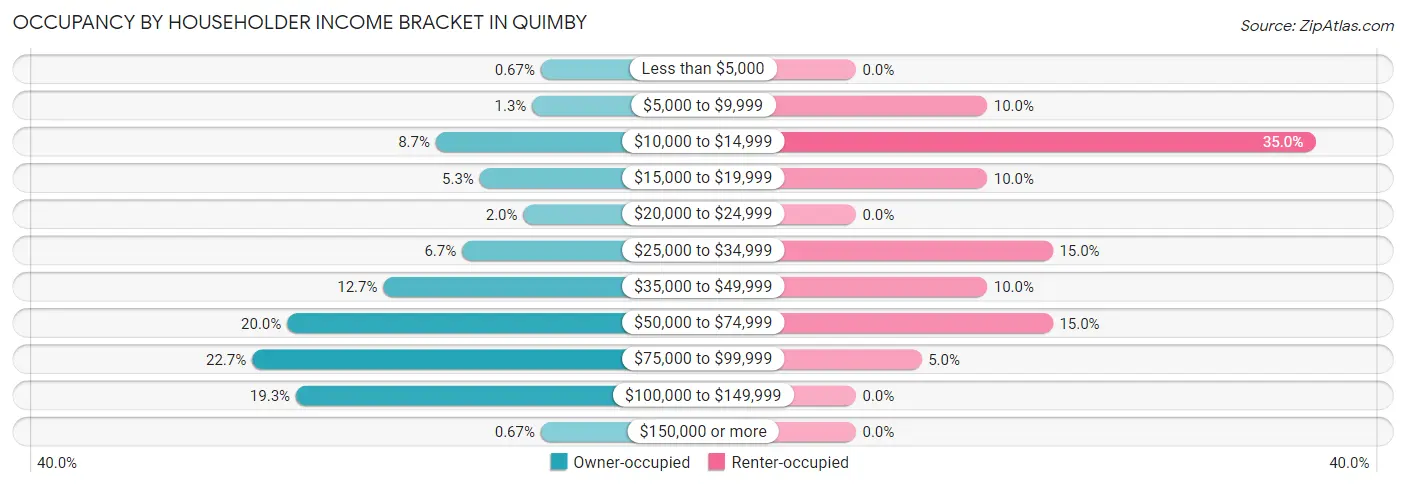
| Income Bracket | Owner-occupied | Renter-occupied |
| Less than $5,000 | 1 (0.7%) | 0 (0.0%) |
| $5,000 to $9,999 | 2 (1.3%) | 2 (10.0%) |
| $10,000 to $14,999 | 13 (8.7%) | 7 (35.0%) |
| $15,000 to $19,999 | 8 (5.3%) | 2 (10.0%) |
| $20,000 to $24,999 | 3 (2.0%) | 0 (0.0%) |
| $25,000 to $34,999 | 10 (6.7%) | 3 (15.0%) |
| $35,000 to $49,999 | 19 (12.7%) | 2 (10.0%) |
| $50,000 to $74,999 | 30 (20.0%) | 3 (15.0%) |
| $75,000 to $99,999 | 34 (22.7%) | 1 (5.0%) |
| $100,000 to $149,999 | 29 (19.3%) | 0 (0.0%) |
| $150,000 or more | 1 (0.7%) | 0 (0.0%) |
| Total | 150 (100.0%) | 20 (100.0%) |
Monthly Housing Cost Tiers in Quimby
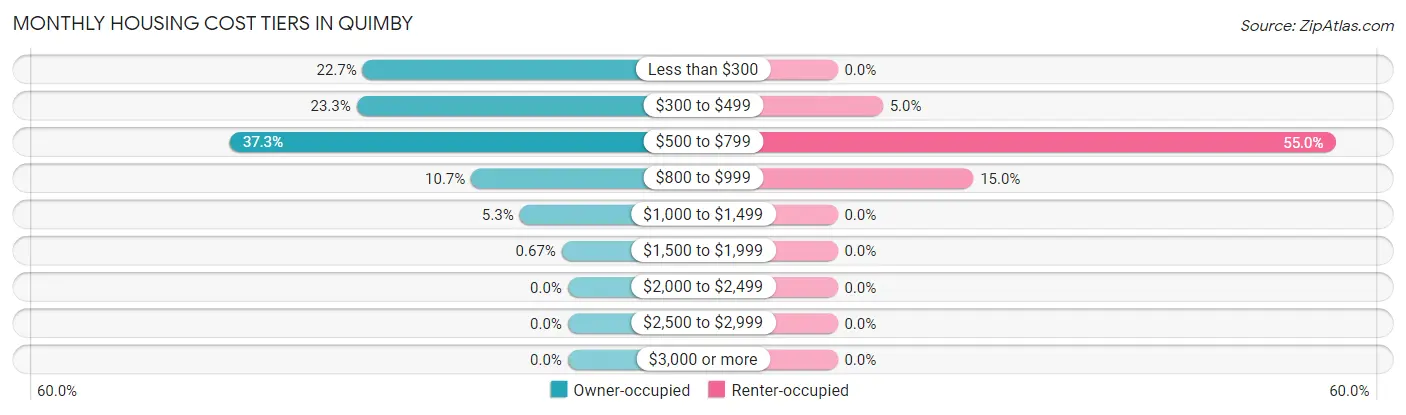
| Monthly Cost | Owner-occupied | Renter-occupied |
| Less than $300 | 34 (22.7%) | 0 (0.0%) |
| $300 to $499 | 35 (23.3%) | 1 (5.0%) |
| $500 to $799 | 56 (37.3%) | 11 (55.0%) |
| $800 to $999 | 16 (10.7%) | 3 (15.0%) |
| $1,000 to $1,499 | 8 (5.3%) | 0 (0.0%) |
| $1,500 to $1,999 | 1 (0.7%) | 0 (0.0%) |
| $2,000 to $2,499 | 0 (0.0%) | 0 (0.0%) |
| $2,500 to $2,999 | 0 (0.0%) | 0 (0.0%) |
| $3,000 or more | 0 (0.0%) | 0 (0.0%) |
| Total | 150 (100.0%) | 20 (100.0%) |
Physical Housing Characteristics in Quimby
Housing Structures in Quimby
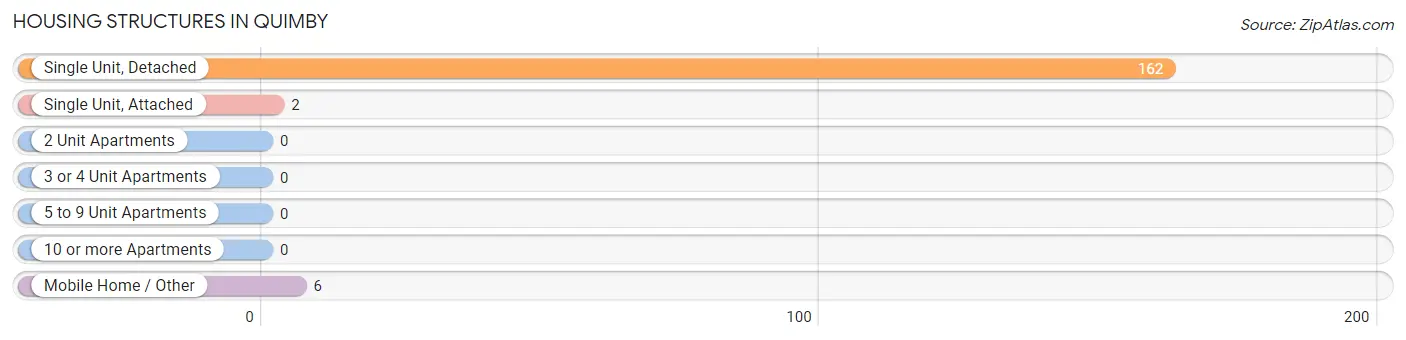
| Structure Type | # Housing Units | % Housing Units |
| Single Unit, Detached | 162 | 95.3% |
| Single Unit, Attached | 2 | 1.2% |
| 2 Unit Apartments | 0 | 0.0% |
| 3 or 4 Unit Apartments | 0 | 0.0% |
| 5 to 9 Unit Apartments | 0 | 0.0% |
| 10 or more Apartments | 0 | 0.0% |
| Mobile Home / Other | 6 | 3.5% |
| Total | 170 | 100.0% |
Housing Structures by Occupancy in Quimby
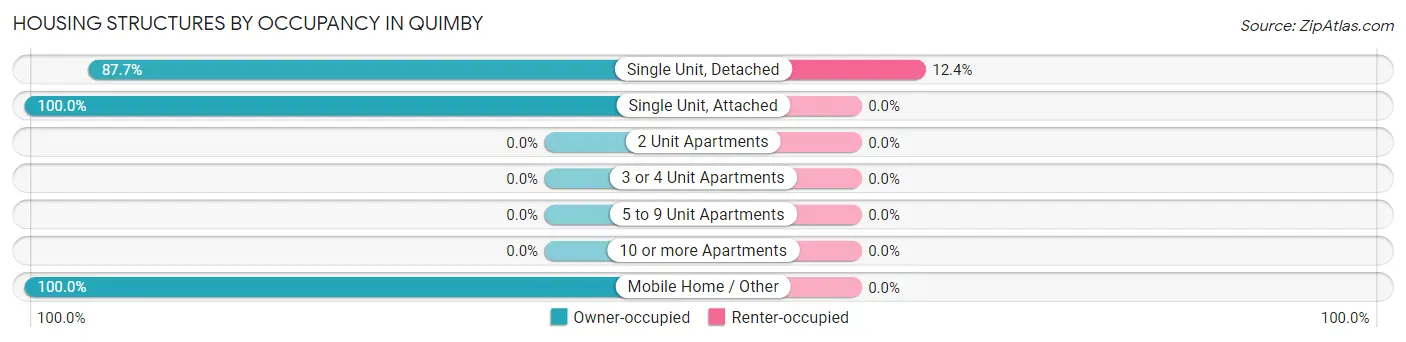
| Structure Type | Owner-occupied | Renter-occupied |
| Single Unit, Detached | 142 (87.6%) | 20 (12.3%) |
| Single Unit, Attached | 2 (100.0%) | 0 (0.0%) |
| 2 Unit Apartments | 0 (0.0%) | 0 (0.0%) |
| 3 or 4 Unit Apartments | 0 (0.0%) | 0 (0.0%) |
| 5 to 9 Unit Apartments | 0 (0.0%) | 0 (0.0%) |
| 10 or more Apartments | 0 (0.0%) | 0 (0.0%) |
| Mobile Home / Other | 6 (100.0%) | 0 (0.0%) |
| Total | 150 (88.2%) | 20 (11.8%) |
Housing Structures by Number of Rooms in Quimby
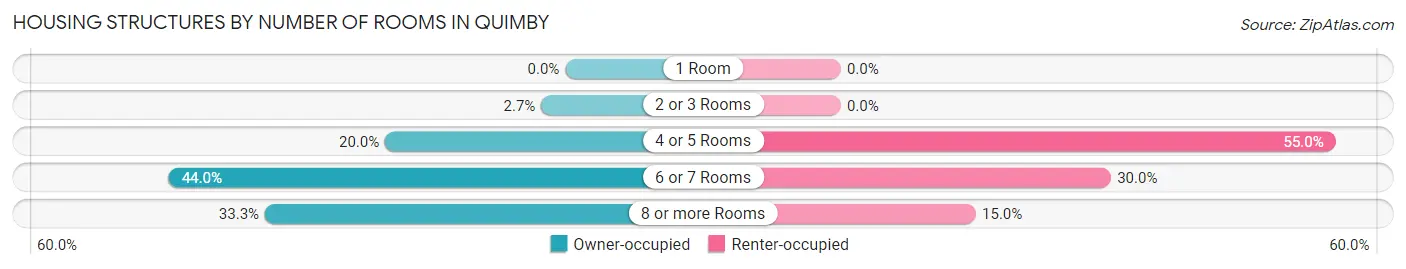
| Number of Rooms | Owner-occupied | Renter-occupied |
| 1 Room | 0 (0.0%) | 0 (0.0%) |
| 2 or 3 Rooms | 4 (2.7%) | 0 (0.0%) |
| 4 or 5 Rooms | 30 (20.0%) | 11 (55.0%) |
| 6 or 7 Rooms | 66 (44.0%) | 6 (30.0%) |
| 8 or more Rooms | 50 (33.3%) | 3 (15.0%) |
| Total | 150 (100.0%) | 20 (100.0%) |
Housing Structure by Heating Type in Quimby
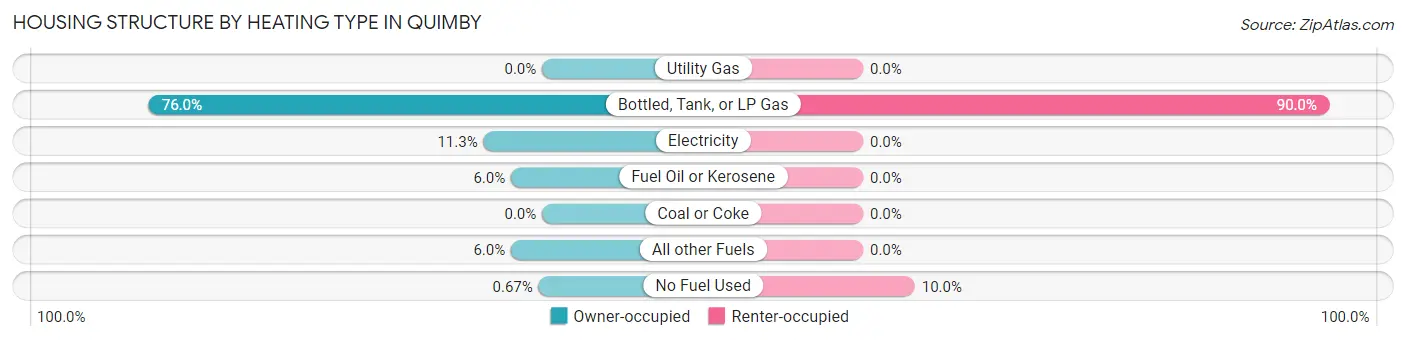
| Heating Type | Owner-occupied | Renter-occupied |
| Utility Gas | 0 (0.0%) | 0 (0.0%) |
| Bottled, Tank, or LP Gas | 114 (76.0%) | 18 (90.0%) |
| Electricity | 17 (11.3%) | 0 (0.0%) |
| Fuel Oil or Kerosene | 9 (6.0%) | 0 (0.0%) |
| Coal or Coke | 0 (0.0%) | 0 (0.0%) |
| All other Fuels | 9 (6.0%) | 0 (0.0%) |
| No Fuel Used | 1 (0.7%) | 2 (10.0%) |
| Total | 150 (100.0%) | 20 (100.0%) |
Household Vehicle Usage in Quimby
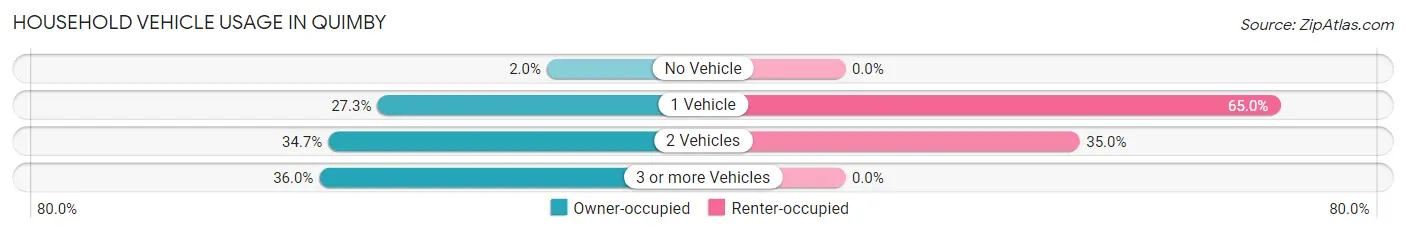
| Vehicles per Household | Owner-occupied | Renter-occupied |
| No Vehicle | 3 (2.0%) | 0 (0.0%) |
| 1 Vehicle | 41 (27.3%) | 13 (65.0%) |
| 2 Vehicles | 52 (34.7%) | 7 (35.0%) |
| 3 or more Vehicles | 54 (36.0%) | 0 (0.0%) |
| Total | 150 (100.0%) | 20 (100.0%) |
Real Estate & Mortgages in Quimby
Real Estate and Mortgage Overview in Quimby
| Characteristic | Without Mortgage | With Mortgage |
| Housing Units | 110 | 40 |
| Median Property Value | $45,000 | $58,000 |
| Median Household Income | $57,917 | $1 |
| Monthly Housing Costs | $452 | $0 |
| Real Estate Taxes | $612 | $2 |
Property Value by Mortgage Status in Quimby
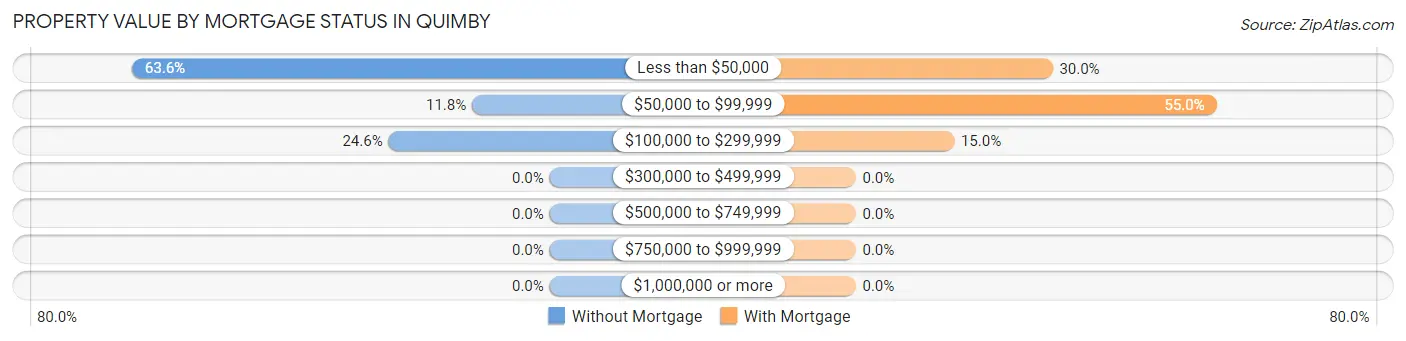
| Property Value | Without Mortgage | With Mortgage |
| Less than $50,000 | 70 (63.6%) | 12 (30.0%) |
| $50,000 to $99,999 | 13 (11.8%) | 22 (55.0%) |
| $100,000 to $299,999 | 27 (24.5%) | 6 (15.0%) |
| $300,000 to $499,999 | 0 (0.0%) | 0 (0.0%) |
| $500,000 to $749,999 | 0 (0.0%) | 0 (0.0%) |
| $750,000 to $999,999 | 0 (0.0%) | 0 (0.0%) |
| $1,000,000 or more | 0 (0.0%) | 0 (0.0%) |
| Total | 110 (100.0%) | 40 (100.0%) |
Household Income by Mortgage Status in Quimby
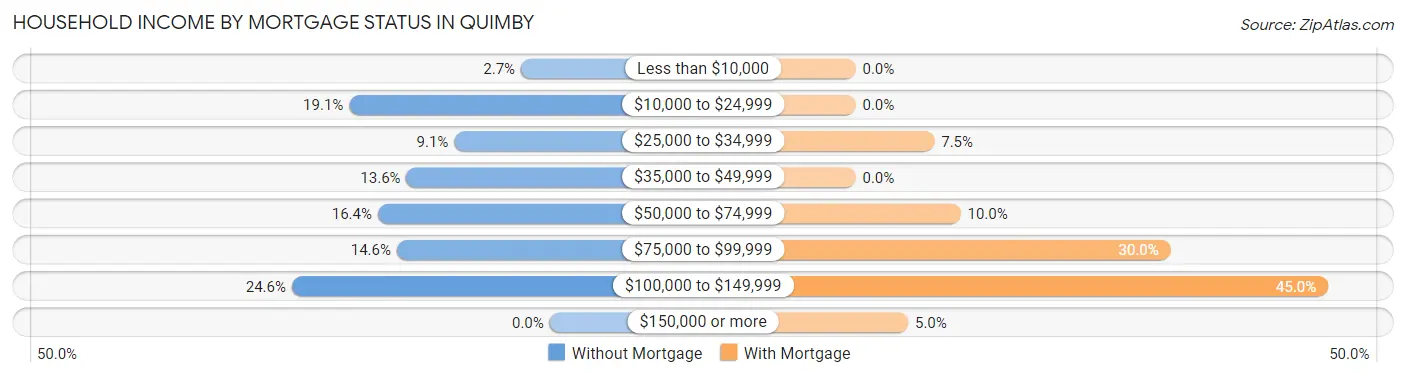
| Household Income | Without Mortgage | With Mortgage |
| Less than $10,000 | 3 (2.7%) | 0 (0.0%) |
| $10,000 to $24,999 | 21 (19.1%) | 0 (0.0%) |
| $25,000 to $34,999 | 10 (9.1%) | 3 (7.5%) |
| $35,000 to $49,999 | 15 (13.6%) | 0 (0.0%) |
| $50,000 to $74,999 | 18 (16.4%) | 4 (10.0%) |
| $75,000 to $99,999 | 16 (14.5%) | 12 (30.0%) |
| $100,000 to $149,999 | 27 (24.5%) | 18 (45.0%) |
| $150,000 or more | 0 (0.0%) | 2 (5.0%) |
| Total | 110 (100.0%) | 40 (100.0%) |
Property Value to Household Income Ratio in Quimby
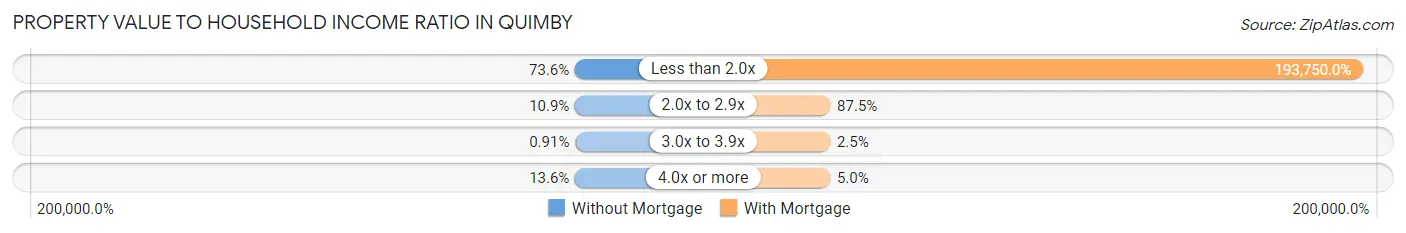
| Value-to-Income Ratio | Without Mortgage | With Mortgage |
| Less than 2.0x | 81 (73.6%) | 77,500 (193,750.0%) |
| 2.0x to 2.9x | 12 (10.9%) | 35 (87.5%) |
| 3.0x to 3.9x | 1 (0.9%) | 1 (2.5%) |
| 4.0x or more | 15 (13.6%) | 2 (5.0%) |
| Total | 110 (100.0%) | 40 (100.0%) |
Real Estate Taxes by Mortgage Status in Quimby
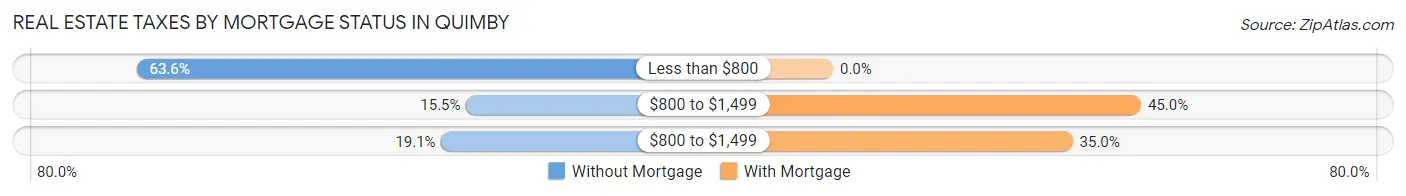
| Property Taxes | Without Mortgage | With Mortgage |
| Less than $800 | 70 (63.6%) | 0 (0.0%) |
| $800 to $1,499 | 17 (15.4%) | 18 (45.0%) |
| $800 to $1,499 | 21 (19.1%) | 14 (35.0%) |
| Total | 110 (100.0%) | 40 (100.0%) |
Health & Disability in Quimby
Health Insurance Coverage by Age in Quimby
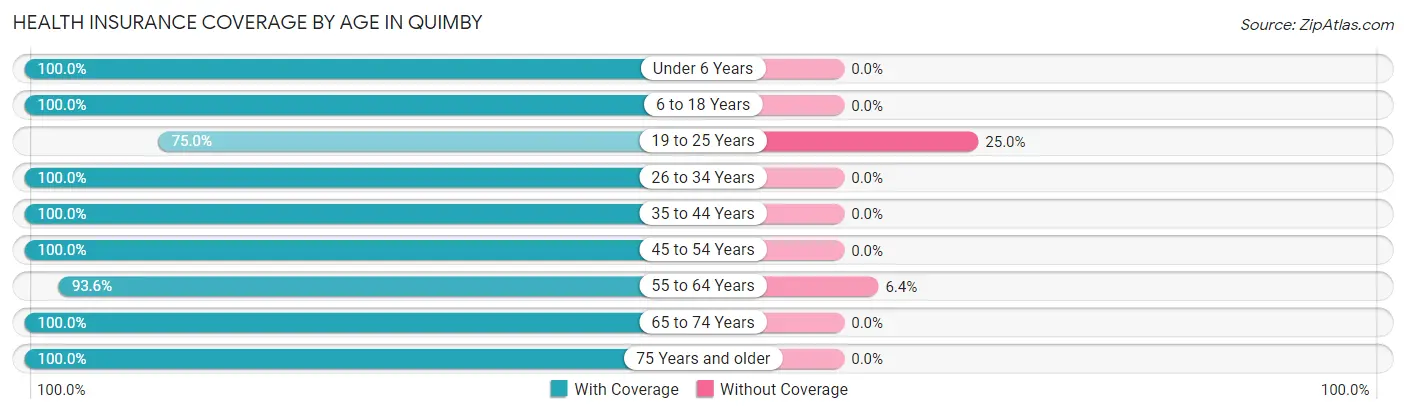
| Age Bracket | With Coverage | Without Coverage |
| Under 6 Years | 14 (100.0%) | 0 (0.0%) |
| 6 to 18 Years | 37 (100.0%) | 0 (0.0%) |
| 19 to 25 Years | 30 (75.0%) | 10 (25.0%) |
| 26 to 34 Years | 11 (100.0%) | 0 (0.0%) |
| 35 to 44 Years | 53 (100.0%) | 0 (0.0%) |
| 45 to 54 Years | 28 (100.0%) | 0 (0.0%) |
| 55 to 64 Years | 44 (93.6%) | 3 (6.4%) |
| 65 to 74 Years | 73 (100.0%) | 0 (0.0%) |
| 75 Years and older | 26 (100.0%) | 0 (0.0%) |
| Total | 316 (96.1%) | 13 (4.0%) |
Health Insurance Coverage by Citizenship Status in Quimby
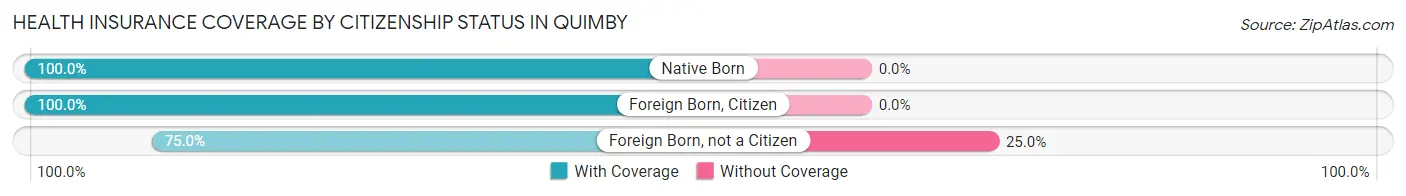
| Citizenship Status | With Coverage | Without Coverage |
| Native Born | 14 (100.0%) | 0 (0.0%) |
| Foreign Born, Citizen | 37 (100.0%) | 0 (0.0%) |
| Foreign Born, not a Citizen | 30 (75.0%) | 10 (25.0%) |
Health Insurance Coverage by Household Income in Quimby
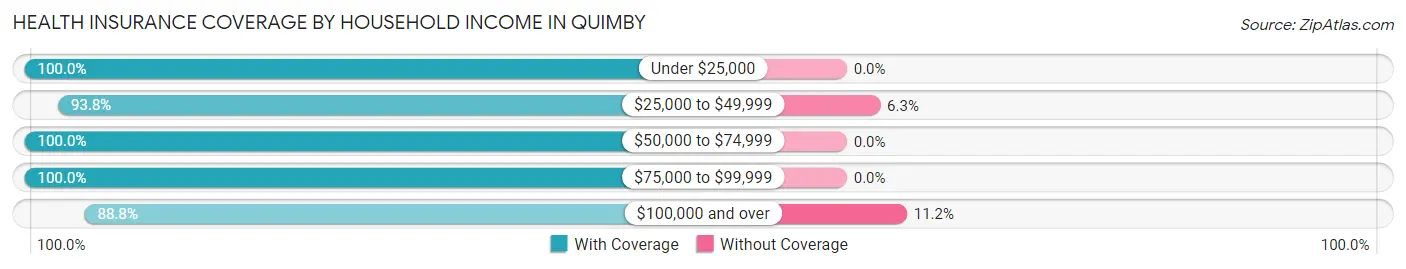
| Household Income | With Coverage | Without Coverage |
| Under $25,000 | 48 (100.0%) | 0 (0.0%) |
| $25,000 to $49,999 | 45 (93.8%) | 3 (6.2%) |
| $50,000 to $74,999 | 73 (100.0%) | 0 (0.0%) |
| $75,000 to $99,999 | 71 (100.0%) | 0 (0.0%) |
| $100,000 and over | 79 (88.8%) | 10 (11.2%) |
Public vs Private Health Insurance Coverage by Age in Quimby
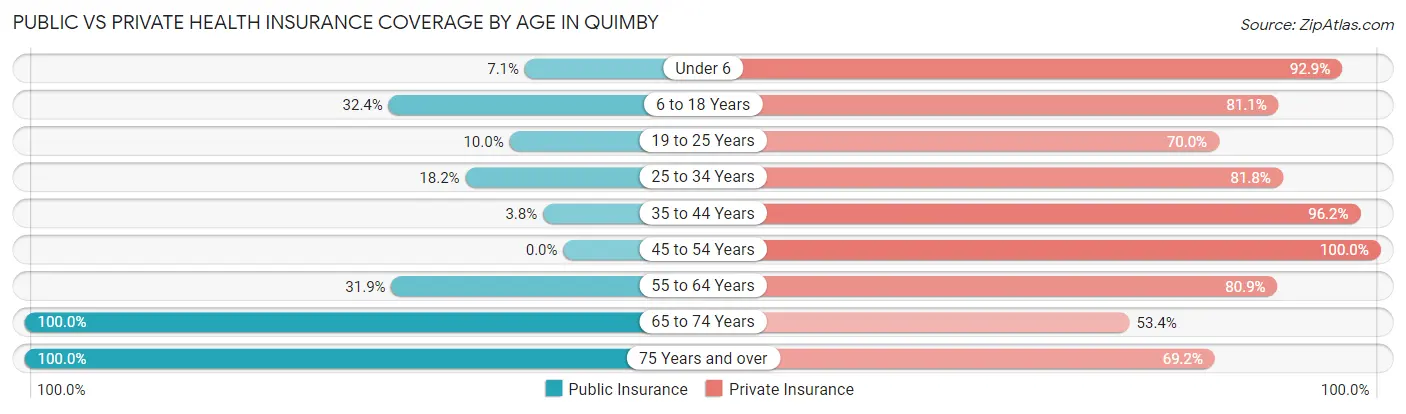
| Age Bracket | Public Insurance | Private Insurance |
| Under 6 | 1 (7.1%) | 13 (92.9%) |
| 6 to 18 Years | 12 (32.4%) | 30 (81.1%) |
| 19 to 25 Years | 4 (10.0%) | 28 (70.0%) |
| 25 to 34 Years | 2 (18.2%) | 9 (81.8%) |
| 35 to 44 Years | 2 (3.8%) | 51 (96.2%) |
| 45 to 54 Years | 0 (0.0%) | 28 (100.0%) |
| 55 to 64 Years | 15 (31.9%) | 38 (80.8%) |
| 65 to 74 Years | 73 (100.0%) | 39 (53.4%) |
| 75 Years and over | 26 (100.0%) | 18 (69.2%) |
| Total | 135 (41.0%) | 254 (77.2%) |
Disability Status by Sex by Age in Quimby
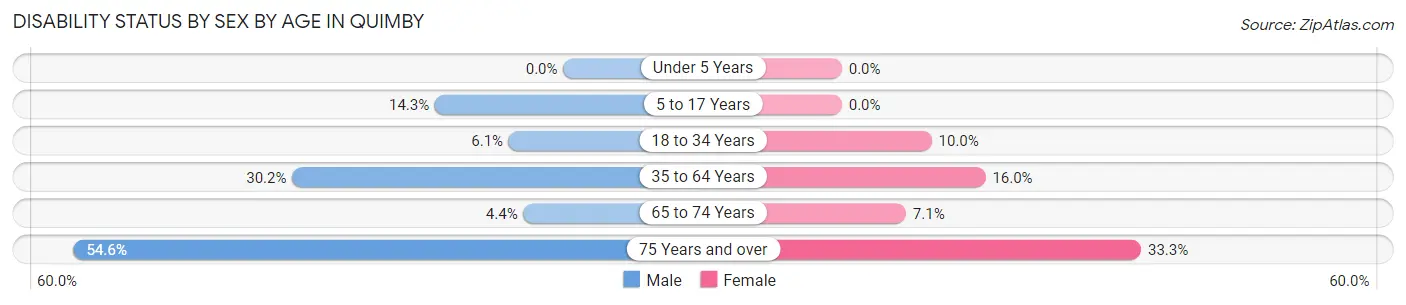
| Age Bracket | Male | Female |
| Under 5 Years | 0 (0.0%) | 0 (0.0%) |
| 5 to 17 Years | 2 (14.3%) | 0 (0.0%) |
| 18 to 34 Years | 2 (6.1%) | 2 (10.0%) |
| 35 to 64 Years | 16 (30.2%) | 12 (16.0%) |
| 65 to 74 Years | 2 (4.4%) | 2 (7.1%) |
| 75 Years and over | 6 (54.5%) | 5 (33.3%) |
Disability Class by Sex by Age in Quimby
Disability Class: Hearing Difficulty
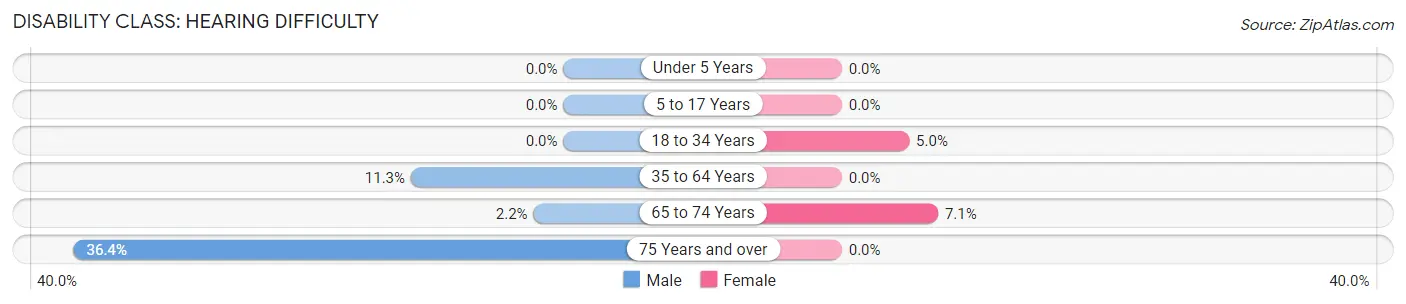
| Age Bracket | Male | Female |
| Under 5 Years | 0 (0.0%) | 0 (0.0%) |
| 5 to 17 Years | 0 (0.0%) | 0 (0.0%) |
| 18 to 34 Years | 0 (0.0%) | 1 (5.0%) |
| 35 to 64 Years | 6 (11.3%) | 0 (0.0%) |
| 65 to 74 Years | 1 (2.2%) | 2 (7.1%) |
| 75 Years and over | 4 (36.4%) | 0 (0.0%) |
Disability Class: Vision Difficulty
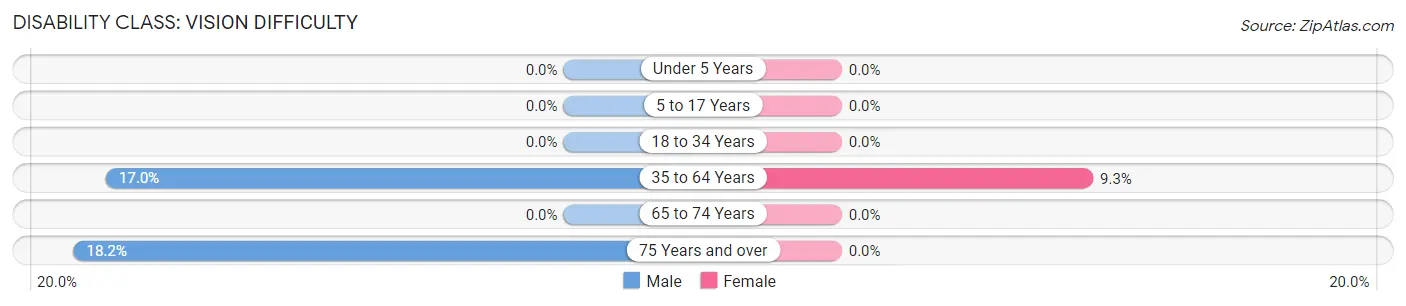
| Age Bracket | Male | Female |
| Under 5 Years | 0 (0.0%) | 0 (0.0%) |
| 5 to 17 Years | 0 (0.0%) | 0 (0.0%) |
| 18 to 34 Years | 0 (0.0%) | 0 (0.0%) |
| 35 to 64 Years | 9 (17.0%) | 7 (9.3%) |
| 65 to 74 Years | 0 (0.0%) | 0 (0.0%) |
| 75 Years and over | 2 (18.2%) | 0 (0.0%) |
Disability Class: Cognitive Difficulty
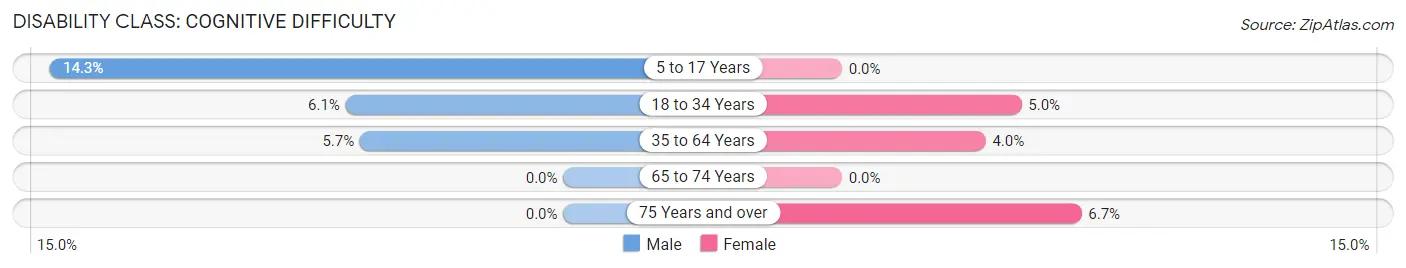
| Age Bracket | Male | Female |
| 5 to 17 Years | 2 (14.3%) | 0 (0.0%) |
| 18 to 34 Years | 2 (6.1%) | 1 (5.0%) |
| 35 to 64 Years | 3 (5.7%) | 3 (4.0%) |
| 65 to 74 Years | 0 (0.0%) | 0 (0.0%) |
| 75 Years and over | 0 (0.0%) | 1 (6.7%) |
Disability Class: Ambulatory Difficulty
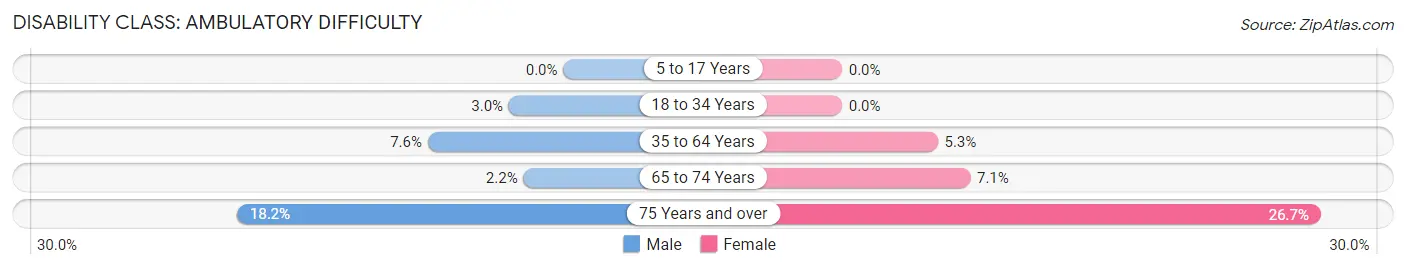
| Age Bracket | Male | Female |
| 5 to 17 Years | 0 (0.0%) | 0 (0.0%) |
| 18 to 34 Years | 1 (3.0%) | 0 (0.0%) |
| 35 to 64 Years | 4 (7.5%) | 4 (5.3%) |
| 65 to 74 Years | 1 (2.2%) | 2 (7.1%) |
| 75 Years and over | 2 (18.2%) | 4 (26.7%) |
Disability Class: Self-Care Difficulty
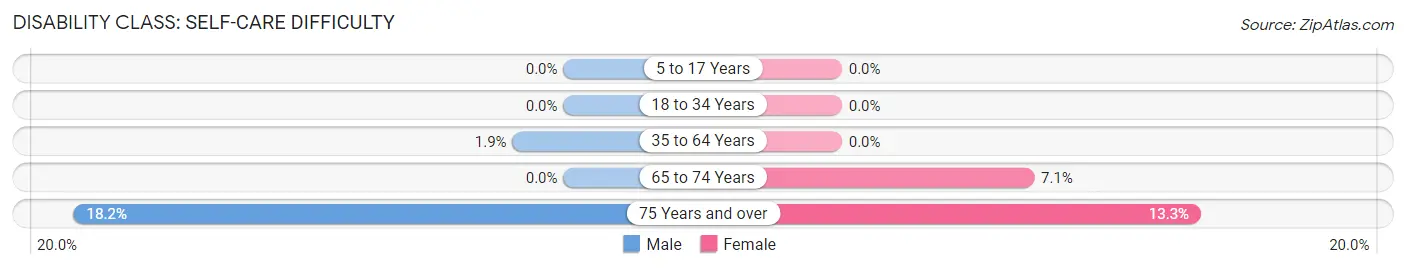
| Age Bracket | Male | Female |
| 5 to 17 Years | 0 (0.0%) | 0 (0.0%) |
| 18 to 34 Years | 0 (0.0%) | 0 (0.0%) |
| 35 to 64 Years | 1 (1.9%) | 0 (0.0%) |
| 65 to 74 Years | 0 (0.0%) | 2 (7.1%) |
| 75 Years and over | 2 (18.2%) | 2 (13.3%) |
Technology Access in Quimby
Computing Device Access in Quimby
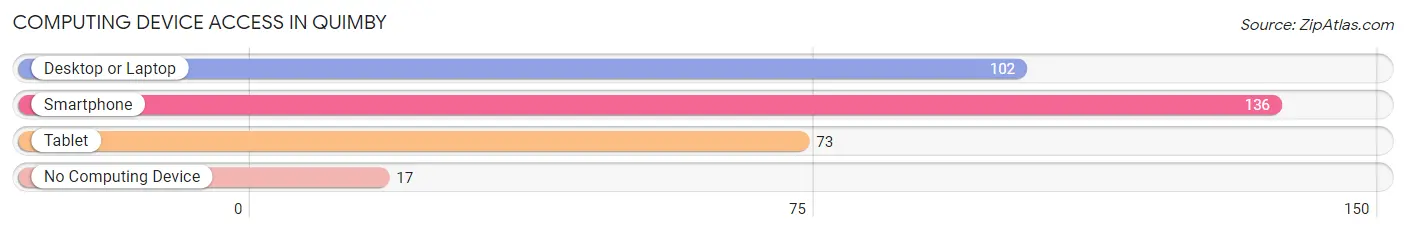
| Device Type | # Households | % Households |
| Desktop or Laptop | 102 | 60.0% |
| Smartphone | 136 | 80.0% |
| Tablet | 73 | 42.9% |
| No Computing Device | 17 | 10.0% |
| Total | 170 | 100.0% |
Internet Access in Quimby
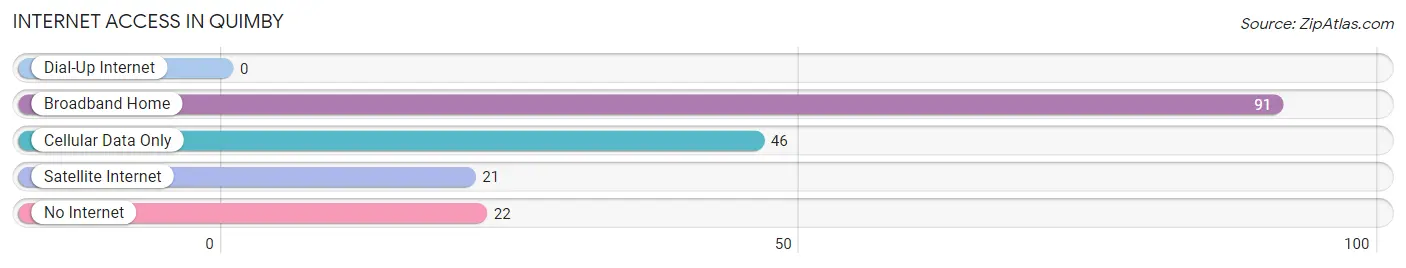
| Internet Type | # Households | % Households |
| Dial-Up Internet | 0 | 0.0% |
| Broadband Home | 91 | 53.5% |
| Cellular Data Only | 46 | 27.1% |
| Satellite Internet | 21 | 12.3% |
| No Internet | 22 | 12.9% |
| Total | 170 | 100.0% |
Quimby Summary
Quimby, Iowa is a small town located in the northwest corner of the state, in the county of Cherokee. It is situated on the banks of the Little Sioux River, and is surrounded by rolling hills and farmland. The town was founded in 1882, and has a population of just over 500 people.
Geographically, Quimby is located in the northwest corner of Iowa, in the county of Cherokee. It is situated on the banks of the Little Sioux River, and is surrounded by rolling hills and farmland. The town is located approximately 30 miles from the state capital of Des Moines, and is within easy driving distance of several larger cities, including Sioux City, Iowa City, and Omaha, Nebraska.
The economy of Quimby is largely based on agriculture. The town is home to several large farms, as well as a number of smaller family-owned operations. The town also has a few small businesses, including a grocery store, a hardware store, and a few restaurants. The town is also home to a small manufacturing plant, which produces a variety of products, including furniture and automotive parts.
The demographics of Quimby are largely homogeneous. The town is predominantly white, with a small minority population. The median household income is slightly below the state average, and the poverty rate is slightly higher than the state average. The town is also home to a large number of elderly residents, with nearly one-third of the population over the age of 65.
Quimby is a small, rural town with a rich history and a strong sense of community. The town is home to a number of historic buildings, including the Quimby Opera House, which was built in 1883. The town also has a number of parks and recreational areas, including the Quimby City Park, which features a playground, picnic areas, and a walking trail. The town also hosts a number of annual events, including the Quimby Days Festival, which celebrates the town’s history and culture.
Quimby is a small town with a big heart. The town is home to a tight-knit community of friendly people who take pride in their town and its history. The town is a great place to live, work, and raise a family, and is a great example of the rural Midwest.
Common Questions
What is Per Capita Income in Quimby?
Per Capita income in Quimby is $28,364.
What is the Median Family Income in Quimby?
Median Family Income in Quimby is $66,250.
What is the Median Household income in Quimby?
Median Household Income in Quimby is $57,500.
What is Income or Wage Gap in Quimby?
Income or Wage Gap in Quimby is 49.1%.
Women in Quimby earn 50.9 cents for every dollar earned by a man.
What is Inequality or Gini Index in Quimby?
Inequality or Gini Index in Quimby is 0.34.
What is the Total Population of Quimby?
Total Population of Quimby is 329.
What is the Total Male Population of Quimby?
Total Male Population of Quimby is 167.
What is the Total Female Population of Quimby?
Total Female Population of Quimby is 162.
What is the Ratio of Males per 100 Females in Quimby?
There are 103.09 Males per 100 Females in Quimby.
What is the Ratio of Females per 100 Males in Quimby?
There are 97.01 Females per 100 Males in Quimby.
What is the Median Population Age in Quimby?
Median Population Age in Quimby is 50.4 Years.
What is the Average Family Size in Quimby
Average Family Size in Quimby is 2.6 People.
What is the Average Household Size in Quimby
Average Household Size in Quimby is 1.9 People.
How Large is the Labor Force in Quimby?
There are 190 People in the Labor Forcein in Quimby.
What is the Percentage of People in the Labor Force in Quimby?
64.8% of People are in the Labor Force in Quimby.
What is the Unemployment Rate in Quimby?
Unemployment Rate in Quimby is 6.8%.