Mount Union, IA Map & Demographics
Mount Union Map
Mount Union Overview
$20,423
PER CAPITA INCOME
$51,250
AVG FAMILY INCOME
$50,750
AVG HOUSEHOLD INCOME
0.35
INEQUALITY / GINI INDEX
122
TOTAL POPULATION
64
MALE POPULATION
58
FEMALE POPULATION
110.34
MALES / 100 FEMALES
90.62
FEMALES / 100 MALES
37.0
MEDIAN AGE
4.2
AVG FAMILY SIZE
2.4
AVG HOUSEHOLD SIZE
50
LABOR FORCE [ PEOPLE ]
59.5%
PERCENT IN LABOR FORCE
Mount Union Zip Codes
Mount Union Area Codes
Income in Mount Union
Income Overview in Mount Union
Per Capita Income in Mount Union is $20,423, while median incomes of families and households are $51,250 and $50,750 respectively.
| Characteristic | Number | Measure |
| Per Capita Income | 122 | $20,423 |
| Median Family Income | 21 | $51,250 |
| Mean Family Income | 21 | $64,295 |
| Median Household Income | 51 | $50,750 |
| Mean Household Income | 51 | $50,876 |
| Income Deficit | 21 | $0 |
| Wage / Income Gap (%) | 122 | 0.00% |
| Wage / Income Gap ($) | 122 | 100.00¢ per $1 |
| Gini / Inequality Index | 122 | 0.35 |
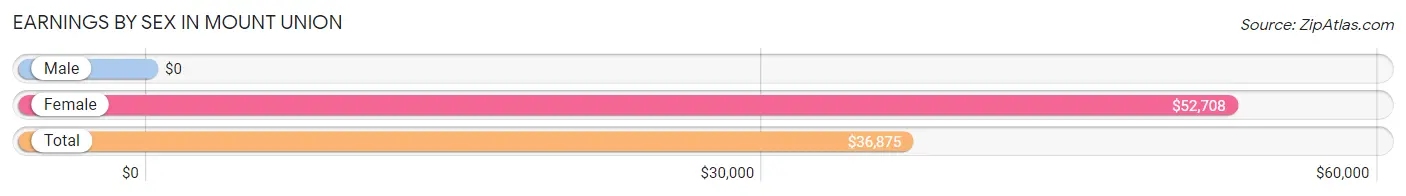
Earnings by Sex in Mount Union
| Sex | Number | Average Earnings |
| Male | 31 (56.4%) | $0 |
| Female | 24 (43.6%) | $52,708 |
| Total | 55 (100.0%) | $36,875 |
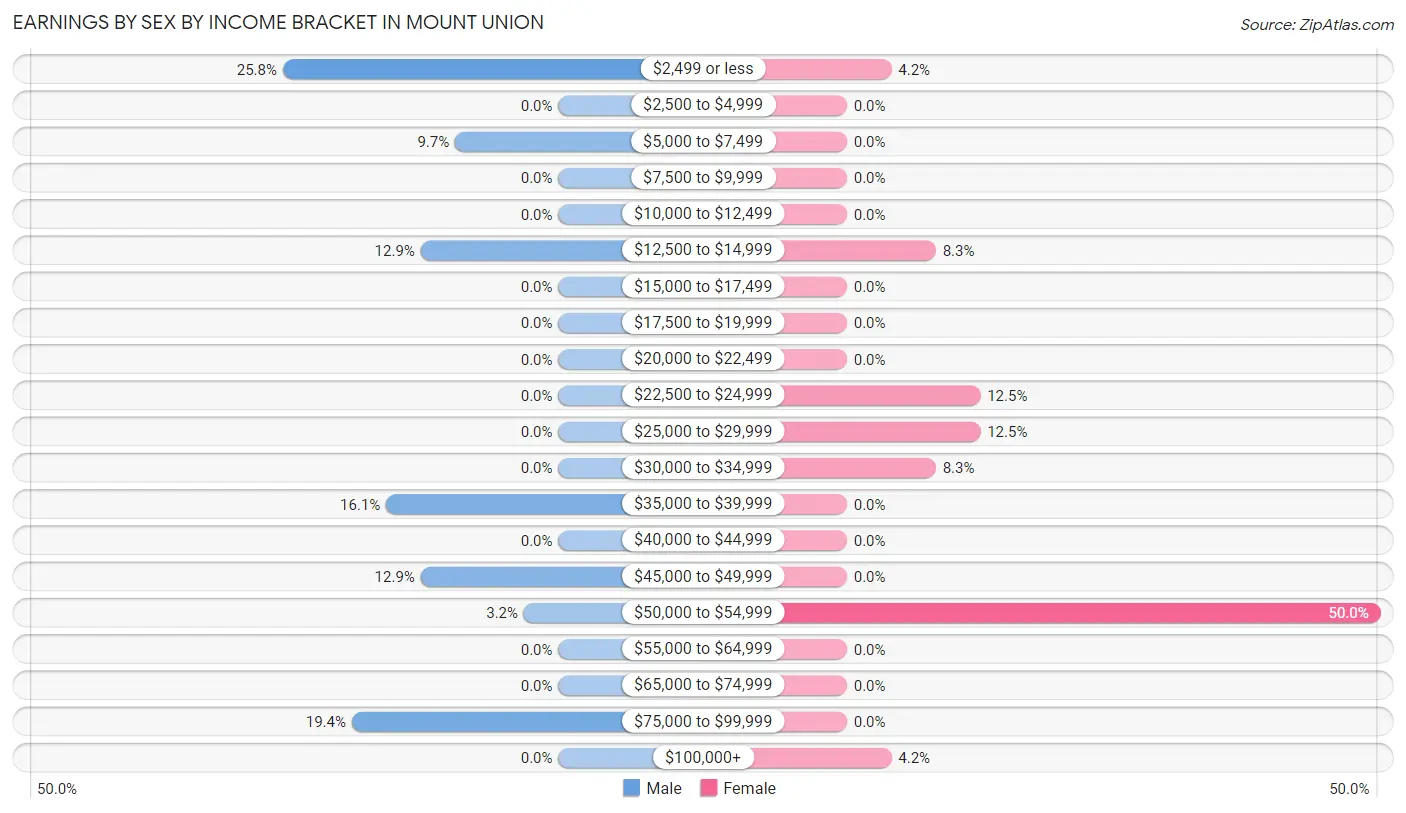
Earnings by Sex by Income Bracket in Mount Union
The most common earnings brackets in Mount Union are $2,499 or less for men (8 | 25.8%) and $50,000 to $54,999 for women (12 | 50.0%).
| Income | Male | Female |
| $2,499 or less | 8 (25.8%) | 1 (4.2%) |
| $2,500 to $4,999 | 0 (0.0%) | 0 (0.0%) |
| $5,000 to $7,499 | 3 (9.7%) | 0 (0.0%) |
| $7,500 to $9,999 | 0 (0.0%) | 0 (0.0%) |
| $10,000 to $12,499 | 0 (0.0%) | 0 (0.0%) |
| $12,500 to $14,999 | 4 (12.9%) | 2 (8.3%) |
| $15,000 to $17,499 | 0 (0.0%) | 0 (0.0%) |
| $17,500 to $19,999 | 0 (0.0%) | 0 (0.0%) |
| $20,000 to $22,499 | 0 (0.0%) | 0 (0.0%) |
| $22,500 to $24,999 | 0 (0.0%) | 3 (12.5%) |
| $25,000 to $29,999 | 0 (0.0%) | 3 (12.5%) |
| $30,000 to $34,999 | 0 (0.0%) | 2 (8.3%) |
| $35,000 to $39,999 | 5 (16.1%) | 0 (0.0%) |
| $40,000 to $44,999 | 0 (0.0%) | 0 (0.0%) |
| $45,000 to $49,999 | 4 (12.9%) | 0 (0.0%) |
| $50,000 to $54,999 | 1 (3.2%) | 12 (50.0%) |
| $55,000 to $64,999 | 0 (0.0%) | 0 (0.0%) |
| $65,000 to $74,999 | 0 (0.0%) | 0 (0.0%) |
| $75,000 to $99,999 | 6 (19.4%) | 0 (0.0%) |
| $100,000+ | 0 (0.0%) | 1 (4.2%) |
| Total | 31 (100.0%) | 24 (100.0%) |
Earnings by Sex by Educational Attainment in Mount Union
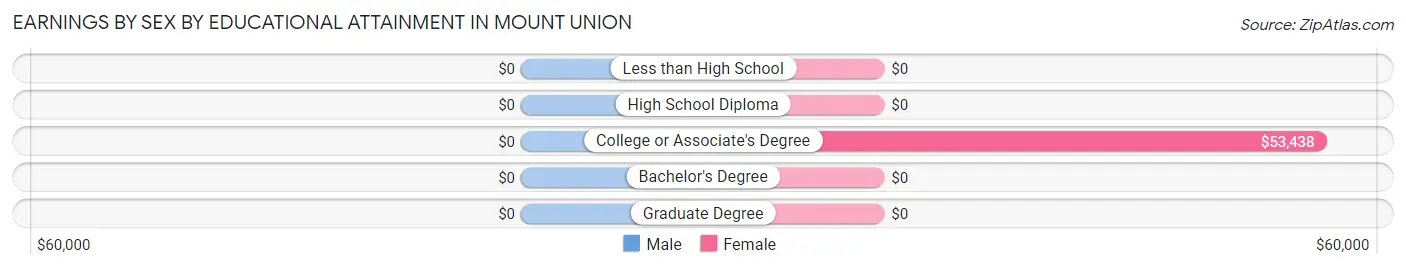
| Educational Attainment | Male Income | Female Income |
| Less than High School | - | - |
| High School Diploma | - | - |
| College or Associate's Degree | - | - |
| Bachelor's Degree | - | - |
| Graduate Degree | - | - |
| Total | $39,583 | $53,021 |
Family Income in Mount Union
Family Income Brackets in Mount Union
According to the Mount Union family income data, there are 6 families falling into the $100,000 to $149,999 income range, which is the most common income bracket and makes up 28.6% of all families.
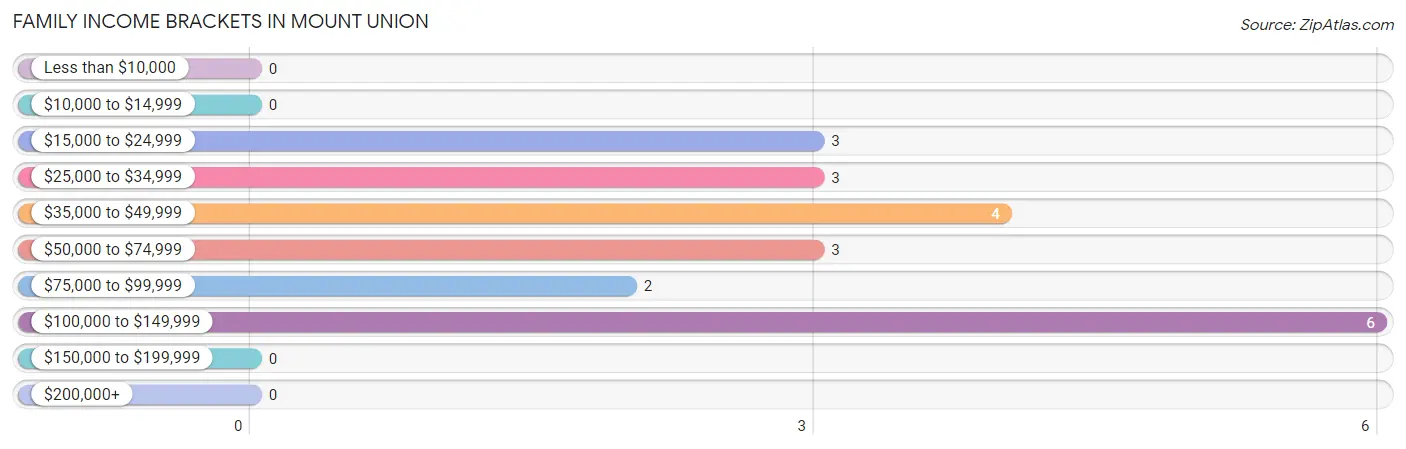
| Income Bracket | # Families | % Families |
| Less than $10,000 | 0 | 0.0% |
| $10,000 to $14,999 | 0 | 0.0% |
| $15,000 to $24,999 | 3 | 14.3% |
| $25,000 to $34,999 | 3 | 14.3% |
| $35,000 to $49,999 | 4 | 19.0% |
| $50,000 to $74,999 | 3 | 14.3% |
| $75,000 to $99,999 | 2 | 9.5% |
| $100,000 to $149,999 | 6 | 28.6% |
| $150,000 to $199,999 | 0 | 0.0% |
| $200,000+ | 0 | 0.0% |
Family Income by Famaliy Size in Mount Union
4-person families (8 | 38.1%) account for the highest median family income in Mount Union with $115,500 per family, while 4-person families (8 | 38.1%) have the highest median income of $28,875 per family member.
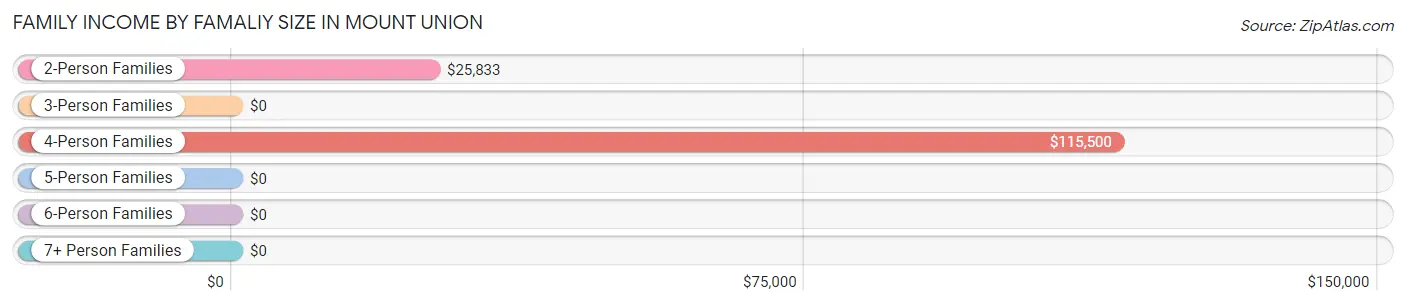
| Income Bracket | # Families | Median Income |
| 2-Person Families | 8 (38.1%) | $25,833 |
| 3-Person Families | 1 (4.8%) | $0 |
| 4-Person Families | 8 (38.1%) | $115,500 |
| 5-Person Families | 0 (0.0%) | $0 |
| 6-Person Families | 3 (14.3%) | $0 |
| 7+ Person Families | 1 (4.8%) | $0 |
| Total | 21 (100.0%) | $51,250 |
Family Income by Number of Earners in Mount Union
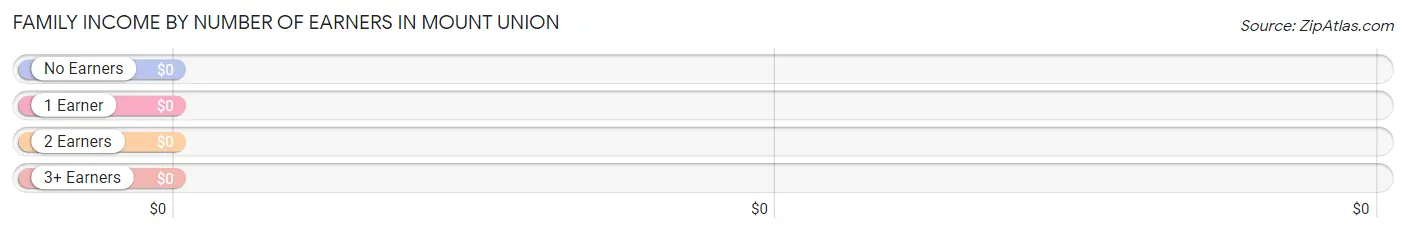
| Number of Earners | # Families | Median Income |
| No Earners | 6 (28.6%) | $0 |
| 1 Earner | 6 (28.6%) | $0 |
| 2 Earners | 3 (14.3%) | $0 |
| 3+ Earners | 6 (28.6%) | $0 |
| Total | 21 (100.0%) | $51,250 |
Household Income in Mount Union
Household Income Brackets in Mount Union
With 19 households falling in the category, the $50,000 to $74,999 income range is the most frequent in Mount Union, accounting for 37.2% of all households.
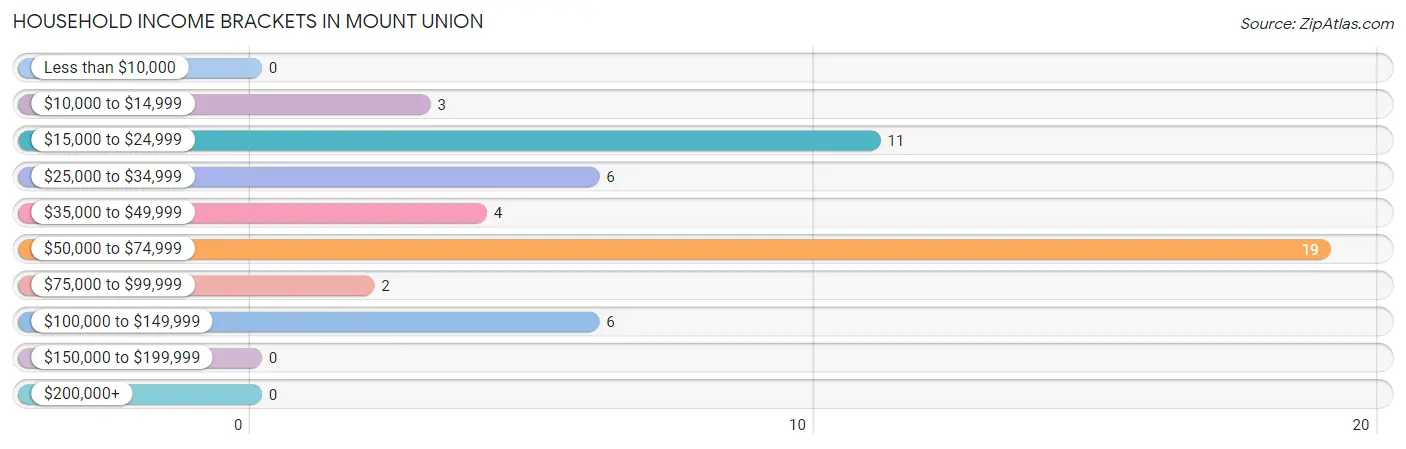
| Income Bracket | # Households | % Households |
| Less than $10,000 | 0 | 0.0% |
| $10,000 to $14,999 | 3 | 5.9% |
| $15,000 to $24,999 | 11 | 21.6% |
| $25,000 to $34,999 | 6 | 11.8% |
| $35,000 to $49,999 | 4 | 7.8% |
| $50,000 to $74,999 | 19 | 37.3% |
| $75,000 to $99,999 | 2 | 3.9% |
| $100,000 to $149,999 | 6 | 11.8% |
| $150,000 to $199,999 | 0 | 0.0% |
| $200,000+ | 0 | 0.0% |
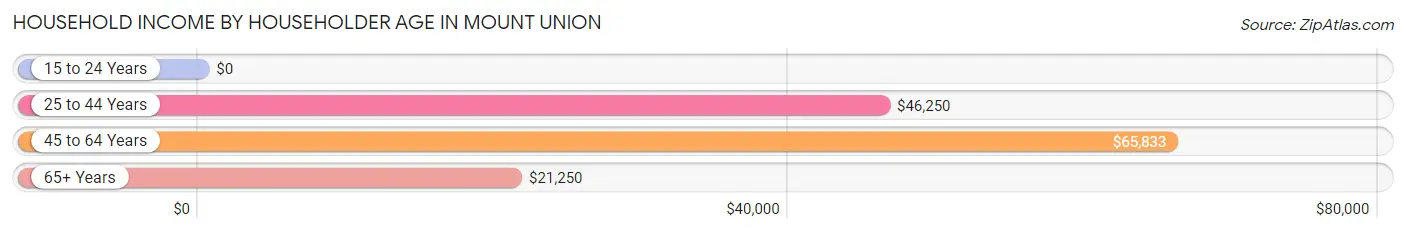
Household Income by Householder Age in Mount Union
The median household income in Mount Union is $50,750, with the highest median household income of $65,833 found in the 45 to 64 years age bracket for the primary householder. A total of 28 households (54.9%) fall into this category.
| Income Bracket | # Households | Median Income |
| 15 to 24 Years | 0 (0.0%) | $0 |
| 25 to 44 Years | 7 (13.7%) | $46,250 |
| 45 to 64 Years | 28 (54.9%) | $65,833 |
| 65+ Years | 16 (31.4%) | $21,250 |
| Total | 51 (100.0%) | $50,750 |
Poverty in Mount Union
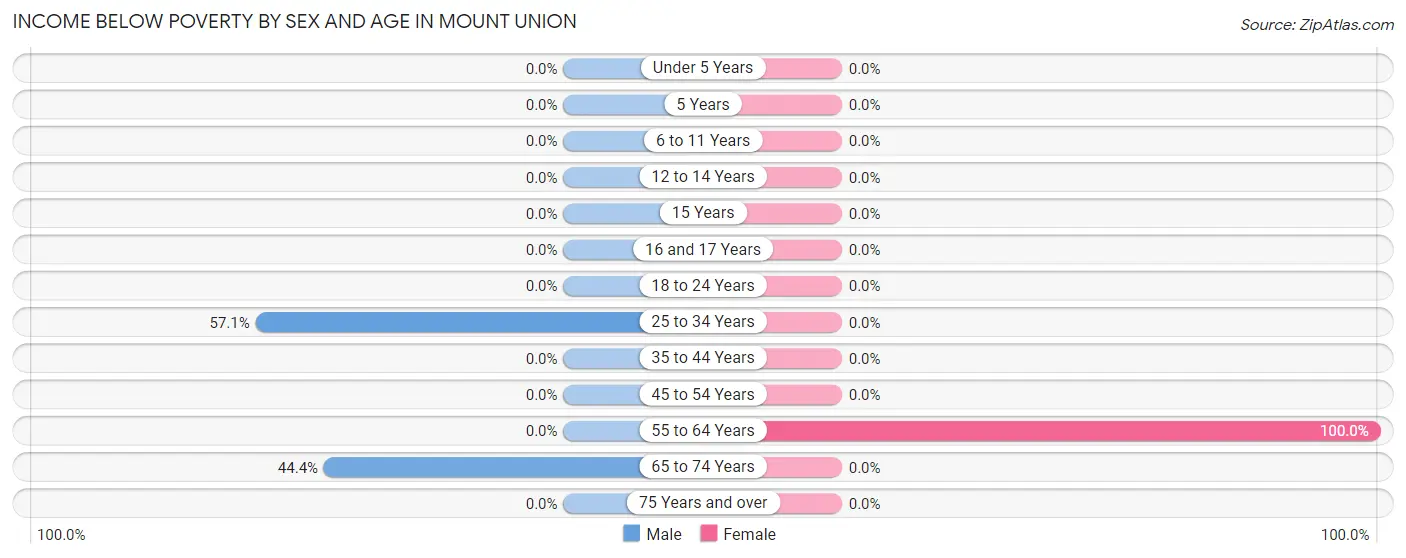
Income Below Poverty by Sex and Age in Mount Union
With 12.5% poverty level for males and 10.3% for females among the residents of Mount Union, 25 to 34 year old males and 55 to 64 year old females are the most vulnerable to poverty, with 4 males (57.1%) and 6 females (100.0%) in their respective age groups living below the poverty level.
| Age Bracket | Male | Female |
| Under 5 Years | 0 (0.0%) | 0 (0.0%) |
| 5 Years | 0 (0.0%) | 0 (0.0%) |
| 6 to 11 Years | 0 (0.0%) | 0 (0.0%) |
| 12 to 14 Years | 0 (0.0%) | 0 (0.0%) |
| 15 Years | 0 (0.0%) | 0 (0.0%) |
| 16 and 17 Years | 0 (0.0%) | 0 (0.0%) |
| 18 to 24 Years | 0 (0.0%) | 0 (0.0%) |
| 25 to 34 Years | 4 (57.1%) | 0 (0.0%) |
| 35 to 44 Years | 0 (0.0%) | 0 (0.0%) |
| 45 to 54 Years | 0 (0.0%) | 0 (0.0%) |
| 55 to 64 Years | 0 (0.0%) | 6 (100.0%) |
| 65 to 74 Years | 4 (44.4%) | 0 (0.0%) |
| 75 Years and over | 0 (0.0%) | 0 (0.0%) |
| Total | 8 (12.5%) | 6 (10.3%) |
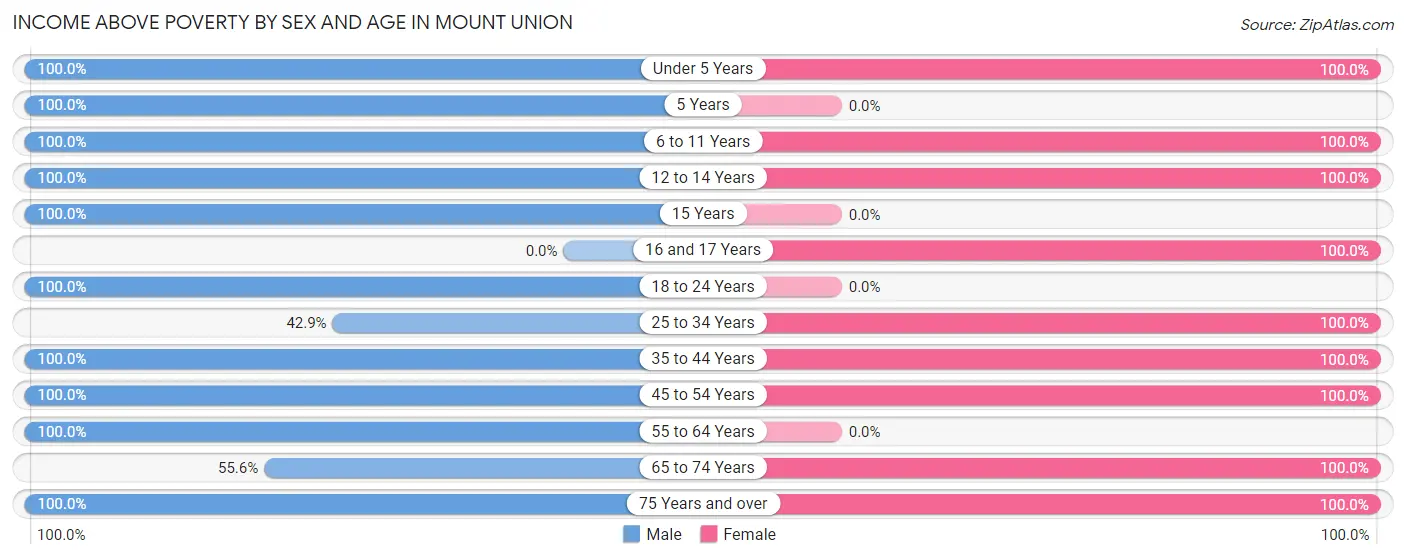
Income Above Poverty by Sex and Age in Mount Union
According to the poverty statistics in Mount Union, males aged under 5 years and females aged under 5 years are the age groups that are most secure financially, with 100.0% of males and 100.0% of females in these age groups living above the poverty line.
| Age Bracket | Male | Female |
| Under 5 Years | 6 (100.0%) | 2 (100.0%) |
| 5 Years | 4 (100.0%) | 0 (0.0%) |
| 6 to 11 Years | 6 (100.0%) | 8 (100.0%) |
| 12 to 14 Years | 1 (100.0%) | 4 (100.0%) |
| 15 Years | 7 (100.0%) | 0 (0.0%) |
| 16 and 17 Years | 0 (0.0%) | 3 (100.0%) |
| 18 to 24 Years | 8 (100.0%) | 0 (0.0%) |
| 25 to 34 Years | 3 (42.9%) | 2 (100.0%) |
| 35 to 44 Years | 3 (100.0%) | 7 (100.0%) |
| 45 to 54 Years | 6 (100.0%) | 13 (100.0%) |
| 55 to 64 Years | 4 (100.0%) | 0 (0.0%) |
| 65 to 74 Years | 5 (55.6%) | 5 (100.0%) |
| 75 Years and over | 3 (100.0%) | 8 (100.0%) |
| Total | 56 (87.5%) | 52 (89.7%) |
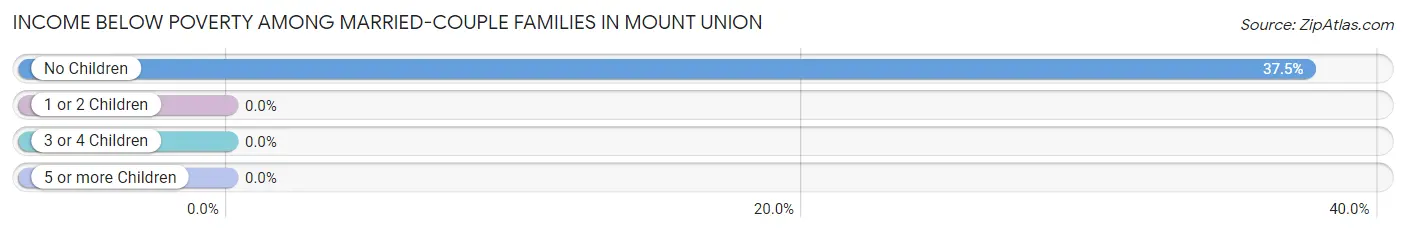
Income Below Poverty Among Married-Couple Families in Mount Union
The poverty statistics for married-couple families in Mount Union show that 15.8% or 3 of the total 19 families live below the poverty line. Families with no children have the highest poverty rate of 37.5%, comprising of 3 families. On the other hand, families with 1 or 2 children have the lowest poverty rate of 0.0%, which includes 0 families.
| Children | Above Poverty | Below Poverty |
| No Children | 5 (62.5%) | 3 (37.5%) |
| 1 or 2 Children | 8 (100.0%) | 0 (0.0%) |
| 3 or 4 Children | 3 (100.0%) | 0 (0.0%) |
| 5 or more Children | 0 (0.0%) | 0 (0.0%) |
| Total | 16 (84.2%) | 3 (15.8%) |
Income Below Poverty Among Single-Parent Households in Mount Union
| Children | Single Father | Single Mother |
| No Children | 0 (0.0%) | 0 (0.0%) |
| 1 or 2 Children | 0 (0.0%) | 0 (0.0%) |
| 3 or 4 Children | 0 (0.0%) | 0 (0.0%) |
| 5 or more Children | 0 (0.0%) | 0 (0.0%) |
| Total | 0 (0.0%) | 0 (0.0%) |
Income Below Poverty Among Married-Couple vs Single-Parent Households in Mount Union
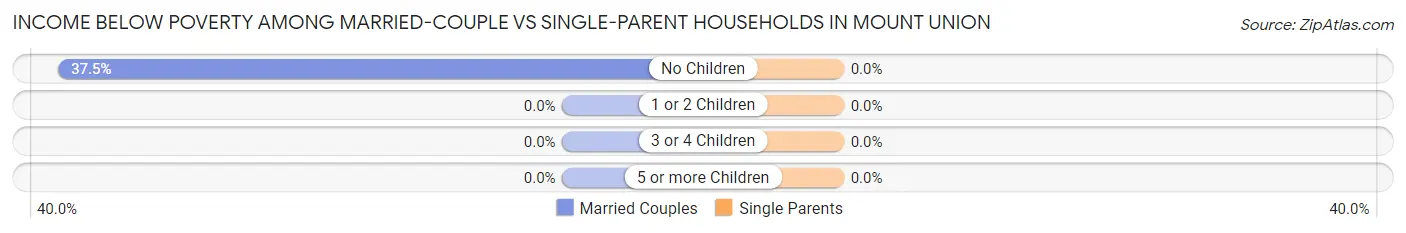
| Children | Married-Couple Families | Single-Parent Households |
| No Children | 3 (37.5%) | 0 (0.0%) |
| 1 or 2 Children | 0 (0.0%) | 0 (0.0%) |
| 3 or 4 Children | 0 (0.0%) | 0 (0.0%) |
| 5 or more Children | 0 (0.0%) | 0 (0.0%) |
| Total | 3 (15.8%) | 0 (0.0%) |
Race in Mount Union
The most populous races in Mount Union are , and White / Caucasian (122 | 100.0%).
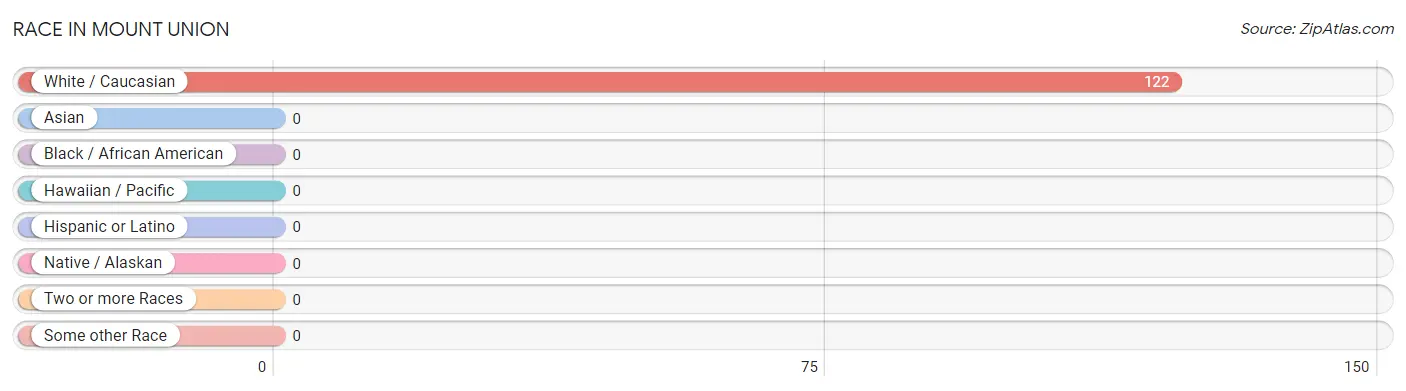
| Race | # Population | % Population |
| Asian | 0 | 0.0% |
| Black / African American | 0 | 0.0% |
| Hawaiian / Pacific | 0 | 0.0% |
| Hispanic or Latino | 0 | 0.0% |
| Native / Alaskan | 0 | 0.0% |
| White / Caucasian | 122 | 100.0% |
| Two or more Races | 0 | 0.0% |
| Some other Race | 0 | 0.0% |
| Total | 122 | 100.0% |
Ancestry in Mount Union
The most populous ancestries reported in Mount Union are German (29 | 23.8%), Swedish (10 | 8.2%), Norwegian (8 | 6.6%), Irish (5 | 4.1%), and English (4 | 3.3%), together accounting for 45.9% of all Mount Union residents.
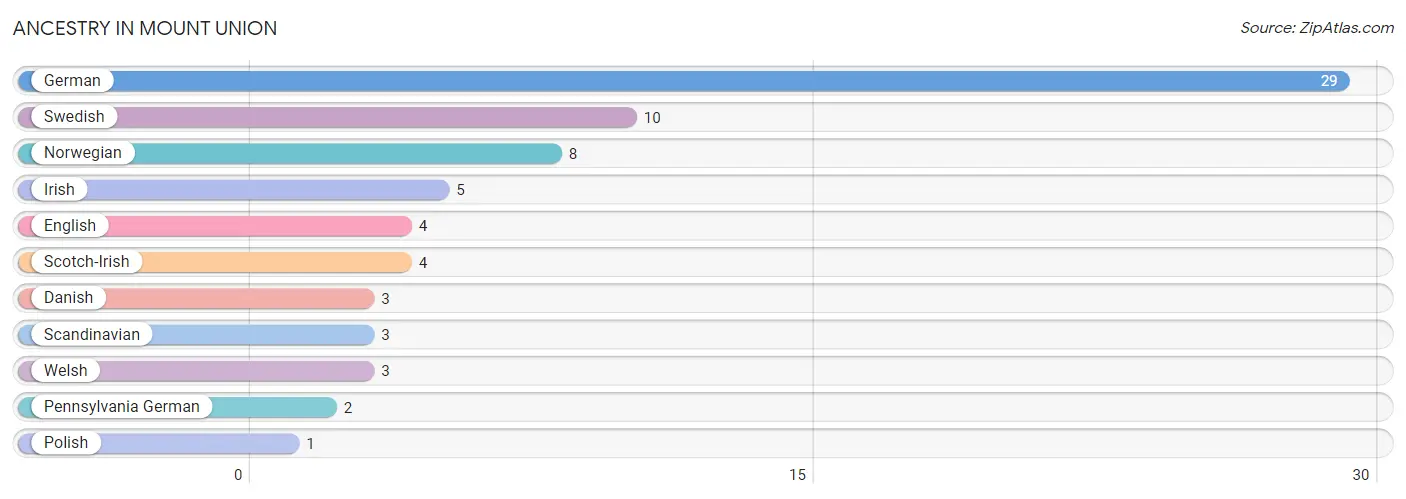
| Ancestry | # Population | % Population |
| Danish | 3 | 2.5% |
| English | 4 | 3.3% |
| German | 29 | 23.8% |
| Irish | 5 | 4.1% |
| Norwegian | 8 | 6.6% |
| Pennsylvania German | 2 | 1.6% |
| Polish | 1 | 0.8% |
| Scandinavian | 3 | 2.5% |
| Scotch-Irish | 4 | 3.3% |
| Swedish | 10 | 8.2% |
| Welsh | 3 | 2.5% | View All 11 Rows |
Immigrants in Mount Union

| Immigration Origin | # Population | % Population | View All 0 Rows |
Sex and Age in Mount Union
Sex and Age in Mount Union
The most populous age groups in Mount Union are 15 to 19 Years (15 | 23.4%) for men and 45 to 49 Years (13 | 22.4%) for women.
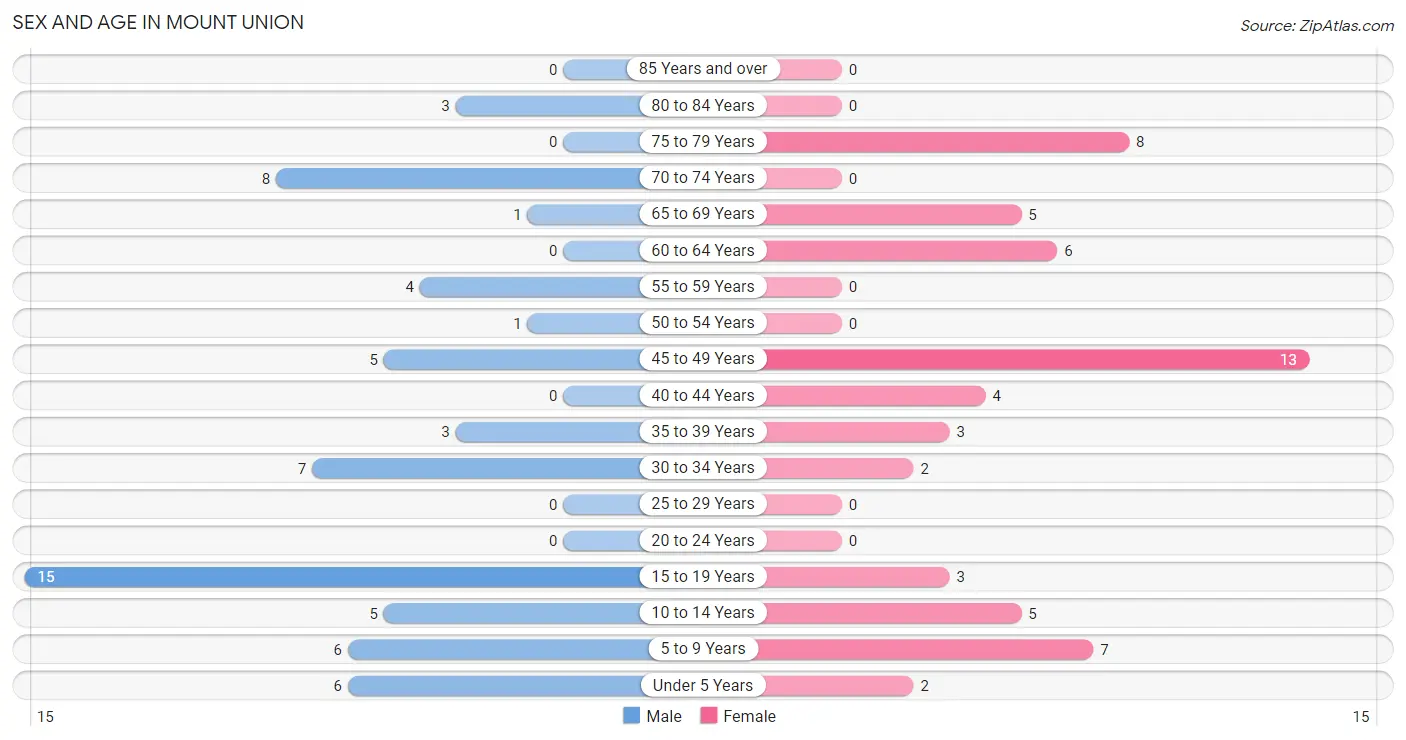
| Age Bracket | Male | Female |
| Under 5 Years | 6 (9.4%) | 2 (3.5%) |
| 5 to 9 Years | 6 (9.4%) | 7 (12.1%) |
| 10 to 14 Years | 5 (7.8%) | 5 (8.6%) |
| 15 to 19 Years | 15 (23.4%) | 3 (5.2%) |
| 20 to 24 Years | 0 (0.0%) | 0 (0.0%) |
| 25 to 29 Years | 0 (0.0%) | 0 (0.0%) |
| 30 to 34 Years | 7 (10.9%) | 2 (3.5%) |
| 35 to 39 Years | 3 (4.7%) | 3 (5.2%) |
| 40 to 44 Years | 0 (0.0%) | 4 (6.9%) |
| 45 to 49 Years | 5 (7.8%) | 13 (22.4%) |
| 50 to 54 Years | 1 (1.6%) | 0 (0.0%) |
| 55 to 59 Years | 4 (6.2%) | 0 (0.0%) |
| 60 to 64 Years | 0 (0.0%) | 6 (10.3%) |
| 65 to 69 Years | 1 (1.6%) | 5 (8.6%) |
| 70 to 74 Years | 8 (12.5%) | 0 (0.0%) |
| 75 to 79 Years | 0 (0.0%) | 8 (13.8%) |
| 80 to 84 Years | 3 (4.7%) | 0 (0.0%) |
| 85 Years and over | 0 (0.0%) | 0 (0.0%) |
| Total | 64 (100.0%) | 58 (100.0%) |
Families and Households in Mount Union
Median Family Size in Mount Union
The median family size in Mount Union is 4.19 persons per family, with single female/mother families (1 | 4.8%) accounting for the largest median family size of 12 persons per family. On the other hand, married-couple families (19 | 90.5%) represent the smallest median family size with 3.79 persons per family.
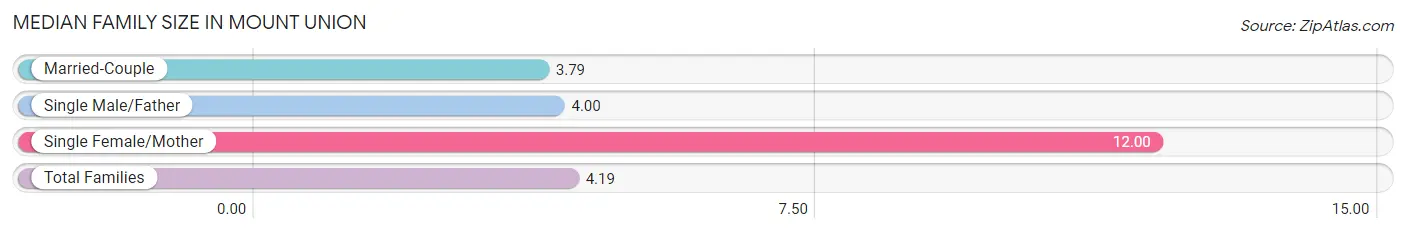
| Family Type | # Families | Family Size |
| Married-Couple | 19 (90.5%) | 3.79 |
| Single Male/Father | 1 (4.8%) | 4.00 |
| Single Female/Mother | 1 (4.8%) | 12.00 |
| Total Families | 21 (100.0%) | 4.19 |
Median Household Size in Mount Union
The median household size in Mount Union is 2.39 persons per household, with single female/mother households (1 | 2.0%) accounting for the largest median household size of 12 persons per household. non-family households (30 | 58.8%) represent the smallest median household size with 1.13 persons per household.
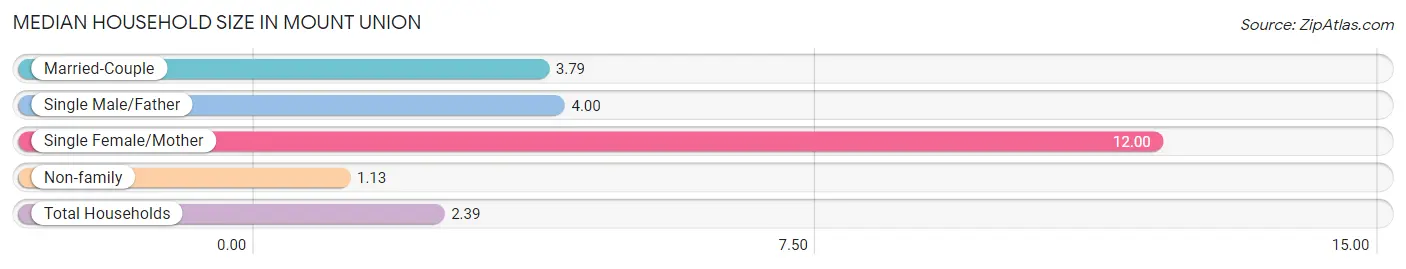
| Household Type | # Households | Household Size |
| Married-Couple | 19 (37.2%) | 3.79 |
| Single Male/Father | 1 (2.0%) | 4.00 |
| Single Female/Mother | 1 (2.0%) | 12.00 |
| Non-family | 30 (58.8%) | 1.13 |
| Total Households | 51 (100.0%) | 2.39 |
Household Size by Marriage Status in Mount Union
Out of a total of 51 households in Mount Union, 21 (41.2%) are family households, while 30 (58.8%) are nonfamily households. The most numerous type of family households are 2-person households, comprising 8, and the most common type of nonfamily households are 1-person households, comprising 18.
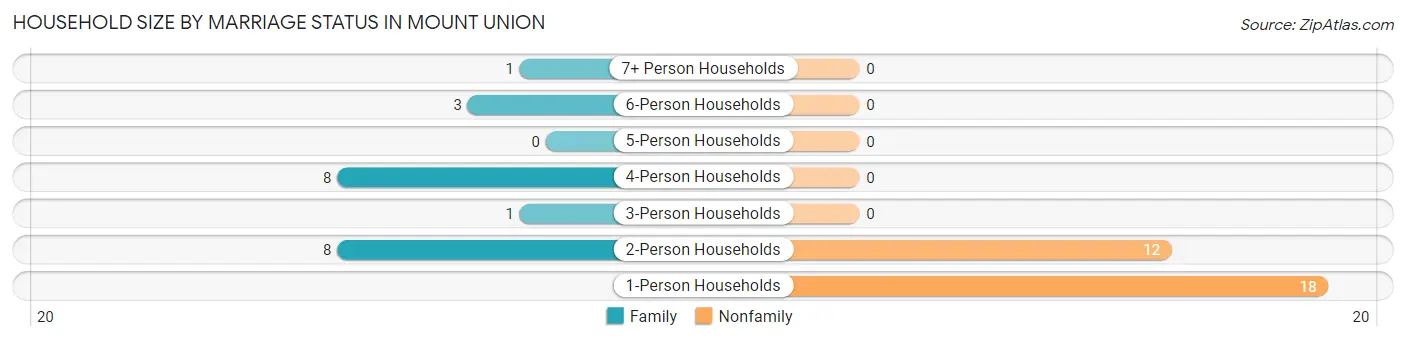
| Household Size | Family Households | Nonfamily Households |
| 1-Person Households | - | 18 (35.3%) |
| 2-Person Households | 8 (15.7%) | 12 (23.5%) |
| 3-Person Households | 1 (2.0%) | 0 (0.0%) |
| 4-Person Households | 8 (15.7%) | 0 (0.0%) |
| 5-Person Households | 0 (0.0%) | 0 (0.0%) |
| 6-Person Households | 3 (5.9%) | 0 (0.0%) |
| 7+ Person Households | 1 (2.0%) | 0 (0.0%) |
| Total | 21 (41.2%) | 30 (58.8%) |
Female Fertility in Mount Union
Fertility by Age in Mount Union
Average fertility rate in Mount Union is 80.0 births per 1,000 women. Women in the age bracket of 20 to 34 years have the highest fertility rate with 1,000.0 births per 1,000 women. Women in the age bracket of 20 to 34 years acount for 100.0% of all women with births.
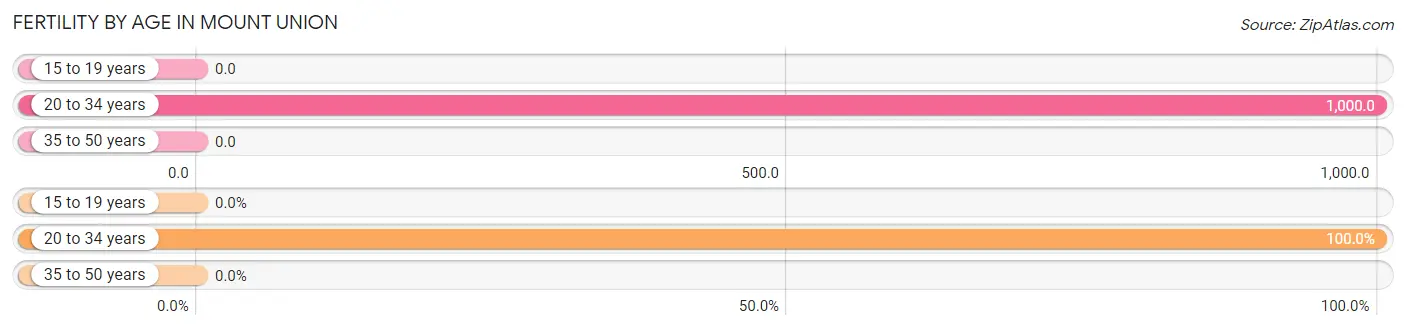
| Age Bracket | Women with Births | Births / 1,000 Women |
| 15 to 19 years | 0 (0.0%) | 0.0 |
| 20 to 34 years | 2 (100.0%) | 1,000.0 |
| 35 to 50 years | 0 (0.0%) | 0.0 |
| Total | 2 (100.0%) | 80.0 |
Fertility by Age by Marriage Status in Mount Union
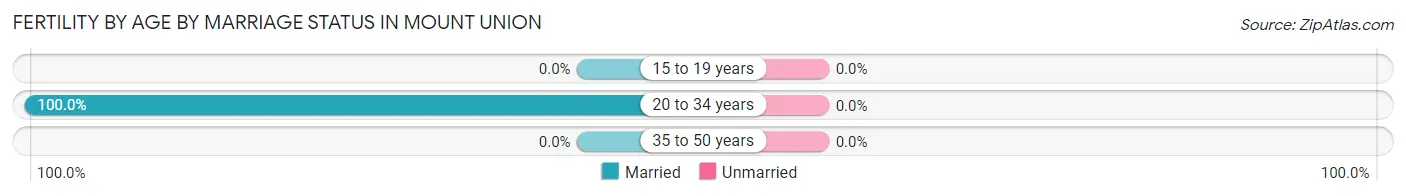
| Age Bracket | Married | Unmarried |
| 15 to 19 years | 0 (0.0%) | 0 (0.0%) |
| 20 to 34 years | 2 (100.0%) | 0 (0.0%) |
| 35 to 50 years | 0 (0.0%) | 0 (0.0%) |
| Total | 2 (100.0%) | 0 (0.0%) |
Fertility by Education in Mount Union
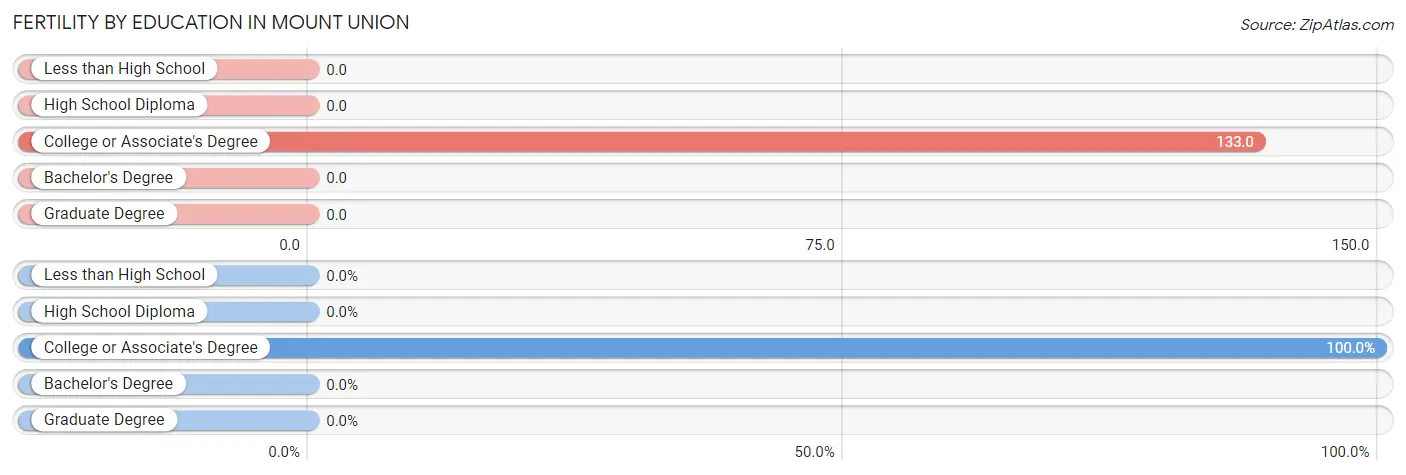
| Educational Attainment | Women with Births | Births / 1,000 Women |
| Less than High School | 0 (0.0%) | 0.0 |
| High School Diploma | 0 (0.0%) | 0.0 |
| College or Associate's Degree | 2 (100.0%) | 133.0 |
| Bachelor's Degree | 0 (0.0%) | 0.0 |
| Graduate Degree | 0 (0.0%) | 0.0 |
| Total | 2 (100.0%) | 80.0 |
Fertility by Education by Marriage Status in Mount Union
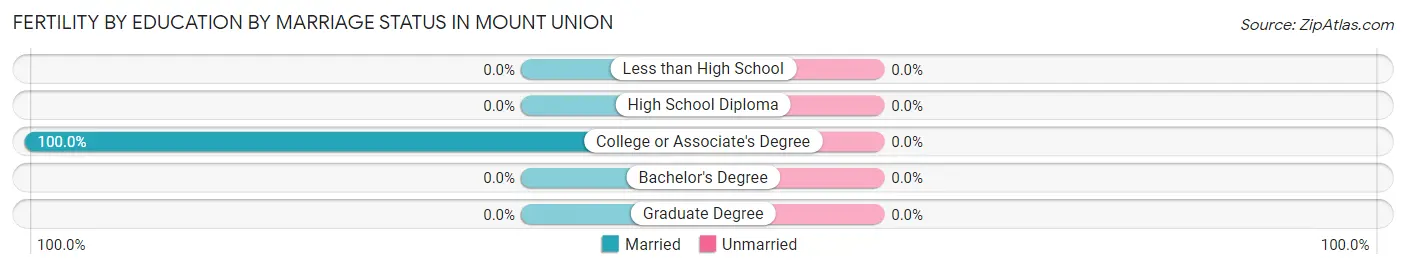
| Educational Attainment | Married | Unmarried |
| Less than High School | 0 (0.0%) | 0 (0.0%) |
| High School Diploma | 0 (0.0%) | 0 (0.0%) |
| College or Associate's Degree | 2 (100.0%) | 0 (0.0%) |
| Bachelor's Degree | 0 (0.0%) | 0 (0.0%) |
| Graduate Degree | 0 (0.0%) | 0 (0.0%) |
| Total | 2 (100.0%) | 0 (0.0%) |
Employment Characteristics in Mount Union
Employment by Class of Employer in Mount Union
Among the 50 employed individuals in Mount Union, private company employees (37 | 74.0%), state government employees (12 | 24.0%), and not-for-profit organizations (1 | 2.0%) make up the most common classes of employment.
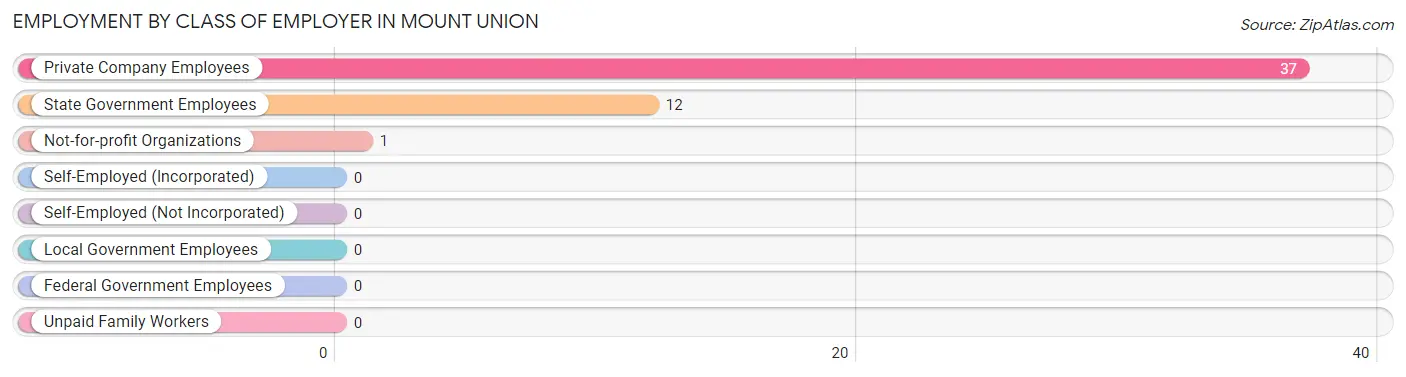
| Employer Class | # Employees | % Employees |
| Private Company Employees | 37 | 74.0% |
| Self-Employed (Incorporated) | 0 | 0.0% |
| Self-Employed (Not Incorporated) | 0 | 0.0% |
| Not-for-profit Organizations | 1 | 2.0% |
| Local Government Employees | 0 | 0.0% |
| State Government Employees | 12 | 24.0% |
| Federal Government Employees | 0 | 0.0% |
| Unpaid Family Workers | 0 | 0.0% |
| Total | 50 | 100.0% |
Employment Status by Age in Mount Union
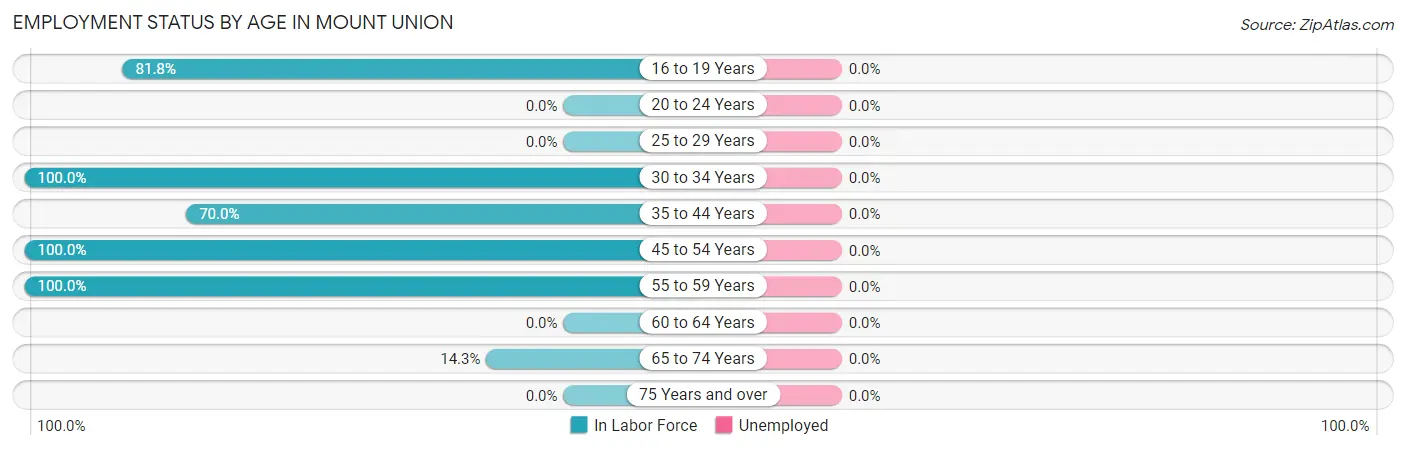
| Age Bracket | In Labor Force | Unemployed |
| 16 to 19 Years | 9 (81.8%) | 0 (0.0%) |
| 20 to 24 Years | 0 (0.0%) | 0 (0.0%) |
| 25 to 29 Years | 0 (0.0%) | 0 (0.0%) |
| 30 to 34 Years | 9 (100.0%) | 0 (0.0%) |
| 35 to 44 Years | 7 (70.0%) | 0 (0.0%) |
| 45 to 54 Years | 19 (100.0%) | 0 (0.0%) |
| 55 to 59 Years | 4 (100.0%) | 0 (0.0%) |
| 60 to 64 Years | 0 (0.0%) | 0 (0.0%) |
| 65 to 74 Years | 2 (14.3%) | 0 (0.0%) |
| 75 Years and over | 0 (0.0%) | 0 (0.0%) |
| Total | 50 (59.5%) | 0 (0.0%) |
Employment Status by Educational Attainment in Mount Union
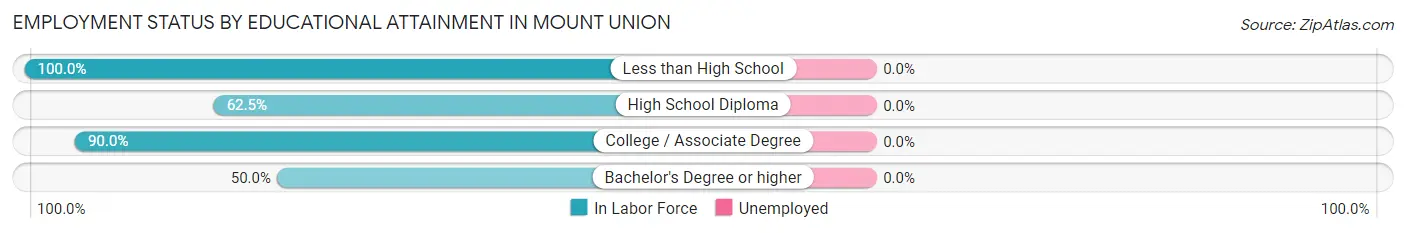
| Educational Attainment | In Labor Force | Unemployed |
| Less than High School | 4 (100.0%) | 0 (0.0%) |
| High School Diploma | 5 (62.5%) | 0 (0.0%) |
| College / Associate Degree | 27 (90.0%) | 0 (0.0%) |
| Bachelor's Degree or higher | 3 (50.0%) | 0 (0.0%) |
| Total | 39 (81.3%) | 0 (0.0%) |
Employment Occupations by Sex in Mount Union
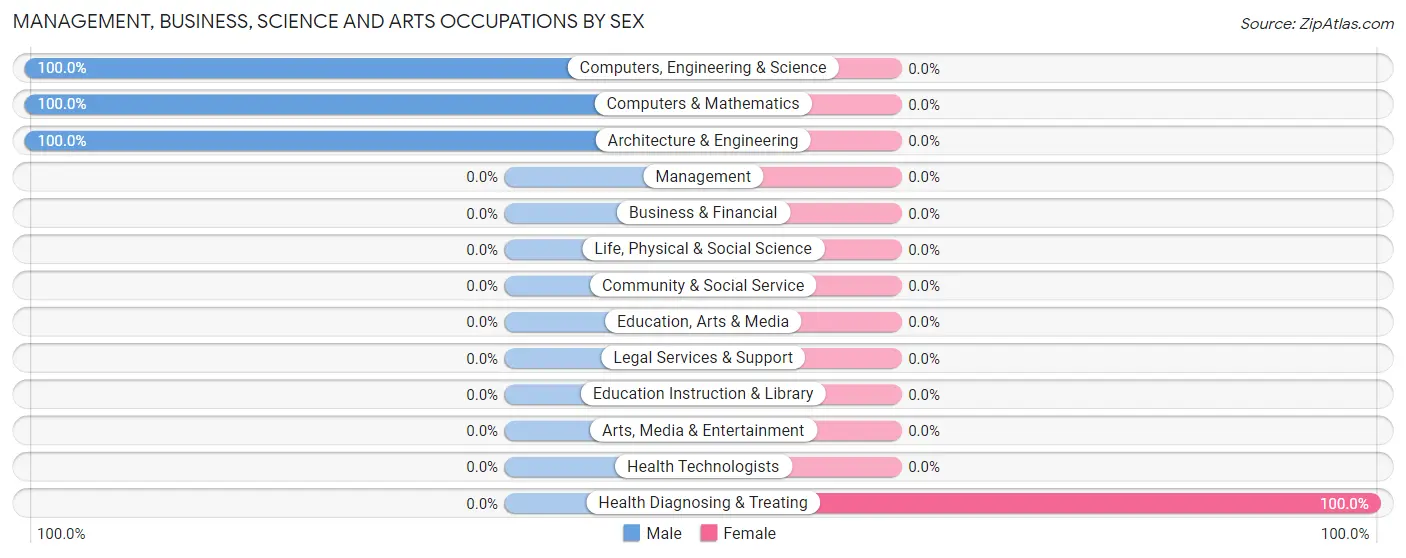
Management, Business, Science and Arts Occupations
The most common Management, Business, Science and Arts occupations in Mount Union are Health Diagnosing & Treating (12 | 24.0%), Computers, Engineering & Science (6 | 12.0%), Architecture & Engineering (5 | 10.0%), and Computers & Mathematics (1 | 2.0%).
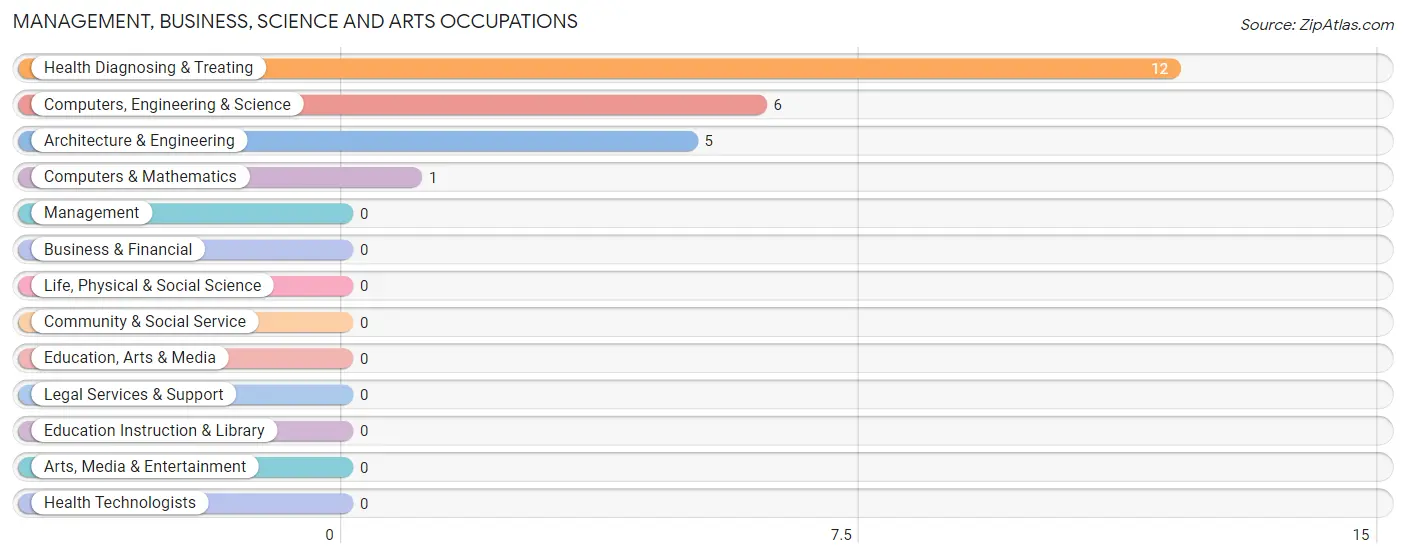
Management, Business, Science and Arts Occupations by Sex
| Occupation | Male | Female |
| Management | 0 (0.0%) | 0 (0.0%) |
| Business & Financial | 0 (0.0%) | 0 (0.0%) |
| Computers, Engineering & Science | 6 (100.0%) | 0 (0.0%) |
| Computers & Mathematics | 1 (100.0%) | 0 (0.0%) |
| Architecture & Engineering | 5 (100.0%) | 0 (0.0%) |
| Life, Physical & Social Science | 0 (0.0%) | 0 (0.0%) |
| Community & Social Service | 0 (0.0%) | 0 (0.0%) |
| Education, Arts & Media | 0 (0.0%) | 0 (0.0%) |
| Legal Services & Support | 0 (0.0%) | 0 (0.0%) |
| Education Instruction & Library | 0 (0.0%) | 0 (0.0%) |
| Arts, Media & Entertainment | 0 (0.0%) | 0 (0.0%) |
| Health Diagnosing & Treating | 0 (0.0%) | 12 (100.0%) |
| Health Technologists | 0 (0.0%) | 0 (0.0%) |
| Total (Category) | 6 (33.3%) | 12 (66.7%) |
| Total (Overall) | 28 (56.0%) | 22 (44.0%) |
Services Occupations
The most common Services occupations in Mount Union are , and Food Preparation & Serving (1 | 2.0%).
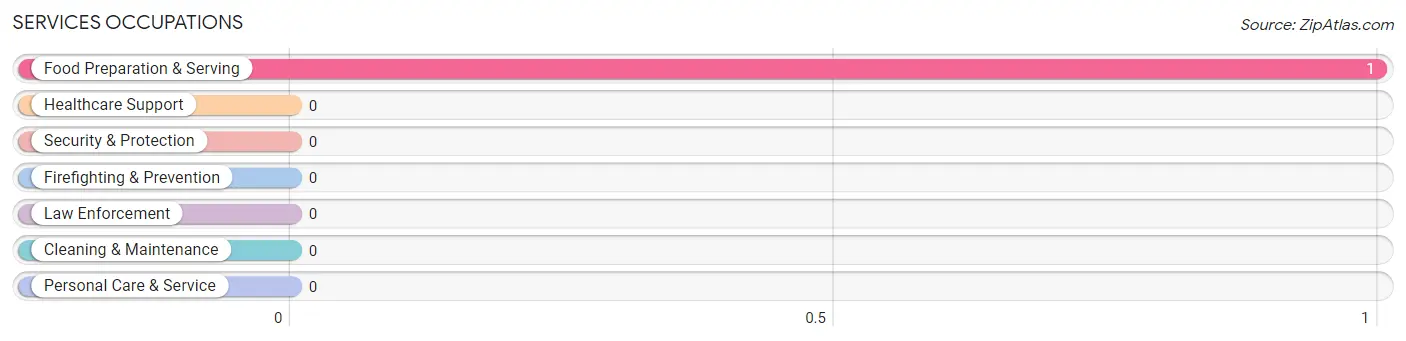
Services Occupations by Sex
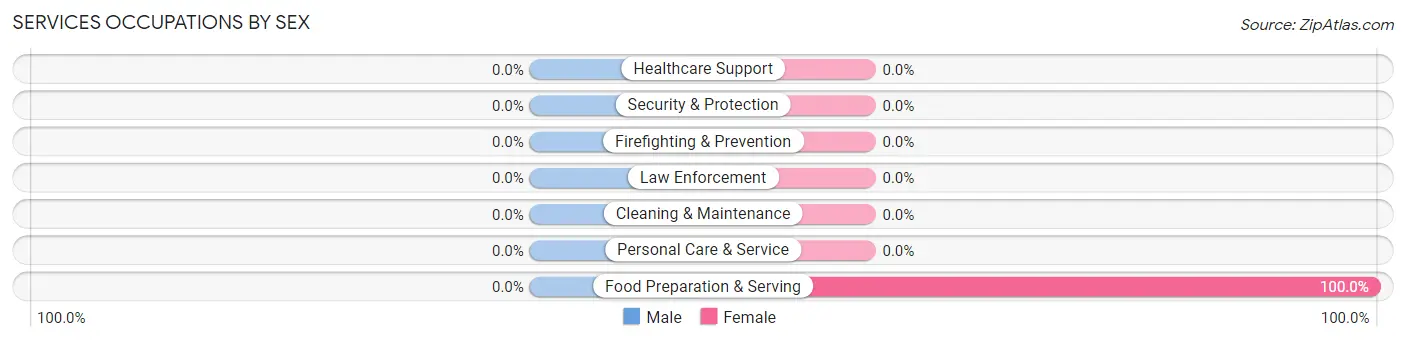
| Occupation | Male | Female |
| Healthcare Support | 0 (0.0%) | 0 (0.0%) |
| Security & Protection | 0 (0.0%) | 0 (0.0%) |
| Firefighting & Prevention | 0 (0.0%) | 0 (0.0%) |
| Law Enforcement | 0 (0.0%) | 0 (0.0%) |
| Food Preparation & Serving | 0 (0.0%) | 1 (100.0%) |
| Cleaning & Maintenance | 0 (0.0%) | 0 (0.0%) |
| Personal Care & Service | 0 (0.0%) | 0 (0.0%) |
| Total (Category) | 0 (0.0%) | 1 (100.0%) |
| Total (Overall) | 28 (56.0%) | 22 (44.0%) |
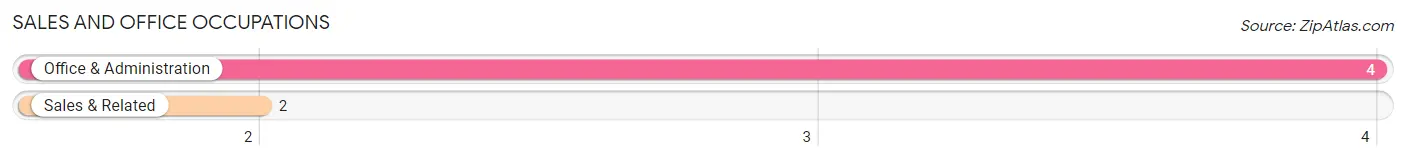
Sales and Office Occupations
The most common Sales and Office occupations in Mount Union are Office & Administration (4 | 8.0%), and Sales & Related (2 | 4.0%).
Sales and Office Occupations by Sex
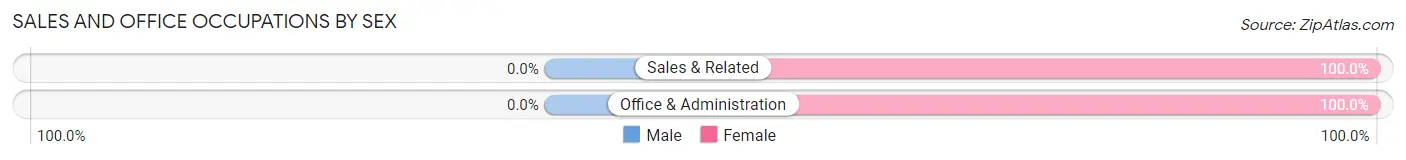
| Occupation | Male | Female |
| Sales & Related | 0 (0.0%) | 2 (100.0%) |
| Office & Administration | 0 (0.0%) | 4 (100.0%) |
| Total (Category) | 0 (0.0%) | 6 (100.0%) |
| Total (Overall) | 28 (56.0%) | 22 (44.0%) |
Natural Resources, Construction and Maintenance Occupations
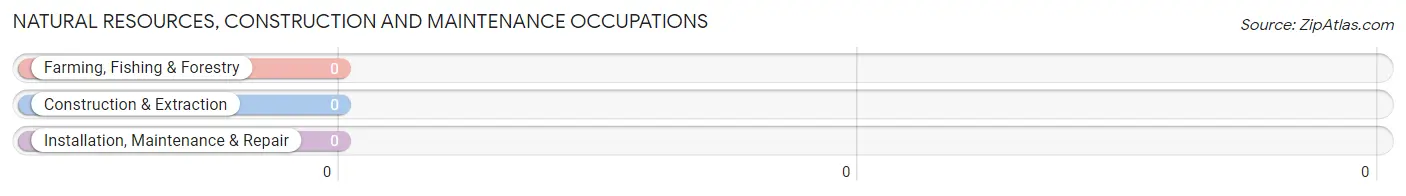
Natural Resources, Construction and Maintenance Occupations by Sex
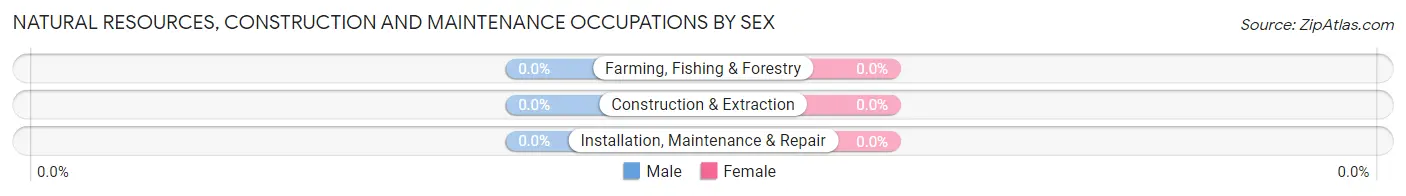
| Occupation | Male | Female |
| Farming, Fishing & Forestry | 0 (0.0%) | 0 (0.0%) |
| Construction & Extraction | 0 (0.0%) | 0 (0.0%) |
| Installation, Maintenance & Repair | 0 (0.0%) | 0 (0.0%) |
| Total (Category) | 0 (0.0%) | 0 (0.0%) |
| Total (Overall) | 28 (56.0%) | 22 (44.0%) |
Production, Transportation and Moving Occupations
The most common Production, Transportation and Moving occupations in Mount Union are Material Moving (12 | 24.0%), Transportation (7 | 14.0%), and Production (6 | 12.0%).
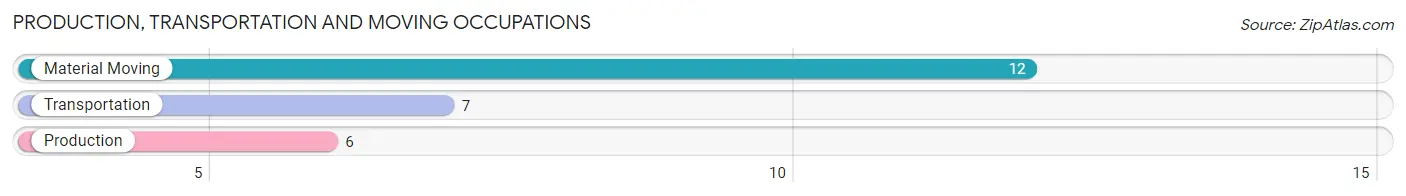
Production, Transportation and Moving Occupations by Sex
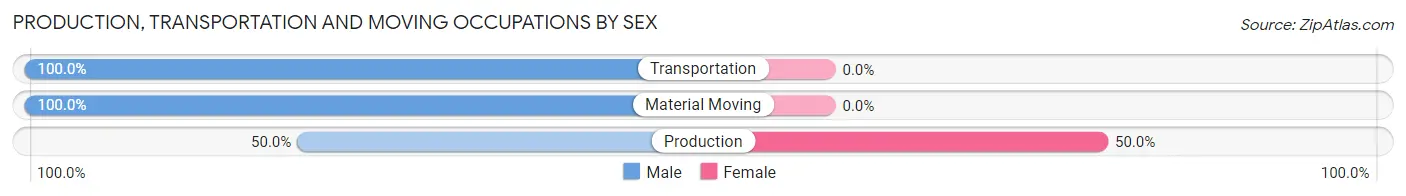
| Occupation | Male | Female |
| Production | 3 (50.0%) | 3 (50.0%) |
| Transportation | 7 (100.0%) | 0 (0.0%) |
| Material Moving | 12 (100.0%) | 0 (0.0%) |
| Total (Category) | 22 (88.0%) | 3 (12.0%) |
| Total (Overall) | 28 (56.0%) | 22 (44.0%) |
Employment Industries by Sex in Mount Union
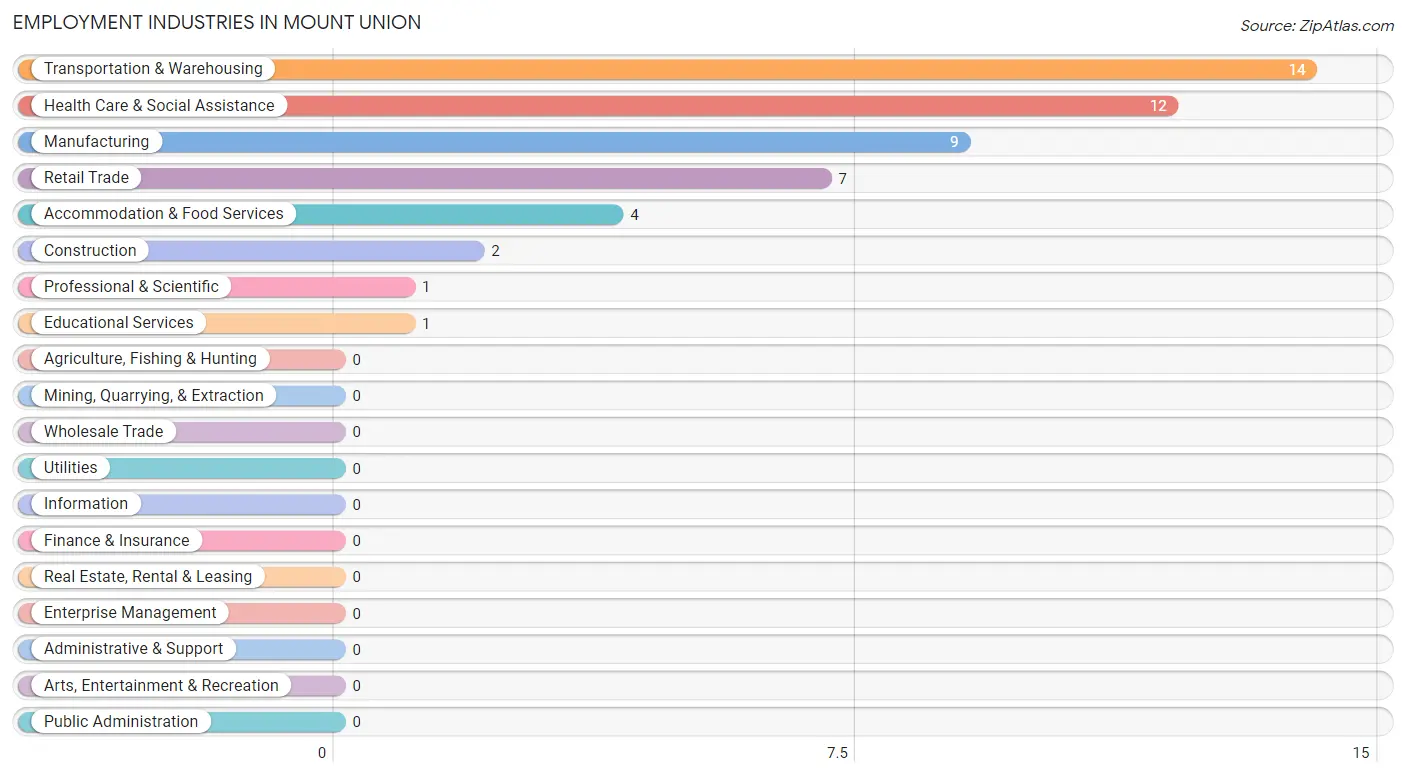
Employment Industries in Mount Union
The major employment industries in Mount Union include Transportation & Warehousing (14 | 28.0%), Health Care & Social Assistance (12 | 24.0%), Manufacturing (9 | 18.0%), Retail Trade (7 | 14.0%), and Accommodation & Food Services (4 | 8.0%).
Employment Industries by Sex in Mount Union
The Mount Union industries that see more men than women are Manufacturing (100.0%), Transportation & Warehousing (100.0%), and Professional & Scientific (100.0%), whereas the industries that tend to have a higher number of women are Construction (100.0%), Educational Services (100.0%), and Health Care & Social Assistance (100.0%).
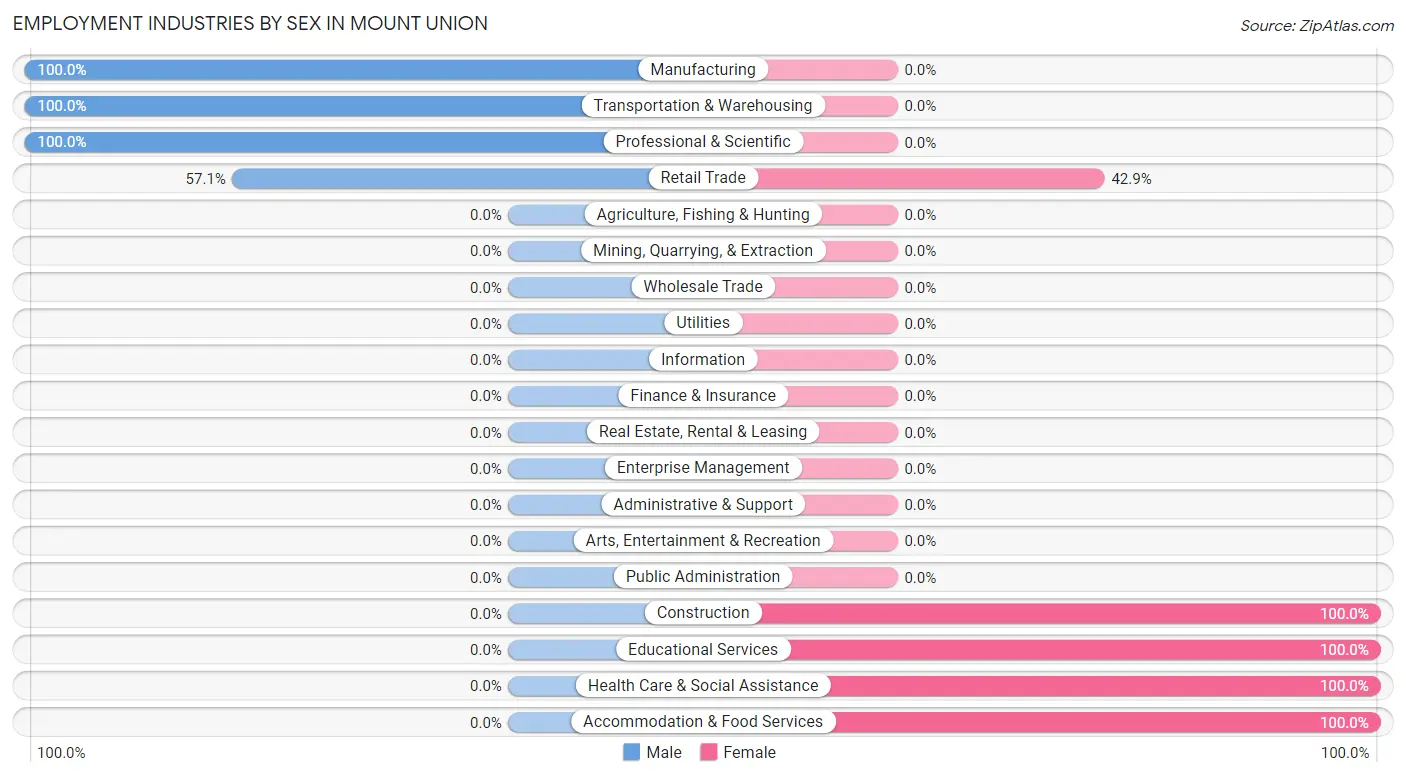
| Industry | Male | Female |
| Agriculture, Fishing & Hunting | 0 (0.0%) | 0 (0.0%) |
| Mining, Quarrying, & Extraction | 0 (0.0%) | 0 (0.0%) |
| Construction | 0 (0.0%) | 2 (100.0%) |
| Manufacturing | 9 (100.0%) | 0 (0.0%) |
| Wholesale Trade | 0 (0.0%) | 0 (0.0%) |
| Retail Trade | 4 (57.1%) | 3 (42.9%) |
| Transportation & Warehousing | 14 (100.0%) | 0 (0.0%) |
| Utilities | 0 (0.0%) | 0 (0.0%) |
| Information | 0 (0.0%) | 0 (0.0%) |
| Finance & Insurance | 0 (0.0%) | 0 (0.0%) |
| Real Estate, Rental & Leasing | 0 (0.0%) | 0 (0.0%) |
| Professional & Scientific | 1 (100.0%) | 0 (0.0%) |
| Enterprise Management | 0 (0.0%) | 0 (0.0%) |
| Administrative & Support | 0 (0.0%) | 0 (0.0%) |
| Educational Services | 0 (0.0%) | 1 (100.0%) |
| Health Care & Social Assistance | 0 (0.0%) | 12 (100.0%) |
| Arts, Entertainment & Recreation | 0 (0.0%) | 0 (0.0%) |
| Accommodation & Food Services | 0 (0.0%) | 4 (100.0%) |
| Public Administration | 0 (0.0%) | 0 (0.0%) |
| Total | 28 (56.0%) | 22 (44.0%) |
Education in Mount Union
School Enrollment in Mount Union
The most common levels of schooling among the 41 students in Mount Union are middle school (10 | 24.4%), elementary school (9 | 22.0%), and college / undergraduate (8 | 19.5%).
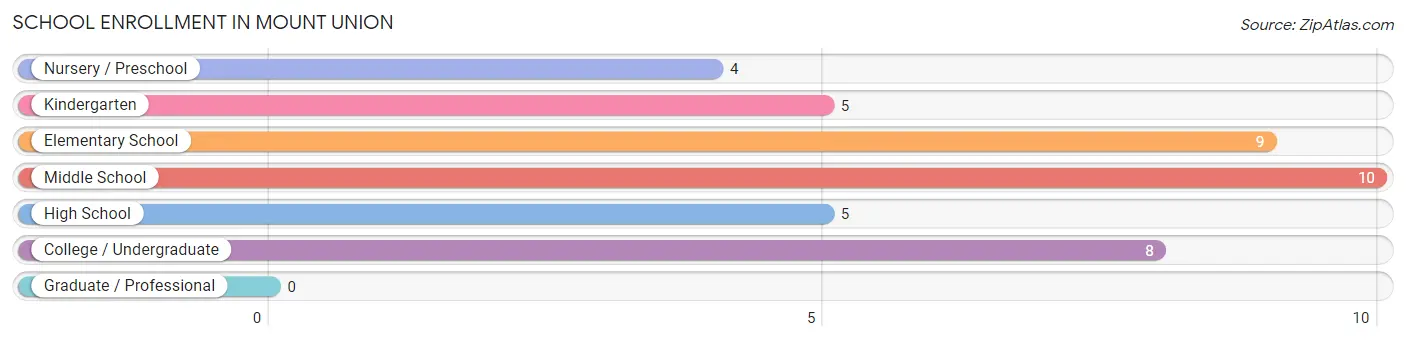
| School Level | # Students | % Students |
| Nursery / Preschool | 4 | 9.8% |
| Kindergarten | 5 | 12.2% |
| Elementary School | 9 | 22.0% |
| Middle School | 10 | 24.4% |
| High School | 5 | 12.2% |
| College / Undergraduate | 8 | 19.5% |
| Graduate / Professional | 0 | 0.0% |
| Total | 41 | 100.0% |
School Enrollment by Age by Funding Source in Mount Union
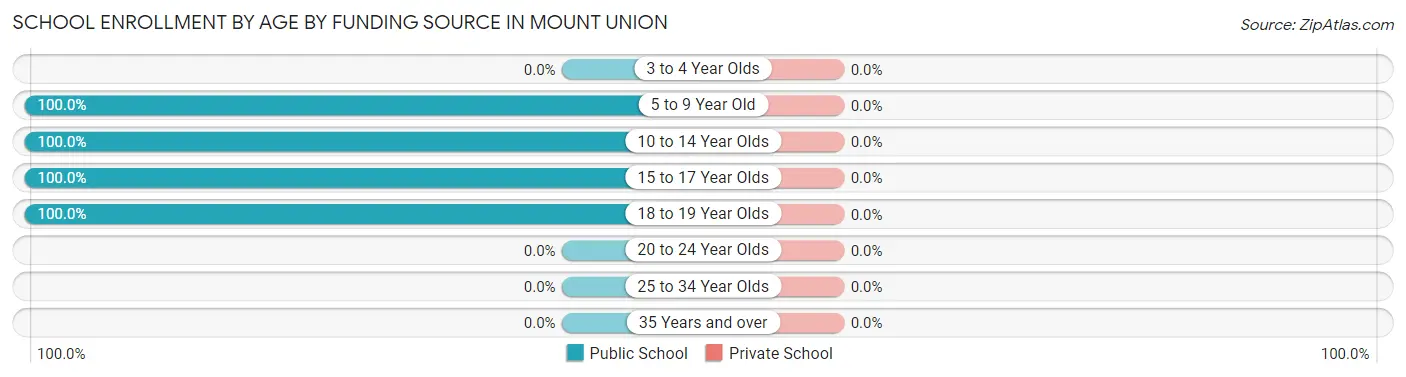
| Age Bracket | Public School | Private School |
| 3 to 4 Year Olds | 0 (0.0%) | 0 (0.0%) |
| 5 to 9 Year Old | 13 (100.0%) | 0 (0.0%) |
| 10 to 14 Year Olds | 10 (100.0%) | 0 (0.0%) |
| 15 to 17 Year Olds | 10 (100.0%) | 0 (0.0%) |
| 18 to 19 Year Olds | 8 (100.0%) | 0 (0.0%) |
| 20 to 24 Year Olds | 0 (0.0%) | 0 (0.0%) |
| 25 to 34 Year Olds | 0 (0.0%) | 0 (0.0%) |
| 35 Years and over | 0 (0.0%) | 0 (0.0%) |
| Total | 41 (100.0%) | 0 (0.0%) |
Educational Attainment by Field of Study in Mount Union
Education (6 | 66.7%), and communications (3 | 33.3%) are the most common fields of study among 9 individuals in Mount Union who have obtained a bachelor's degree or higher.
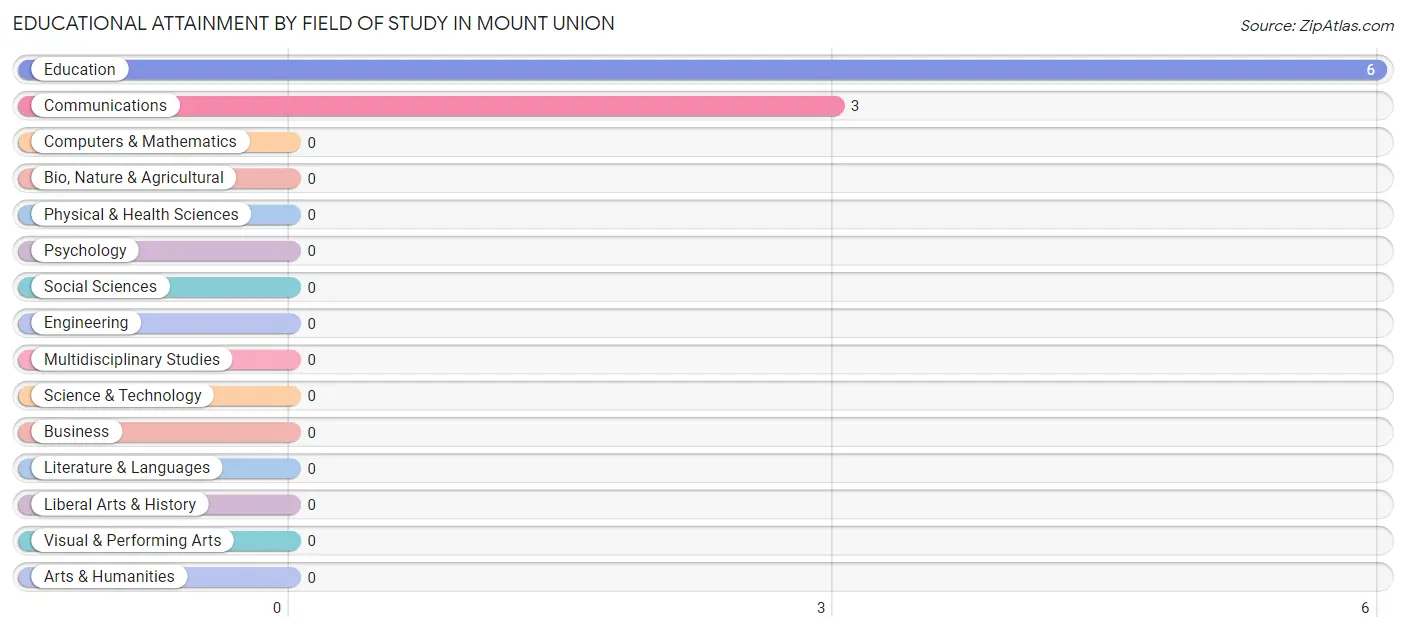
| Field of Study | # Graduates | % Graduates |
| Computers & Mathematics | 0 | 0.0% |
| Bio, Nature & Agricultural | 0 | 0.0% |
| Physical & Health Sciences | 0 | 0.0% |
| Psychology | 0 | 0.0% |
| Social Sciences | 0 | 0.0% |
| Engineering | 0 | 0.0% |
| Multidisciplinary Studies | 0 | 0.0% |
| Science & Technology | 0 | 0.0% |
| Business | 0 | 0.0% |
| Education | 6 | 66.7% |
| Literature & Languages | 0 | 0.0% |
| Liberal Arts & History | 0 | 0.0% |
| Visual & Performing Arts | 0 | 0.0% |
| Communications | 3 | 33.3% |
| Arts & Humanities | 0 | 0.0% |
| Total | 9 | 100.0% |
Transportation & Commute in Mount Union
Vehicle Availability by Sex in Mount Union
The most prevalent vehicle ownership categories in Mount Union are males with 4 vehicles (13, accounting for 46.4%) and females with 4 vehicles (3, making up 59.1%).
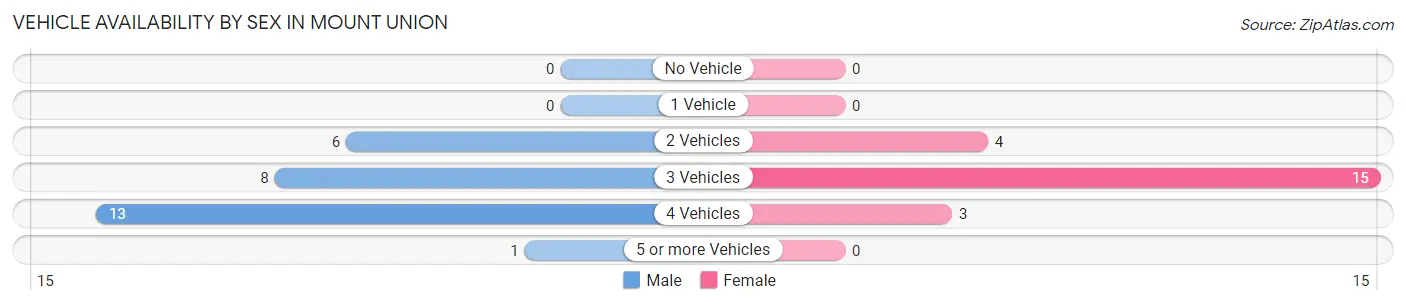
| Vehicles Available | Male | Female |
| No Vehicle | 0 (0.0%) | 0 (0.0%) |
| 1 Vehicle | 0 (0.0%) | 0 (0.0%) |
| 2 Vehicles | 6 (21.4%) | 4 (18.2%) |
| 3 Vehicles | 8 (28.6%) | 15 (68.2%) |
| 4 Vehicles | 13 (46.4%) | 3 (13.6%) |
| 5 or more Vehicles | 1 (3.6%) | 0 (0.0%) |
| Total | 28 (100.0%) | 22 (100.0%) |
Commute Time in Mount Union
The most frequently occuring commute durations in Mount Union are 60 to 89 minutes (17 commuters, 34.7%), 15 to 19 minutes (12 commuters, 24.5%), and 20 to 24 minutes (10 commuters, 20.4%).
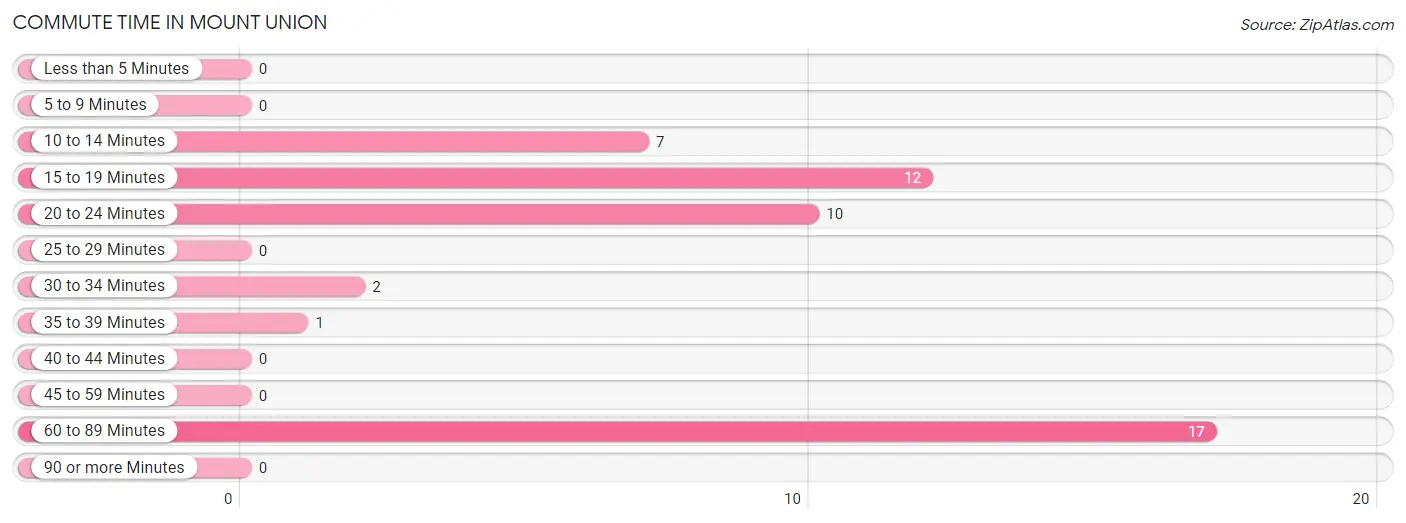
| Commute Time | # Commuters | % Commuters |
| Less than 5 Minutes | 0 | 0.0% |
| 5 to 9 Minutes | 0 | 0.0% |
| 10 to 14 Minutes | 7 | 14.3% |
| 15 to 19 Minutes | 12 | 24.5% |
| 20 to 24 Minutes | 10 | 20.4% |
| 25 to 29 Minutes | 0 | 0.0% |
| 30 to 34 Minutes | 2 | 4.1% |
| 35 to 39 Minutes | 1 | 2.0% |
| 40 to 44 Minutes | 0 | 0.0% |
| 45 to 59 Minutes | 0 | 0.0% |
| 60 to 89 Minutes | 17 | 34.7% |
| 90 or more Minutes | 0 | 0.0% |
Commute Time by Sex in Mount Union
The most common commute times in Mount Union are 15 to 19 minutes (8 commuters, 29.6%) for males and 60 to 89 minutes (12 commuters, 54.5%) for females.
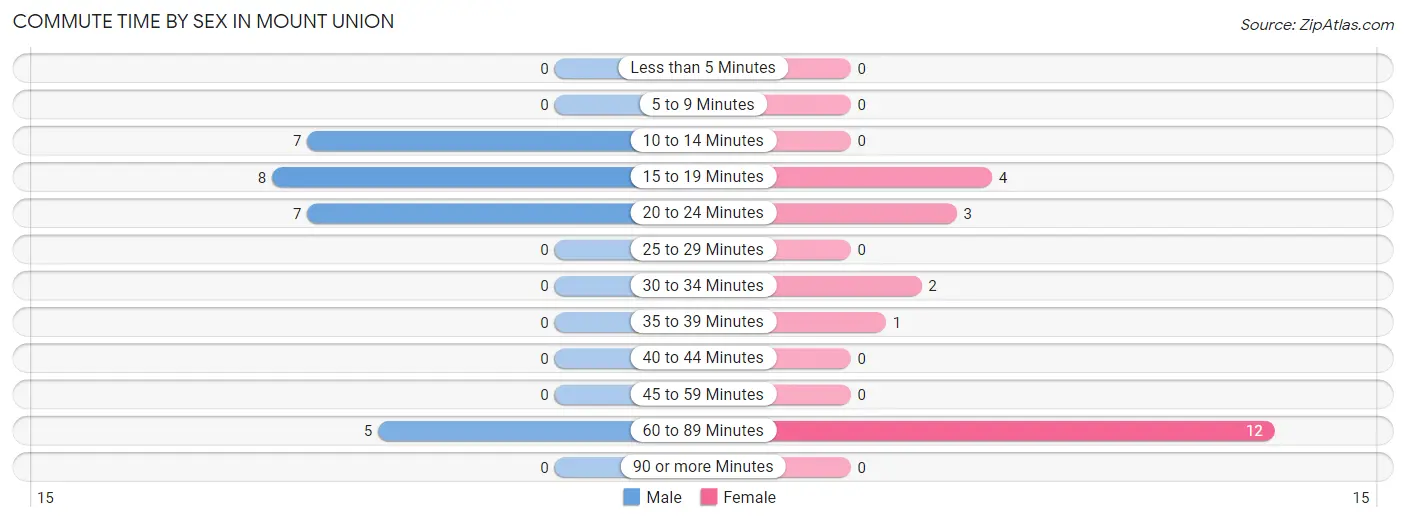
| Commute Time | Male | Female |
| Less than 5 Minutes | 0 (0.0%) | 0 (0.0%) |
| 5 to 9 Minutes | 0 (0.0%) | 0 (0.0%) |
| 10 to 14 Minutes | 7 (25.9%) | 0 (0.0%) |
| 15 to 19 Minutes | 8 (29.6%) | 4 (18.2%) |
| 20 to 24 Minutes | 7 (25.9%) | 3 (13.6%) |
| 25 to 29 Minutes | 0 (0.0%) | 0 (0.0%) |
| 30 to 34 Minutes | 0 (0.0%) | 2 (9.1%) |
| 35 to 39 Minutes | 0 (0.0%) | 1 (4.5%) |
| 40 to 44 Minutes | 0 (0.0%) | 0 (0.0%) |
| 45 to 59 Minutes | 0 (0.0%) | 0 (0.0%) |
| 60 to 89 Minutes | 5 (18.5%) | 12 (54.5%) |
| 90 or more Minutes | 0 (0.0%) | 0 (0.0%) |
Time of Departure to Work by Sex in Mount Union
The most frequent times of departure to work in Mount Union are 6:30 AM to 6:59 AM (11, 40.7%) for males and 12:00 PM to 3:59 PM (12, 54.5%) for females.
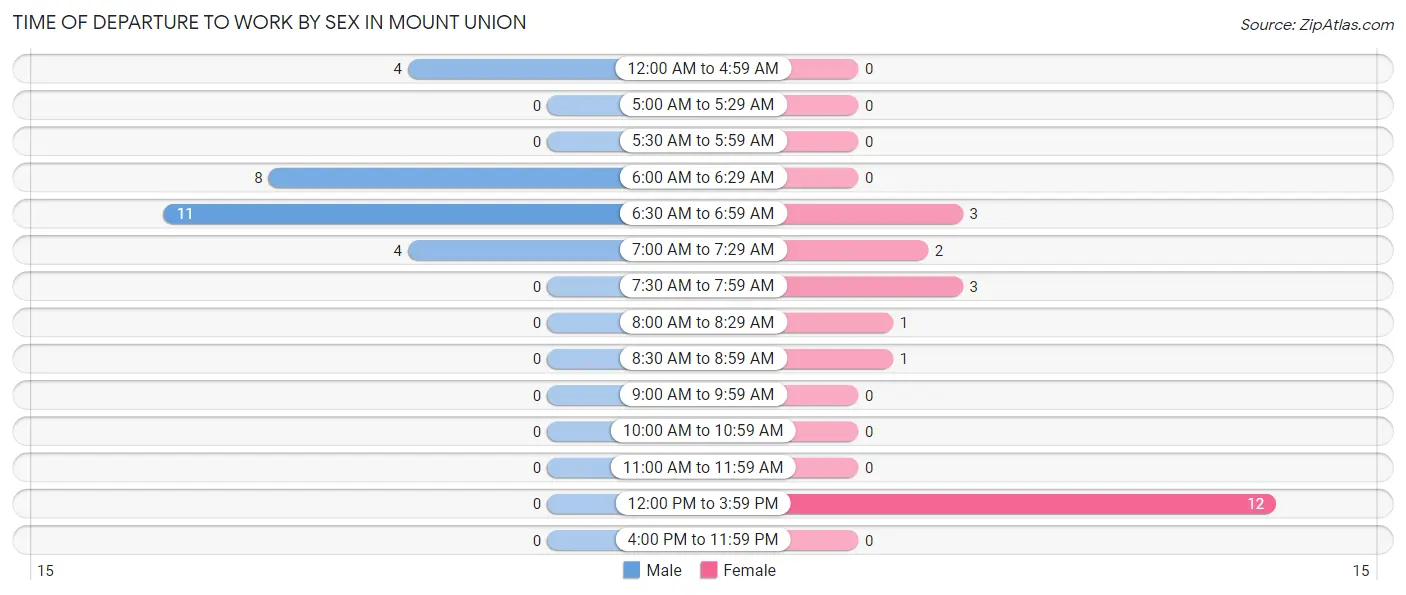
| Time of Departure | Male | Female |
| 12:00 AM to 4:59 AM | 4 (14.8%) | 0 (0.0%) |
| 5:00 AM to 5:29 AM | 0 (0.0%) | 0 (0.0%) |
| 5:30 AM to 5:59 AM | 0 (0.0%) | 0 (0.0%) |
| 6:00 AM to 6:29 AM | 8 (29.6%) | 0 (0.0%) |
| 6:30 AM to 6:59 AM | 11 (40.7%) | 3 (13.6%) |
| 7:00 AM to 7:29 AM | 4 (14.8%) | 2 (9.1%) |
| 7:30 AM to 7:59 AM | 0 (0.0%) | 3 (13.6%) |
| 8:00 AM to 8:29 AM | 0 (0.0%) | 1 (4.5%) |
| 8:30 AM to 8:59 AM | 0 (0.0%) | 1 (4.5%) |
| 9:00 AM to 9:59 AM | 0 (0.0%) | 0 (0.0%) |
| 10:00 AM to 10:59 AM | 0 (0.0%) | 0 (0.0%) |
| 11:00 AM to 11:59 AM | 0 (0.0%) | 0 (0.0%) |
| 12:00 PM to 3:59 PM | 0 (0.0%) | 12 (54.5%) |
| 4:00 PM to 11:59 PM | 0 (0.0%) | 0 (0.0%) |
| Total | 27 (100.0%) | 22 (100.0%) |
Housing Occupancy in Mount Union
Occupancy by Ownership in Mount Union
Of the total 51 dwellings in Mount Union, owner-occupied units account for 43 (84.3%), while renter-occupied units make up 8 (15.7%).
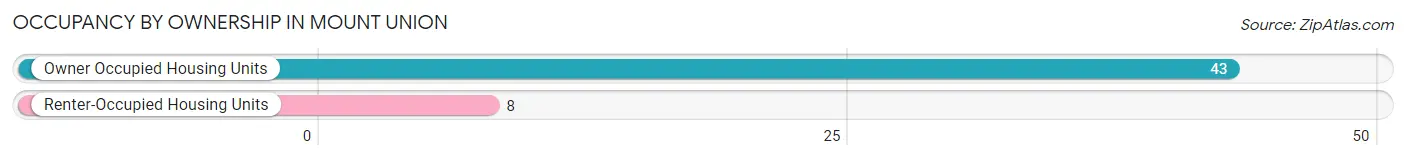
| Occupancy | # Housing Units | % Housing Units |
| Owner Occupied Housing Units | 43 | 84.3% |
| Renter-Occupied Housing Units | 8 | 15.7% |
| Total Occupied Housing Units | 51 | 100.0% |
Occupancy by Household Size in Mount Union
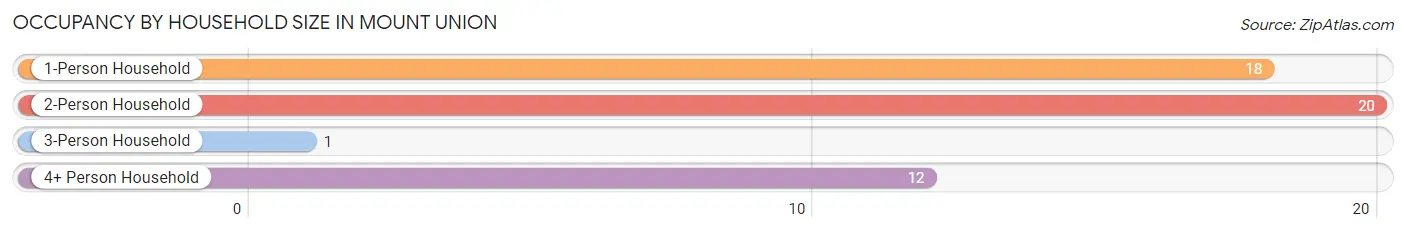
| Household Size | # Housing Units | % Housing Units |
| 1-Person Household | 18 | 35.3% |
| 2-Person Household | 20 | 39.2% |
| 3-Person Household | 1 | 2.0% |
| 4+ Person Household | 12 | 23.5% |
| Total Housing Units | 51 | 100.0% |
Occupancy by Ownership by Household Size in Mount Union
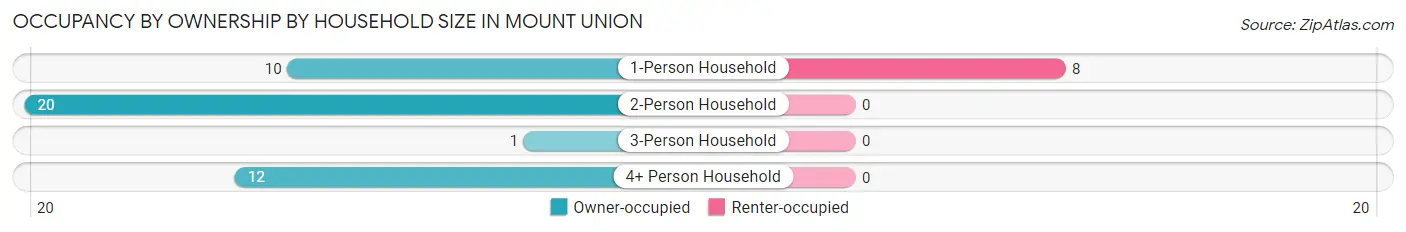
| Household Size | Owner-occupied | Renter-occupied |
| 1-Person Household | 10 (55.6%) | 8 (44.4%) |
| 2-Person Household | 20 (100.0%) | 0 (0.0%) |
| 3-Person Household | 1 (100.0%) | 0 (0.0%) |
| 4+ Person Household | 12 (100.0%) | 0 (0.0%) |
| Total Housing Units | 43 (84.3%) | 8 (15.7%) |
Occupancy by Educational Attainment in Mount Union
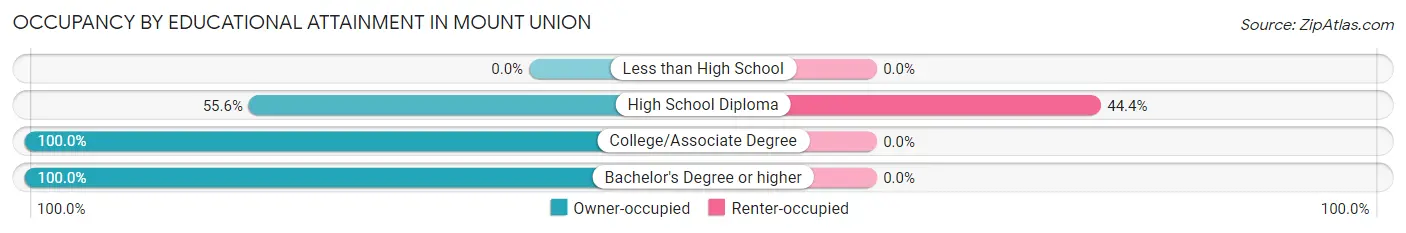
| Household Size | Owner-occupied | Renter-occupied |
| Less than High School | 0 (0.0%) | 0 (0.0%) |
| High School Diploma | 10 (55.6%) | 8 (44.4%) |
| College/Associate Degree | 27 (100.0%) | 0 (0.0%) |
| Bachelor's Degree or higher | 6 (100.0%) | 0 (0.0%) |
Occupancy by Age of Householder in Mount Union
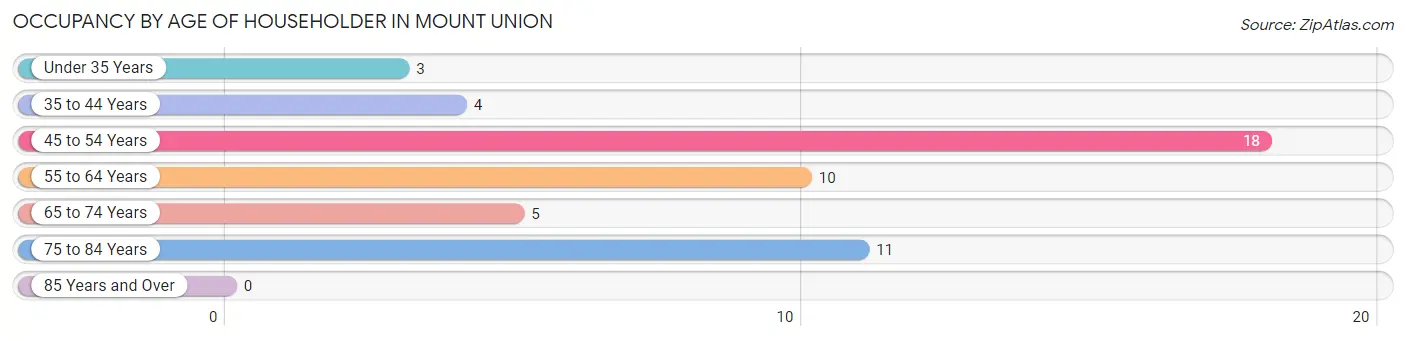
| Age Bracket | # Households | % Households |
| Under 35 Years | 3 | 5.9% |
| 35 to 44 Years | 4 | 7.8% |
| 45 to 54 Years | 18 | 35.3% |
| 55 to 64 Years | 10 | 19.6% |
| 65 to 74 Years | 5 | 9.8% |
| 75 to 84 Years | 11 | 21.6% |
| 85 Years and Over | 0 | 0.0% |
| Total | 51 | 100.0% |
Housing Finances in Mount Union
Median Income by Occupancy in Mount Union
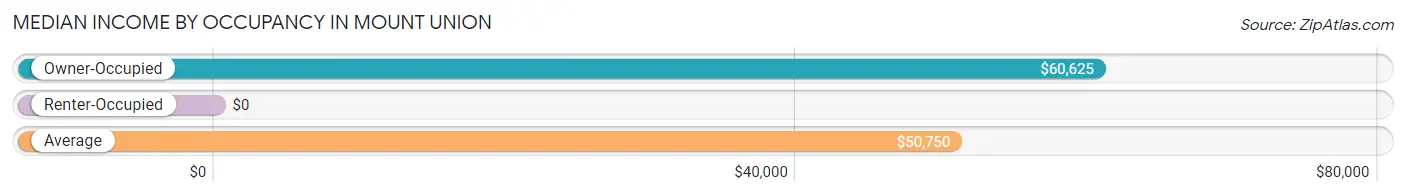
| Occupancy Type | # Households | Median Income |
| Owner-Occupied | 43 (84.3%) | $60,625 |
| Renter-Occupied | 8 (15.7%) | $0 |
| Average | 51 (100.0%) | $50,750 |
Occupancy by Householder Income Bracket in Mount Union
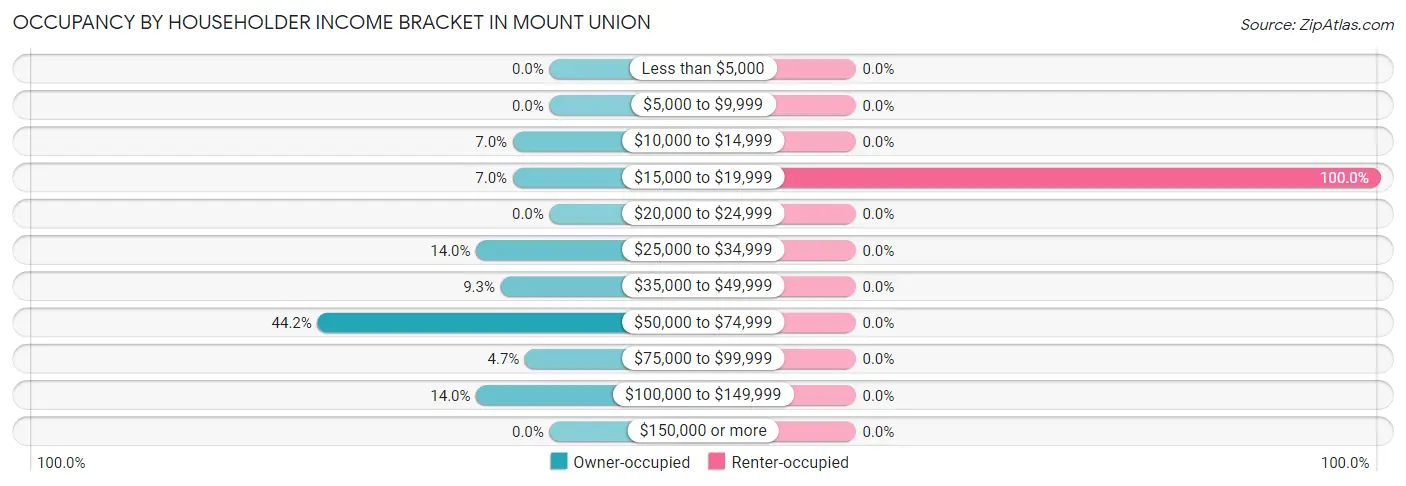
| Income Bracket | Owner-occupied | Renter-occupied |
| Less than $5,000 | 0 (0.0%) | 0 (0.0%) |
| $5,000 to $9,999 | 0 (0.0%) | 0 (0.0%) |
| $10,000 to $14,999 | 3 (7.0%) | 0 (0.0%) |
| $15,000 to $19,999 | 3 (7.0%) | 8 (100.0%) |
| $20,000 to $24,999 | 0 (0.0%) | 0 (0.0%) |
| $25,000 to $34,999 | 6 (14.0%) | 0 (0.0%) |
| $35,000 to $49,999 | 4 (9.3%) | 0 (0.0%) |
| $50,000 to $74,999 | 19 (44.2%) | 0 (0.0%) |
| $75,000 to $99,999 | 2 (4.6%) | 0 (0.0%) |
| $100,000 to $149,999 | 6 (14.0%) | 0 (0.0%) |
| $150,000 or more | 0 (0.0%) | 0 (0.0%) |
| Total | 43 (100.0%) | 8 (100.0%) |
Monthly Housing Cost Tiers in Mount Union
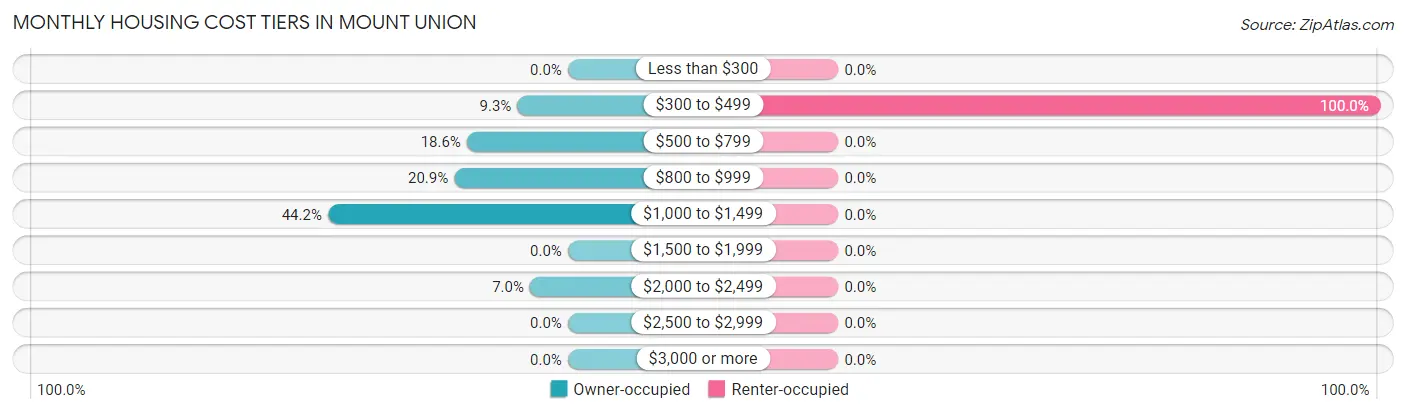
| Monthly Cost | Owner-occupied | Renter-occupied |
| Less than $300 | 0 (0.0%) | 0 (0.0%) |
| $300 to $499 | 4 (9.3%) | 8 (100.0%) |
| $500 to $799 | 8 (18.6%) | 0 (0.0%) |
| $800 to $999 | 9 (20.9%) | 0 (0.0%) |
| $1,000 to $1,499 | 19 (44.2%) | 0 (0.0%) |
| $1,500 to $1,999 | 0 (0.0%) | 0 (0.0%) |
| $2,000 to $2,499 | 3 (7.0%) | 0 (0.0%) |
| $2,500 to $2,999 | 0 (0.0%) | 0 (0.0%) |
| $3,000 or more | 0 (0.0%) | 0 (0.0%) |
| Total | 43 (100.0%) | 8 (100.0%) |
Physical Housing Characteristics in Mount Union
Housing Structures in Mount Union
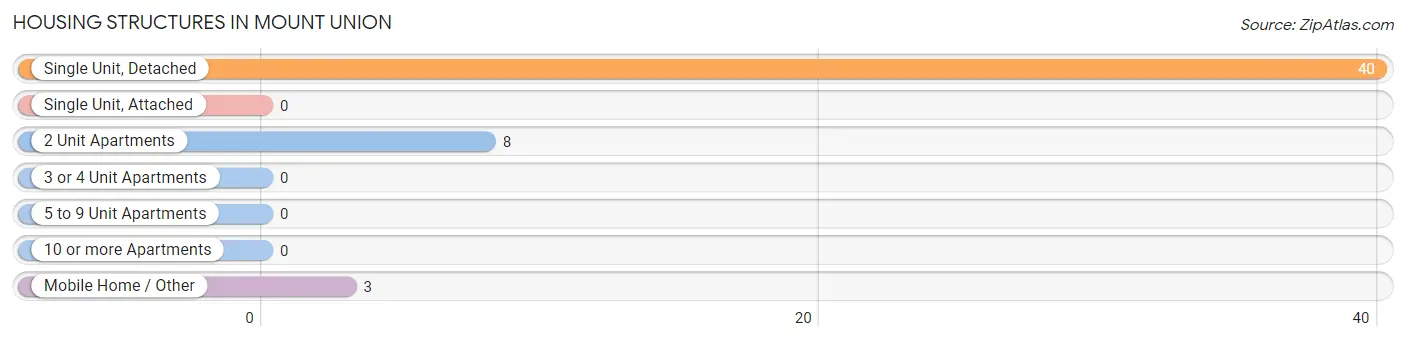
| Structure Type | # Housing Units | % Housing Units |
| Single Unit, Detached | 40 | 78.4% |
| Single Unit, Attached | 0 | 0.0% |
| 2 Unit Apartments | 8 | 15.7% |
| 3 or 4 Unit Apartments | 0 | 0.0% |
| 5 to 9 Unit Apartments | 0 | 0.0% |
| 10 or more Apartments | 0 | 0.0% |
| Mobile Home / Other | 3 | 5.9% |
| Total | 51 | 100.0% |
Housing Structures by Occupancy in Mount Union
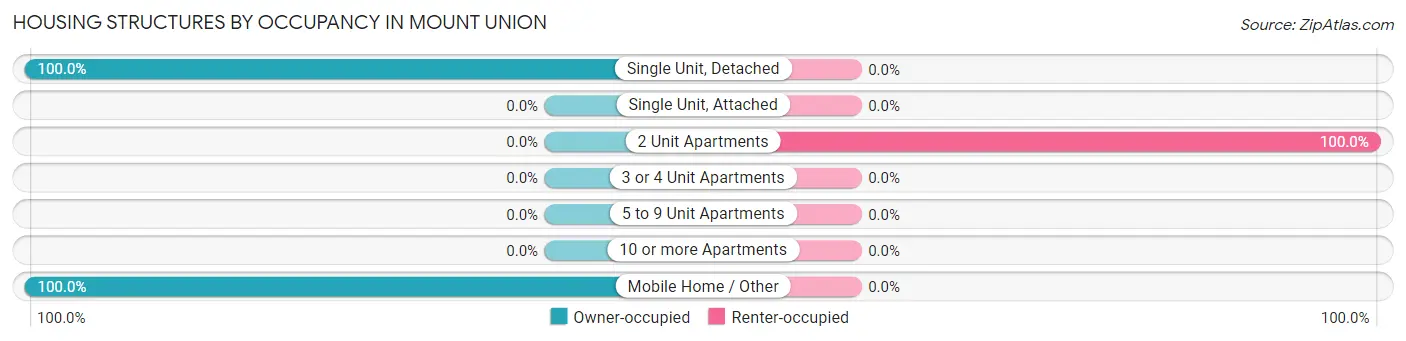
| Structure Type | Owner-occupied | Renter-occupied |
| Single Unit, Detached | 40 (100.0%) | 0 (0.0%) |
| Single Unit, Attached | 0 (0.0%) | 0 (0.0%) |
| 2 Unit Apartments | 0 (0.0%) | 8 (100.0%) |
| 3 or 4 Unit Apartments | 0 (0.0%) | 0 (0.0%) |
| 5 to 9 Unit Apartments | 0 (0.0%) | 0 (0.0%) |
| 10 or more Apartments | 0 (0.0%) | 0 (0.0%) |
| Mobile Home / Other | 3 (100.0%) | 0 (0.0%) |
| Total | 43 (84.3%) | 8 (15.7%) |
Housing Structures by Number of Rooms in Mount Union
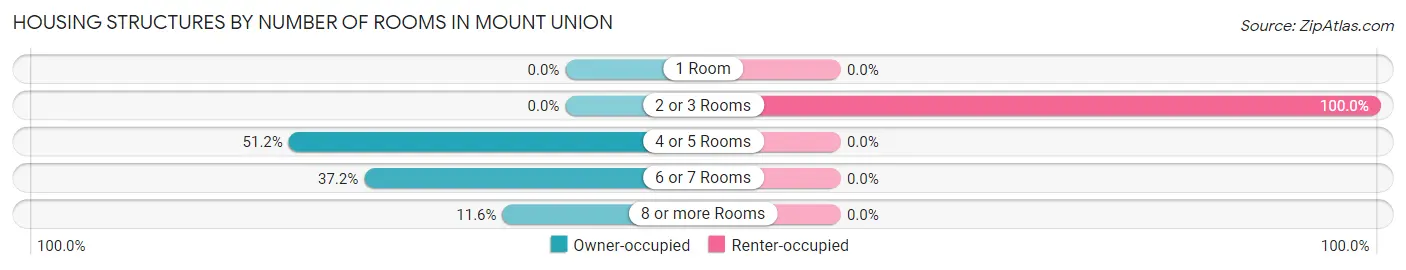
| Number of Rooms | Owner-occupied | Renter-occupied |
| 1 Room | 0 (0.0%) | 0 (0.0%) |
| 2 or 3 Rooms | 0 (0.0%) | 8 (100.0%) |
| 4 or 5 Rooms | 22 (51.2%) | 0 (0.0%) |
| 6 or 7 Rooms | 16 (37.2%) | 0 (0.0%) |
| 8 or more Rooms | 5 (11.6%) | 0 (0.0%) |
| Total | 43 (100.0%) | 8 (100.0%) |
Housing Structure by Heating Type in Mount Union
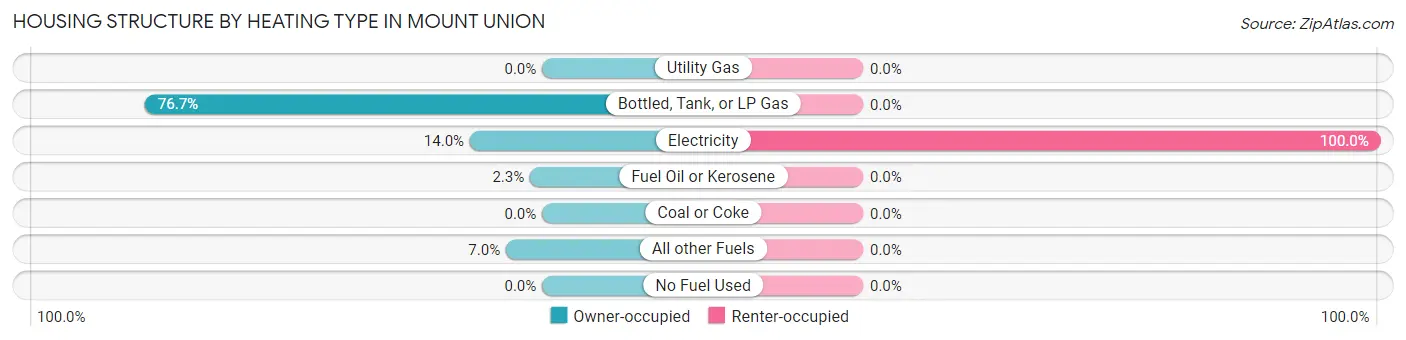
| Heating Type | Owner-occupied | Renter-occupied |
| Utility Gas | 0 (0.0%) | 0 (0.0%) |
| Bottled, Tank, or LP Gas | 33 (76.7%) | 0 (0.0%) |
| Electricity | 6 (14.0%) | 8 (100.0%) |
| Fuel Oil or Kerosene | 1 (2.3%) | 0 (0.0%) |
| Coal or Coke | 0 (0.0%) | 0 (0.0%) |
| All other Fuels | 3 (7.0%) | 0 (0.0%) |
| No Fuel Used | 0 (0.0%) | 0 (0.0%) |
| Total | 43 (100.0%) | 8 (100.0%) |
Household Vehicle Usage in Mount Union
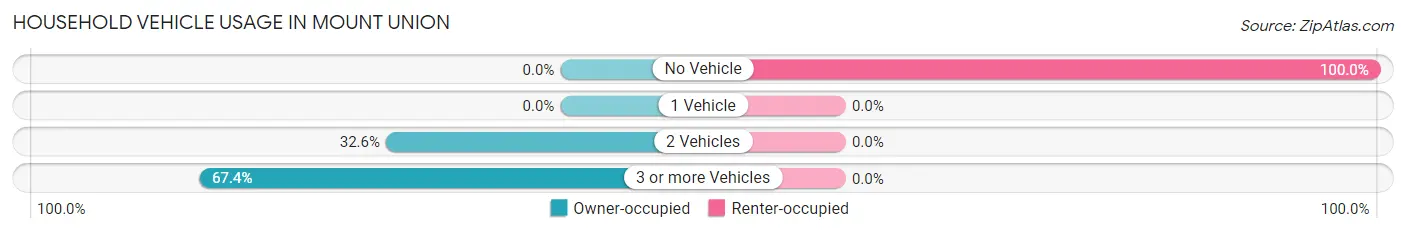
| Vehicles per Household | Owner-occupied | Renter-occupied |
| No Vehicle | 0 (0.0%) | 8 (100.0%) |
| 1 Vehicle | 0 (0.0%) | 0 (0.0%) |
| 2 Vehicles | 14 (32.6%) | 0 (0.0%) |
| 3 or more Vehicles | 29 (67.4%) | 0 (0.0%) |
| Total | 43 (100.0%) | 8 (100.0%) |
Real Estate & Mortgages in Mount Union
Real Estate and Mortgage Overview in Mount Union
| Characteristic | Without Mortgage | With Mortgage |
| Housing Units | 16 | 27 |
| Median Property Value | $85,000 | $83,900 |
| Median Household Income | - | - |
| Monthly Housing Costs | $850 | $0 |
| Real Estate Taxes | $1,417 | $3 |
Property Value by Mortgage Status in Mount Union
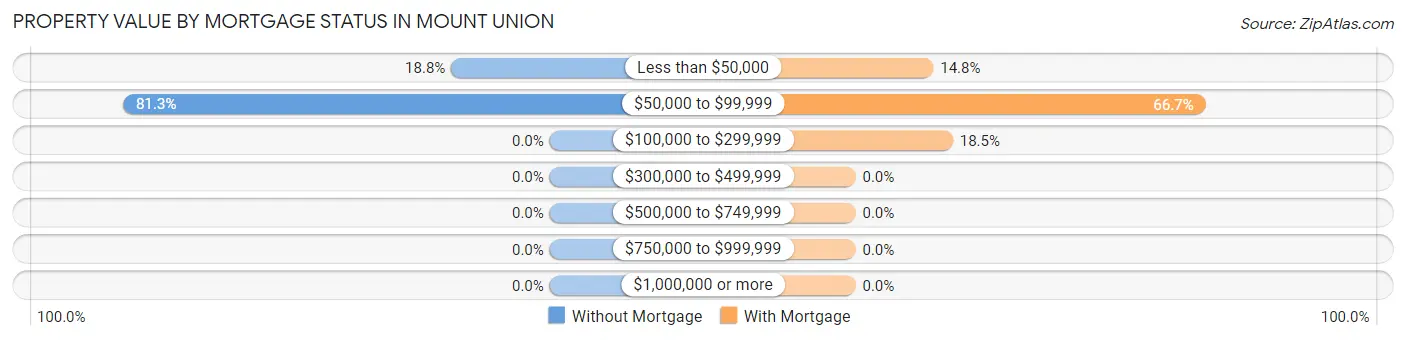
| Property Value | Without Mortgage | With Mortgage |
| Less than $50,000 | 3 (18.8%) | 4 (14.8%) |
| $50,000 to $99,999 | 13 (81.2%) | 18 (66.7%) |
| $100,000 to $299,999 | 0 (0.0%) | 5 (18.5%) |
| $300,000 to $499,999 | 0 (0.0%) | 0 (0.0%) |
| $500,000 to $749,999 | 0 (0.0%) | 0 (0.0%) |
| $750,000 to $999,999 | 0 (0.0%) | 0 (0.0%) |
| $1,000,000 or more | 0 (0.0%) | 0 (0.0%) |
| Total | 16 (100.0%) | 27 (100.0%) |
Household Income by Mortgage Status in Mount Union
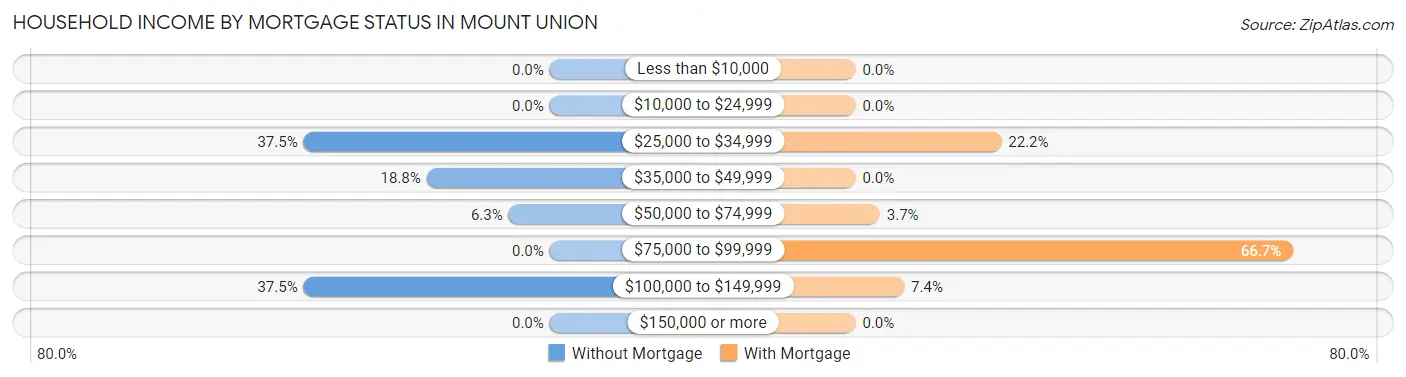
| Household Income | Without Mortgage | With Mortgage |
| Less than $10,000 | 0 (0.0%) | 0 (0.0%) |
| $10,000 to $24,999 | 0 (0.0%) | 0 (0.0%) |
| $25,000 to $34,999 | 6 (37.5%) | 6 (22.2%) |
| $35,000 to $49,999 | 3 (18.8%) | 0 (0.0%) |
| $50,000 to $74,999 | 1 (6.2%) | 1 (3.7%) |
| $75,000 to $99,999 | 0 (0.0%) | 18 (66.7%) |
| $100,000 to $149,999 | 6 (37.5%) | 2 (7.4%) |
| $150,000 or more | 0 (0.0%) | 0 (0.0%) |
| Total | 16 (100.0%) | 27 (100.0%) |
Property Value to Household Income Ratio in Mount Union
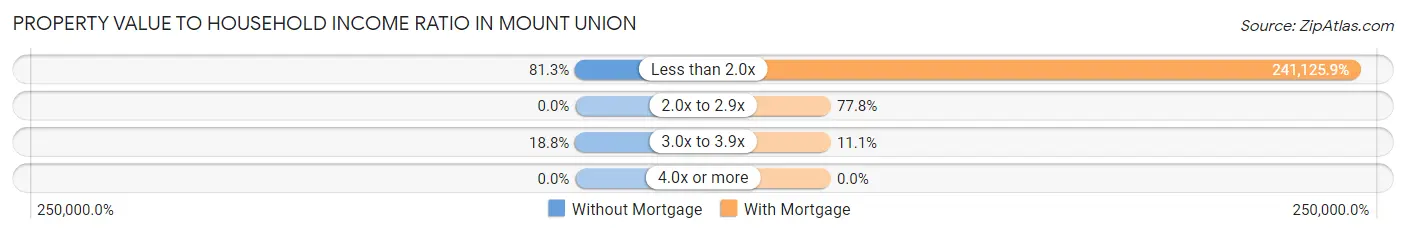
| Value-to-Income Ratio | Without Mortgage | With Mortgage |
| Less than 2.0x | 13 (81.2%) | 65,104 (241,125.9%) |
| 2.0x to 2.9x | 0 (0.0%) | 21 (77.8%) |
| 3.0x to 3.9x | 3 (18.8%) | 3 (11.1%) |
| 4.0x or more | 0 (0.0%) | 0 (0.0%) |
| Total | 16 (100.0%) | 27 (100.0%) |
Real Estate Taxes by Mortgage Status in Mount Union
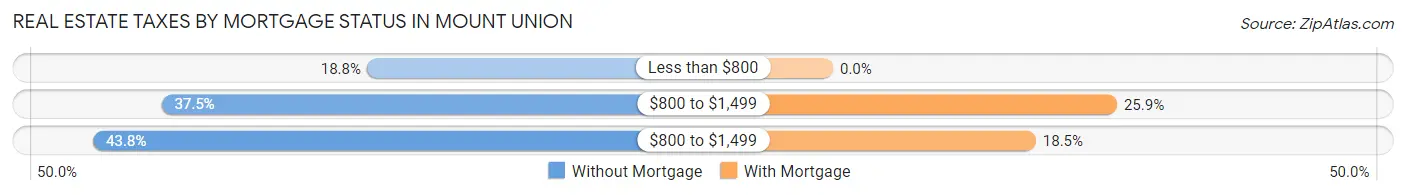
| Property Taxes | Without Mortgage | With Mortgage |
| Less than $800 | 3 (18.8%) | 0 (0.0%) |
| $800 to $1,499 | 6 (37.5%) | 7 (25.9%) |
| $800 to $1,499 | 7 (43.8%) | 5 (18.5%) |
| Total | 16 (100.0%) | 27 (100.0%) |
Health & Disability in Mount Union
Health Insurance Coverage by Age in Mount Union
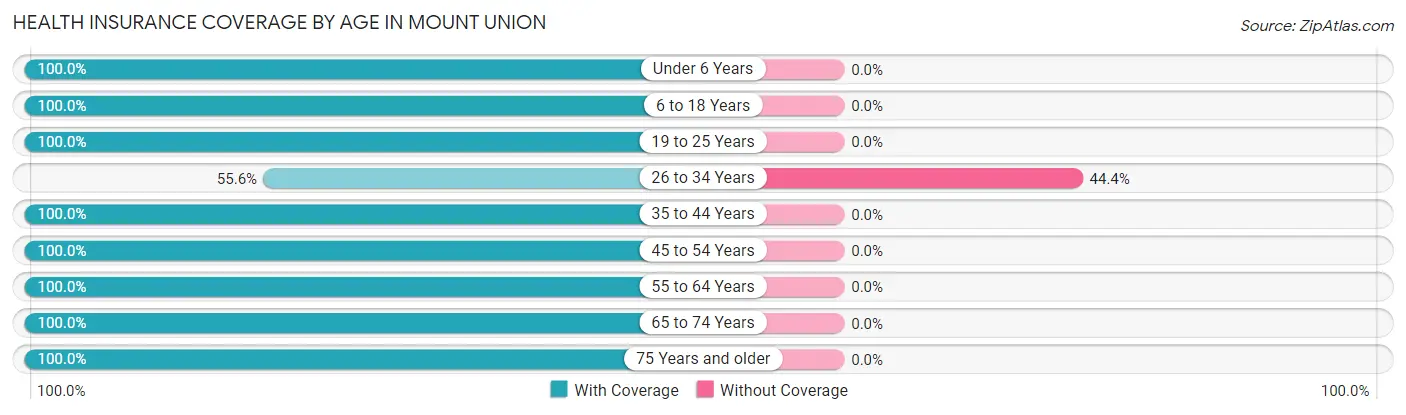
| Age Bracket | With Coverage | Without Coverage |
| Under 6 Years | 12 (100.0%) | 0 (0.0%) |
| 6 to 18 Years | 29 (100.0%) | 0 (0.0%) |
| 19 to 25 Years | 8 (100.0%) | 0 (0.0%) |
| 26 to 34 Years | 5 (55.6%) | 4 (44.4%) |
| 35 to 44 Years | 10 (100.0%) | 0 (0.0%) |
| 45 to 54 Years | 19 (100.0%) | 0 (0.0%) |
| 55 to 64 Years | 10 (100.0%) | 0 (0.0%) |
| 65 to 74 Years | 14 (100.0%) | 0 (0.0%) |
| 75 Years and older | 11 (100.0%) | 0 (0.0%) |
| Total | 118 (96.7%) | 4 (3.3%) |
Health Insurance Coverage by Citizenship Status in Mount Union
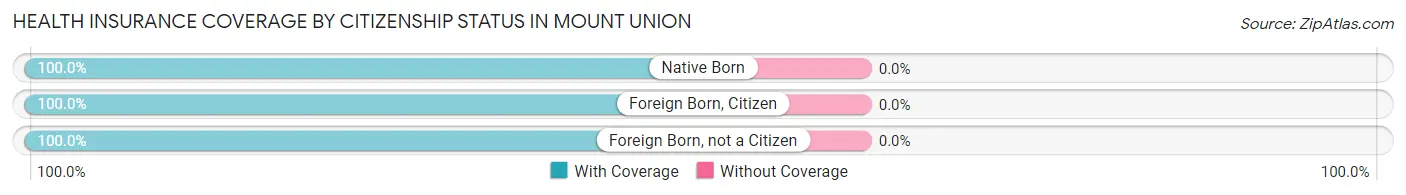
| Citizenship Status | With Coverage | Without Coverage |
| Native Born | 12 (100.0%) | 0 (0.0%) |
| Foreign Born, Citizen | 29 (100.0%) | 0 (0.0%) |
| Foreign Born, not a Citizen | 8 (100.0%) | 0 (0.0%) |
Health Insurance Coverage by Household Income in Mount Union
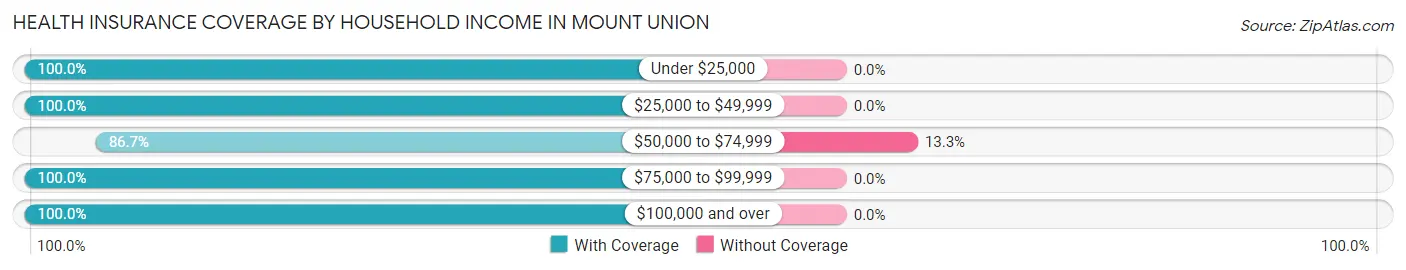
| Household Income | With Coverage | Without Coverage |
| Under $25,000 | 18 (100.0%) | 0 (0.0%) |
| $25,000 to $49,999 | 42 (100.0%) | 0 (0.0%) |
| $50,000 to $74,999 | 26 (86.7%) | 4 (13.3%) |
| $75,000 to $99,999 | 7 (100.0%) | 0 (0.0%) |
| $100,000 and over | 25 (100.0%) | 0 (0.0%) |
Public vs Private Health Insurance Coverage by Age in Mount Union
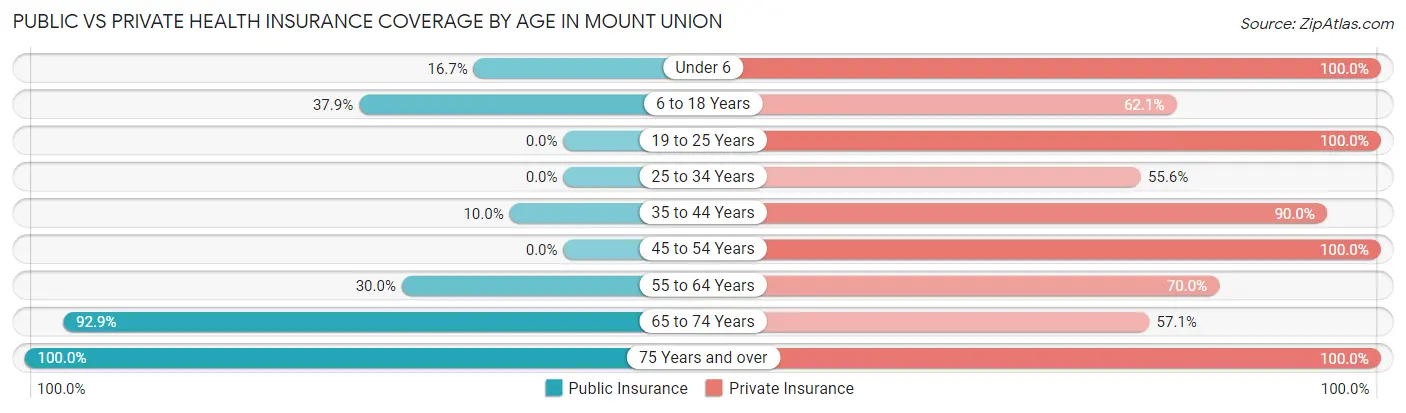
| Age Bracket | Public Insurance | Private Insurance |
| Under 6 | 2 (16.7%) | 12 (100.0%) |
| 6 to 18 Years | 11 (37.9%) | 18 (62.1%) |
| 19 to 25 Years | 0 (0.0%) | 8 (100.0%) |
| 25 to 34 Years | 0 (0.0%) | 5 (55.6%) |
| 35 to 44 Years | 1 (10.0%) | 9 (90.0%) |
| 45 to 54 Years | 0 (0.0%) | 19 (100.0%) |
| 55 to 64 Years | 3 (30.0%) | 7 (70.0%) |
| 65 to 74 Years | 13 (92.9%) | 8 (57.1%) |
| 75 Years and over | 11 (100.0%) | 11 (100.0%) |
| Total | 41 (33.6%) | 97 (79.5%) |
Disability Status by Sex by Age in Mount Union
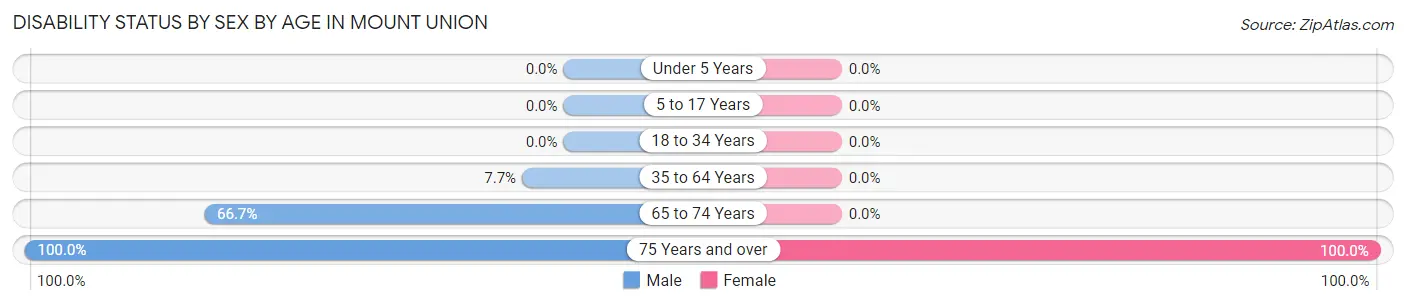
| Age Bracket | Male | Female |
| Under 5 Years | 0 (0.0%) | 0 (0.0%) |
| 5 to 17 Years | 0 (0.0%) | 0 (0.0%) |
| 18 to 34 Years | 0 (0.0%) | 0 (0.0%) |
| 35 to 64 Years | 1 (7.7%) | 0 (0.0%) |
| 65 to 74 Years | 6 (66.7%) | 0 (0.0%) |
| 75 Years and over | 3 (100.0%) | 8 (100.0%) |
Disability Class by Sex by Age in Mount Union
Disability Class: Hearing Difficulty
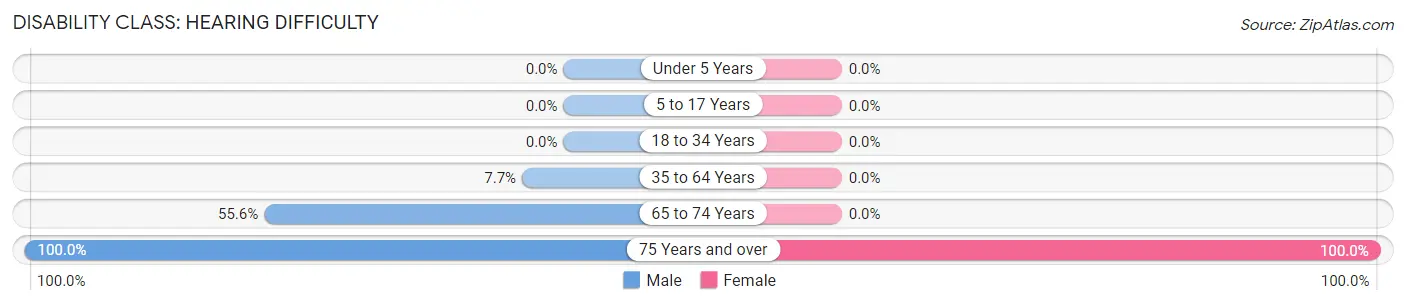
| Age Bracket | Male | Female |
| Under 5 Years | 0 (0.0%) | 0 (0.0%) |
| 5 to 17 Years | 0 (0.0%) | 0 (0.0%) |
| 18 to 34 Years | 0 (0.0%) | 0 (0.0%) |
| 35 to 64 Years | 1 (7.7%) | 0 (0.0%) |
| 65 to 74 Years | 5 (55.6%) | 0 (0.0%) |
| 75 Years and over | 3 (100.0%) | 8 (100.0%) |
Disability Class: Vision Difficulty
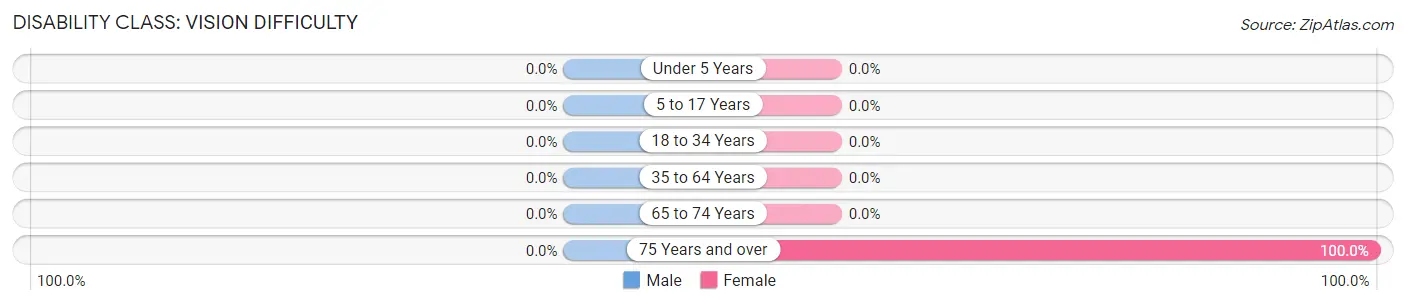
| Age Bracket | Male | Female |
| Under 5 Years | 0 (0.0%) | 0 (0.0%) |
| 5 to 17 Years | 0 (0.0%) | 0 (0.0%) |
| 18 to 34 Years | 0 (0.0%) | 0 (0.0%) |
| 35 to 64 Years | 0 (0.0%) | 0 (0.0%) |
| 65 to 74 Years | 0 (0.0%) | 0 (0.0%) |
| 75 Years and over | 0 (0.0%) | 8 (100.0%) |
Disability Class: Cognitive Difficulty
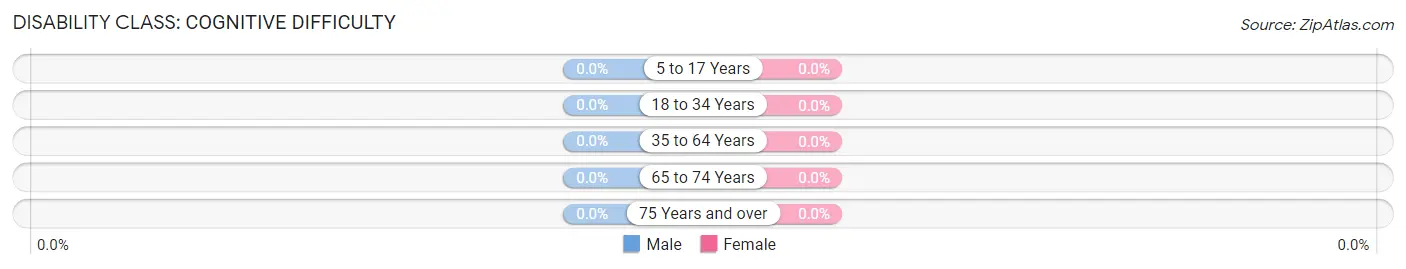
| Age Bracket | Male | Female |
| 5 to 17 Years | 0 (0.0%) | 0 (0.0%) |
| 18 to 34 Years | 0 (0.0%) | 0 (0.0%) |
| 35 to 64 Years | 0 (0.0%) | 0 (0.0%) |
| 65 to 74 Years | 0 (0.0%) | 0 (0.0%) |
| 75 Years and over | 0 (0.0%) | 0 (0.0%) |
Disability Class: Ambulatory Difficulty
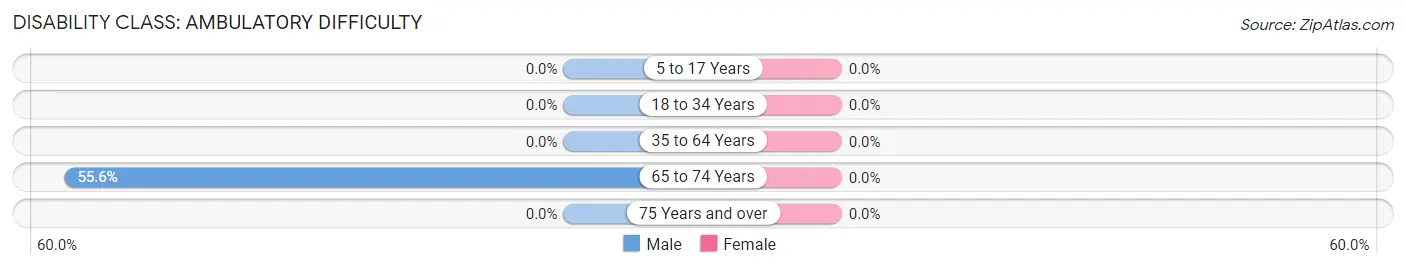
| Age Bracket | Male | Female |
| 5 to 17 Years | 0 (0.0%) | 0 (0.0%) |
| 18 to 34 Years | 0 (0.0%) | 0 (0.0%) |
| 35 to 64 Years | 0 (0.0%) | 0 (0.0%) |
| 65 to 74 Years | 5 (55.6%) | 0 (0.0%) |
| 75 Years and over | 0 (0.0%) | 0 (0.0%) |
Disability Class: Self-Care Difficulty
| Age Bracket | Male | Female |
| 5 to 17 Years | 0 (0.0%) | 0 (0.0%) |
| 18 to 34 Years | 0 (0.0%) | 0 (0.0%) |
| 35 to 64 Years | 0 (0.0%) | 0 (0.0%) |
| 65 to 74 Years | 0 (0.0%) | 0 (0.0%) |
| 75 Years and over | 0 (0.0%) | 0 (0.0%) |
Technology Access in Mount Union
Computing Device Access in Mount Union
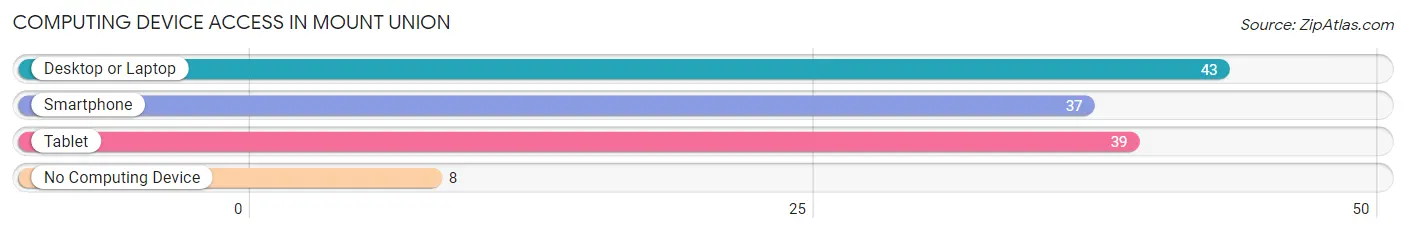
| Device Type | # Households | % Households |
| Desktop or Laptop | 43 | 84.3% |
| Smartphone | 37 | 72.6% |
| Tablet | 39 | 76.5% |
| No Computing Device | 8 | 15.7% |
| Total | 51 | 100.0% |
Internet Access in Mount Union
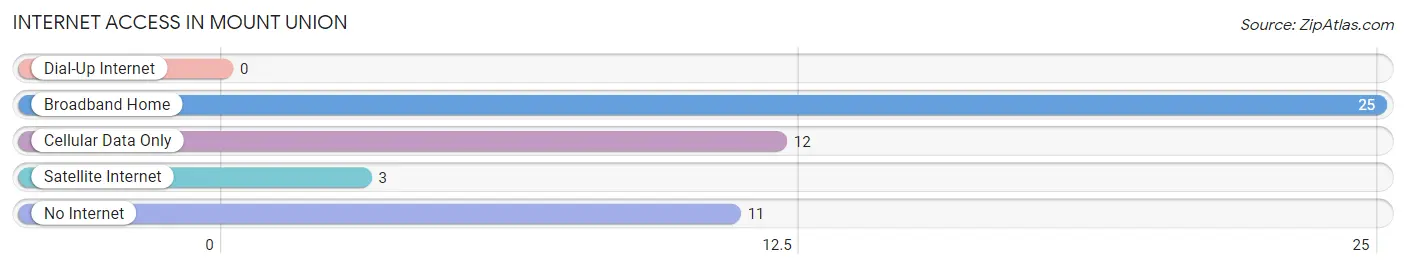
| Internet Type | # Households | % Households |
| Dial-Up Internet | 0 | 0.0% |
| Broadband Home | 25 | 49.0% |
| Cellular Data Only | 12 | 23.5% |
| Satellite Internet | 3 | 5.9% |
| No Internet | 11 | 21.6% |
| Total | 51 | 100.0% |
Mount Union Summary
History
The small town of Mount Union, Iowa is located in the southeastern corner of the state, in the county of Henry. It is situated on the banks of the Des Moines River, and is part of the Keokuk-Hamilton-Mount Union Micropolitan Statistical Area. The town was founded in 1854 by a group of settlers from Ohio, led by William and Mary Ann Mount. The town was named after the Mounts, and the first post office was established in 1855.
The town grew slowly, but steadily, and by the late 19th century, it had become a thriving agricultural community. The town was home to several churches, a school, a bank, a newspaper, and a variety of businesses. In the early 20th century, the town was connected to the rest of the state by the Burlington and Missouri River Railroad.
In the mid-20th century, the town experienced a period of decline, as many of its residents moved away in search of better economic opportunities. However, in recent years, the town has seen a resurgence in population and economic activity. The town is now home to a variety of businesses, including a grocery store, a hardware store, a bank, and several restaurants.
Geography
Mount Union is located in the southeastern corner of Iowa, in the county of Henry. It is situated on the banks of the Des Moines River, and is part of the Keokuk-Hamilton-Mount Union Micropolitan Statistical Area. The town is located at an elevation of 845 feet above sea level, and has a total area of 0.7 square miles.
The town is surrounded by rolling hills and farmland, and is located near several state parks and recreational areas. The nearest major city is Des Moines, which is located about 50 miles to the northwest.
Economy
The economy of Mount Union is largely based on agriculture and tourism. The town is home to several farms, which produce a variety of crops, including corn, soybeans, and hay. The town is also home to several businesses, including a grocery store, a hardware store, a bank, and several restaurants.
The town is also a popular tourist destination, as it is located near several state parks and recreational areas. The town is home to several festivals and events throughout the year, including the Mount Union Fall Festival and the Mount Union Music Festival.
Demographics
As of the 2010 census, the population of Mount Union was 845. The town has a population density of 1,200 people per square mile. The median age of the population is 44.7 years, and the median household income is $45,000.
The town is predominantly white, with 92.3% of the population identifying as such. The town is also home to a small Hispanic population, with 4.2% of the population identifying as Hispanic or Latino. The town is also home to a small African American population, with 1.2% of the population identifying as such.
Conclusion
Mount Union, Iowa is a small town located in the southeastern corner of the state. The town was founded in 1854, and has since grown into a thriving agricultural community. The town is home to a variety of businesses, and is a popular tourist destination due to its proximity to several state parks and recreational areas. The town has a population of 845, and is predominantly white, with a small Hispanic and African American population. The town's economy is largely based on agriculture and tourism.
Common Questions
What is Per Capita Income in Mount Union?
Per Capita income in Mount Union is $20,423.
What is the Median Family Income in Mount Union?
Median Family Income in Mount Union is $51,250.
What is the Median Household income in Mount Union?
Median Household Income in Mount Union is $50,750.
What is Inequality or Gini Index in Mount Union?
Inequality or Gini Index in Mount Union is 0.35.
What is the Total Population of Mount Union?
Total Population of Mount Union is 122.
What is the Total Male Population of Mount Union?
Total Male Population of Mount Union is 64.
What is the Total Female Population of Mount Union?
Total Female Population of Mount Union is 58.
What is the Ratio of Males per 100 Females in Mount Union?
There are 110.34 Males per 100 Females in Mount Union.
What is the Ratio of Females per 100 Males in Mount Union?
There are 90.62 Females per 100 Males in Mount Union.
What is the Median Population Age in Mount Union?
Median Population Age in Mount Union is 37.0 Years.
What is the Average Family Size in Mount Union
Average Family Size in Mount Union is 4.2 People.
What is the Average Household Size in Mount Union
Average Household Size in Mount Union is 2.4 People.
How Large is the Labor Force in Mount Union?
There are 50 People in the Labor Forcein in Mount Union.
What is the Percentage of People in the Labor Force in Mount Union?
59.5% of People are in the Labor Force in Mount Union.