Sigourney, IA Map & Demographics
Sigourney Map
Sigourney Overview
$31,823
PER CAPITA INCOME
$71,328
AVG FAMILY INCOME
$49,688
AVG HOUSEHOLD INCOME
8.1%
WAGE / INCOME GAP [ % ]
91.9¢/ $1
WAGE / INCOME GAP [ $ ]
0.44
INEQUALITY / GINI INDEX
1,835
TOTAL POPULATION
963
MALE POPULATION
872
FEMALE POPULATION
110.44
MALES / 100 FEMALES
90.55
FEMALES / 100 MALES
50.5
MEDIAN AGE
2.6
AVG FAMILY SIZE
2.0
AVG HOUSEHOLD SIZE
819
LABOR FORCE [ PEOPLE ]
51.2%
PERCENT IN LABOR FORCE
1.5%
UNEMPLOYMENT RATE
Sigourney Zip Codes
Sigourney Area Codes
Income in Sigourney
Income Overview in Sigourney
Per Capita Income in Sigourney is $31,823, while median incomes of families and households are $71,328 and $49,688 respectively.
| Characteristic | Number | Measure |
| Per Capita Income | 1,835 | $31,823 |
| Median Family Income | 474 | $71,328 |
| Mean Family Income | 474 | $76,948 |
| Median Household Income | 873 | $49,688 |
| Mean Household Income | 873 | $64,353 |
| Income Deficit | 474 | $0 |
| Wage / Income Gap (%) | 1,835 | 8.06% |
| Wage / Income Gap ($) | 1,835 | 91.94¢ per $1 |
| Gini / Inequality Index | 1,835 | 0.44 |
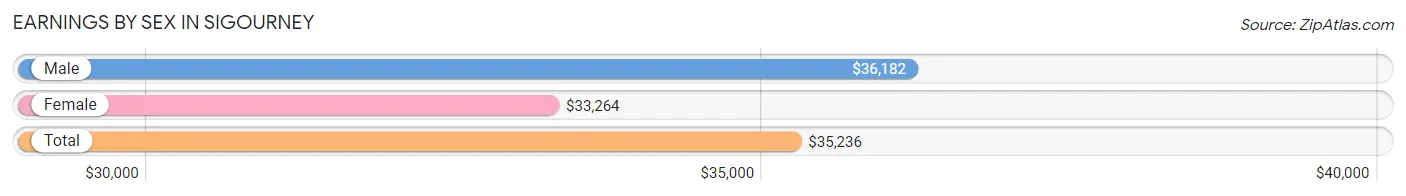
Earnings by Sex in Sigourney
Average Earnings in Sigourney are $35,236, $36,182 for men and $33,264 for women, a difference of 8.1%.
| Sex | Number | Average Earnings |
| Male | 511 (60.6%) | $36,182 |
| Female | 333 (39.5%) | $33,264 |
| Total | 844 (100.0%) | $35,236 |
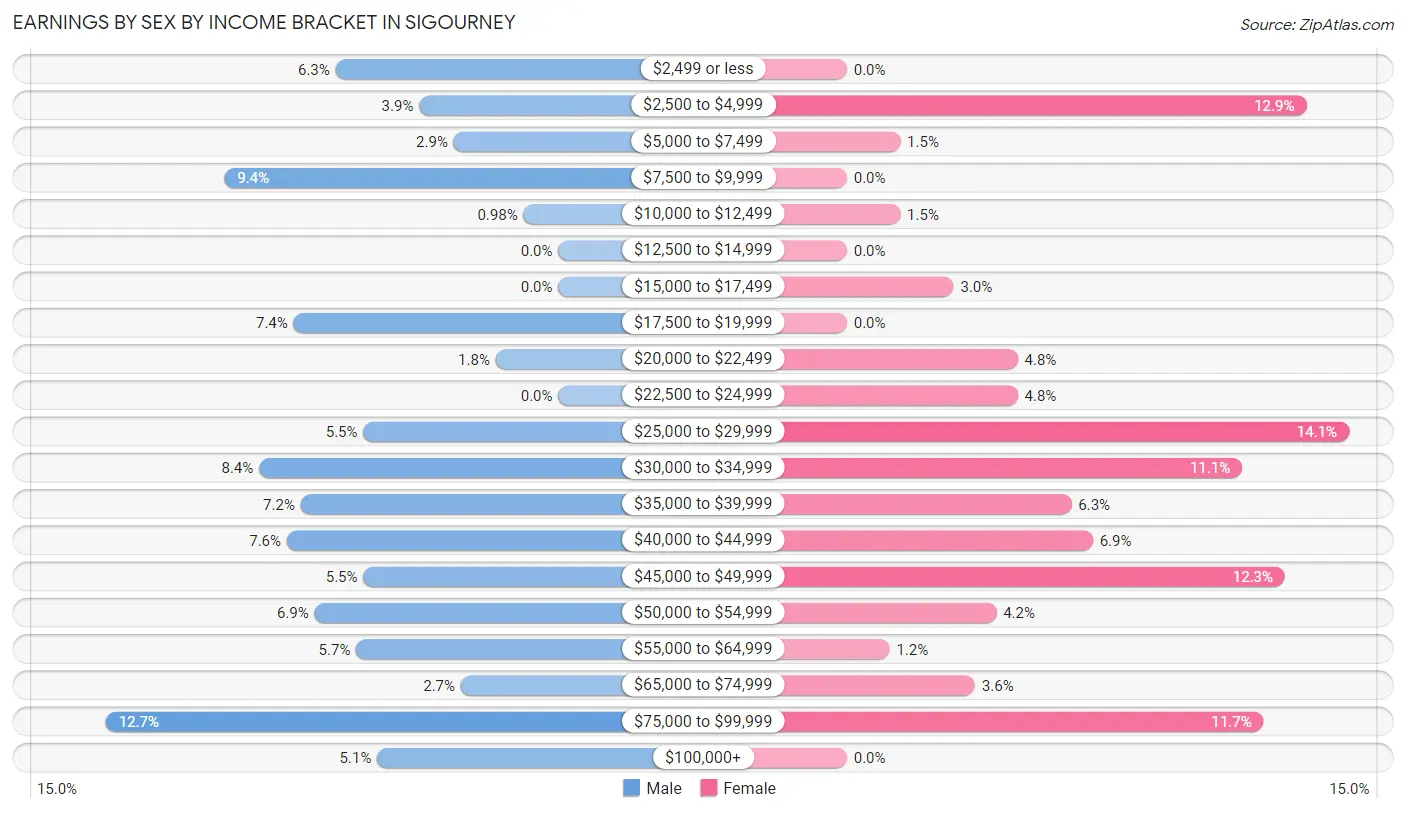
Earnings by Sex by Income Bracket in Sigourney
The most common earnings brackets in Sigourney are $75,000 to $99,999 for men (65 | 12.7%) and $25,000 to $29,999 for women (47 | 14.1%).
| Income | Male | Female |
| $2,499 or less | 32 (6.3%) | 0 (0.0%) |
| $2,500 to $4,999 | 20 (3.9%) | 43 (12.9%) |
| $5,000 to $7,499 | 15 (2.9%) | 5 (1.5%) |
| $7,500 to $9,999 | 48 (9.4%) | 0 (0.0%) |
| $10,000 to $12,499 | 5 (1.0%) | 5 (1.5%) |
| $12,500 to $14,999 | 0 (0.0%) | 0 (0.0%) |
| $15,000 to $17,499 | 0 (0.0%) | 10 (3.0%) |
| $17,500 to $19,999 | 38 (7.4%) | 0 (0.0%) |
| $20,000 to $22,499 | 9 (1.8%) | 16 (4.8%) |
| $22,500 to $24,999 | 0 (0.0%) | 16 (4.8%) |
| $25,000 to $29,999 | 28 (5.5%) | 47 (14.1%) |
| $30,000 to $34,999 | 43 (8.4%) | 37 (11.1%) |
| $35,000 to $39,999 | 37 (7.2%) | 21 (6.3%) |
| $40,000 to $44,999 | 39 (7.6%) | 23 (6.9%) |
| $45,000 to $49,999 | 28 (5.5%) | 41 (12.3%) |
| $50,000 to $54,999 | 35 (6.9%) | 14 (4.2%) |
| $55,000 to $64,999 | 29 (5.7%) | 4 (1.2%) |
| $65,000 to $74,999 | 14 (2.7%) | 12 (3.6%) |
| $75,000 to $99,999 | 65 (12.7%) | 39 (11.7%) |
| $100,000+ | 26 (5.1%) | 0 (0.0%) |
| Total | 511 (100.0%) | 333 (100.0%) |
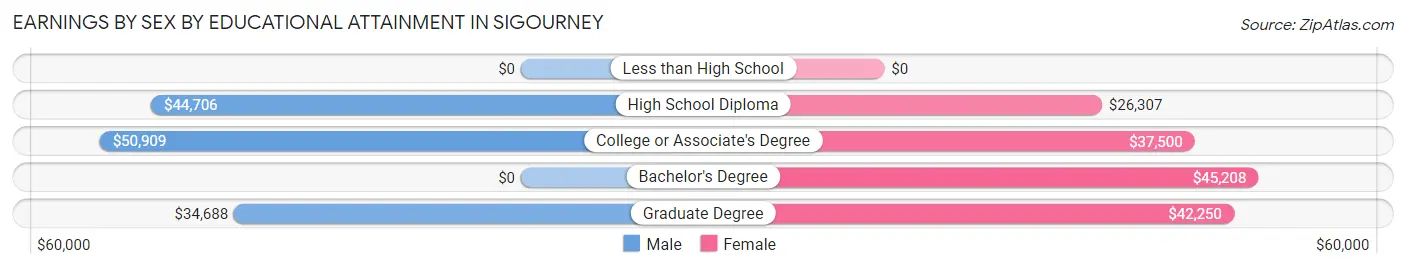
Earnings by Sex by Educational Attainment in Sigourney
Average earnings in Sigourney are $43,843 for men and $33,958 for women, a difference of 22.6%. Men with an educational attainment of college or associate's degree enjoy the highest average annual earnings of $50,909, while those with graduate degree education earn the least with $34,688. Women with an educational attainment of bachelor's degree earn the most with the average annual earnings of $45,208, while those with high school diploma education have the smallest earnings of $26,307.
| Educational Attainment | Male Income | Female Income |
| Less than High School | - | - |
| High School Diploma | $44,706 | $26,307 |
| College or Associate's Degree | $50,909 | $37,500 |
| Bachelor's Degree | - | - |
| Graduate Degree | $34,688 | $42,250 |
| Total | $43,843 | $33,958 |
Family Income in Sigourney
Family Income Brackets in Sigourney
According to the Sigourney family income data, there are 123 families falling into the $50,000 to $74,999 income range, which is the most common income bracket and makes up 26.0% of all families. Conversely, the $200,000+ income bracket is the least frequent group with only 6 families (1.3%) belonging to this category.
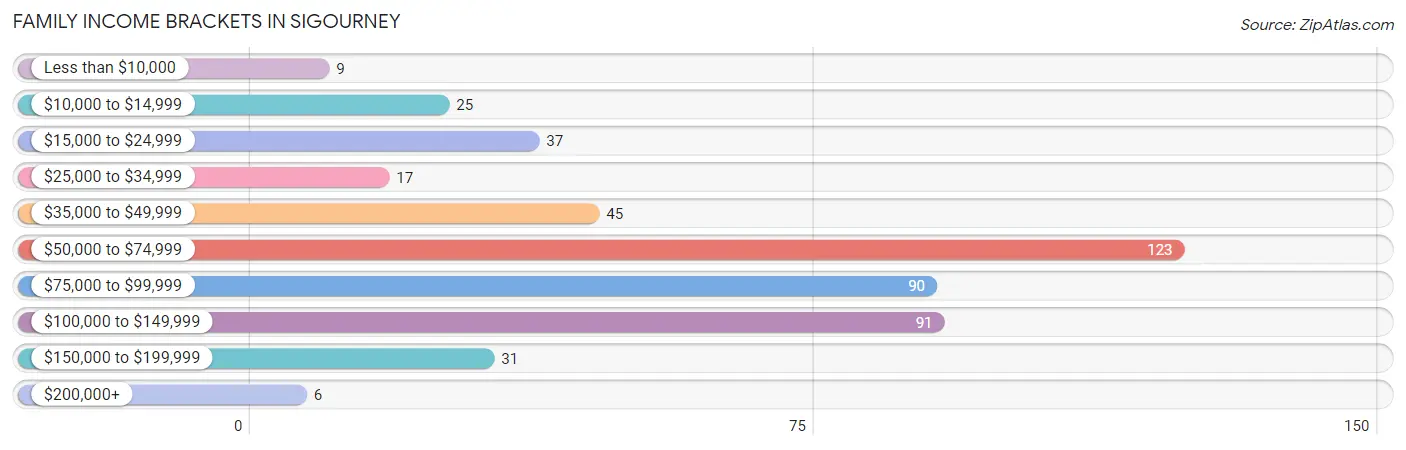
| Income Bracket | # Families | % Families |
| Less than $10,000 | 9 | 1.9% |
| $10,000 to $14,999 | 25 | 5.3% |
| $15,000 to $24,999 | 37 | 7.8% |
| $25,000 to $34,999 | 17 | 3.6% |
| $35,000 to $49,999 | 45 | 9.5% |
| $50,000 to $74,999 | 123 | 25.9% |
| $75,000 to $99,999 | 90 | 19.0% |
| $100,000 to $149,999 | 91 | 19.2% |
| $150,000 to $199,999 | 31 | 6.5% |
| $200,000+ | 6 | 1.3% |
Family Income by Famaliy Size in Sigourney
5-person families (20 | 4.2%) account for the highest median family income in Sigourney with $151,250 per family, while 3-person families (57 | 12.0%) have the highest median income of $34,184 per family member.
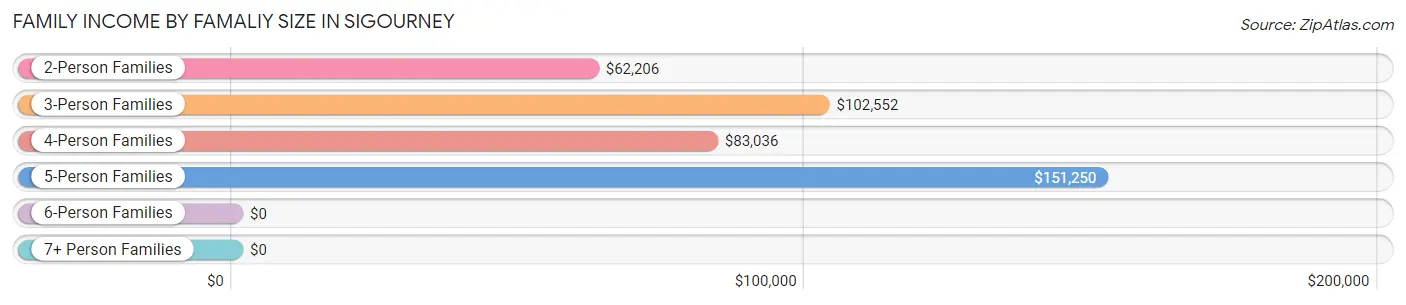
| Income Bracket | # Families | Median Income |
| 2-Person Families | 340 (71.7%) | $62,206 |
| 3-Person Families | 57 (12.0%) | $102,552 |
| 4-Person Families | 57 (12.0%) | $83,036 |
| 5-Person Families | 20 (4.2%) | $151,250 |
| 6-Person Families | 0 (0.0%) | $0 |
| 7+ Person Families | 0 (0.0%) | $0 |
| Total | 474 (100.0%) | $71,328 |
Family Income by Number of Earners in Sigourney
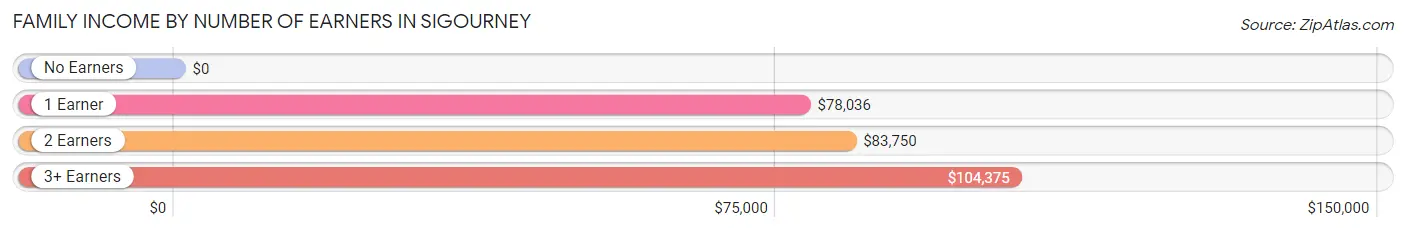
| Number of Earners | # Families | Median Income |
| No Earners | 135 (28.5%) | $0 |
| 1 Earner | 140 (29.5%) | $78,036 |
| 2 Earners | 153 (32.3%) | $83,750 |
| 3+ Earners | 46 (9.7%) | $104,375 |
| Total | 474 (100.0%) | $71,328 |
Household Income in Sigourney
Household Income Brackets in Sigourney
With 155 households falling in the category, the $50,000 to $74,999 income range is the most frequent in Sigourney, accounting for 17.7% of all households. In contrast, only 36 households (4.1%) fall into the $150,000 to $199,999 income bracket, making it the least populous group.
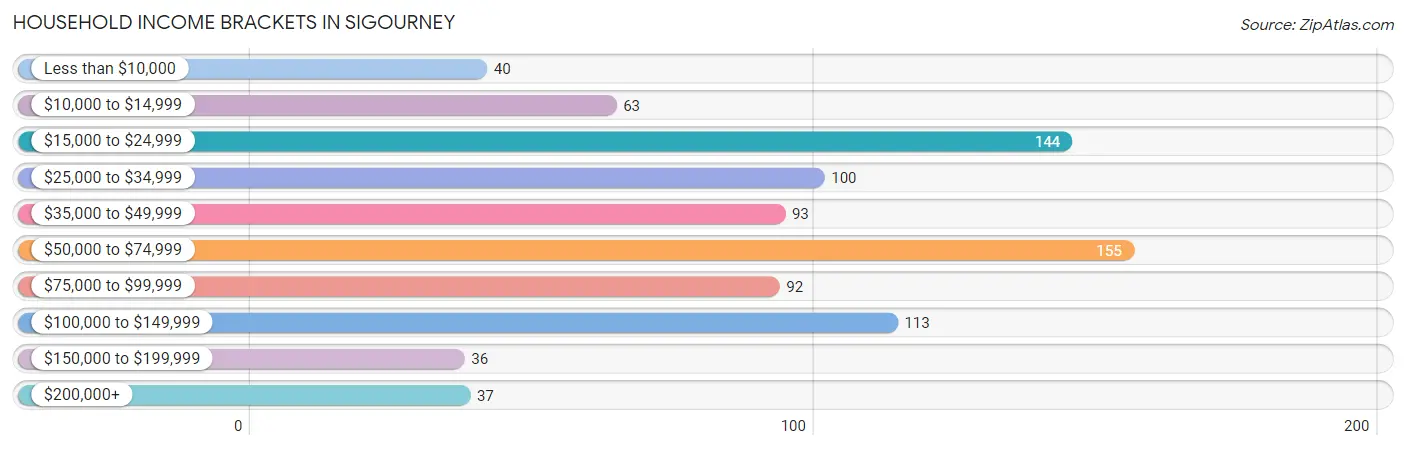
| Income Bracket | # Households | % Households |
| Less than $10,000 | 40 | 4.6% |
| $10,000 to $14,999 | 63 | 7.2% |
| $15,000 to $24,999 | 144 | 16.5% |
| $25,000 to $34,999 | 100 | 11.5% |
| $35,000 to $49,999 | 93 | 10.7% |
| $50,000 to $74,999 | 155 | 17.8% |
| $75,000 to $99,999 | 92 | 10.5% |
| $100,000 to $149,999 | 113 | 12.9% |
| $150,000 to $199,999 | 36 | 4.1% |
| $200,000+ | 37 | 4.2% |
Household Income by Householder Age in Sigourney
The median household income in Sigourney is $49,688, with the highest median household income of $62,500 found in the 25 to 44 years age bracket for the primary householder. A total of 218 households (25.0%) fall into this category. Meanwhile, the 15 to 24 years age bracket for the primary householder has the lowest median household income of $0, with 15 households (1.7%) in this group.
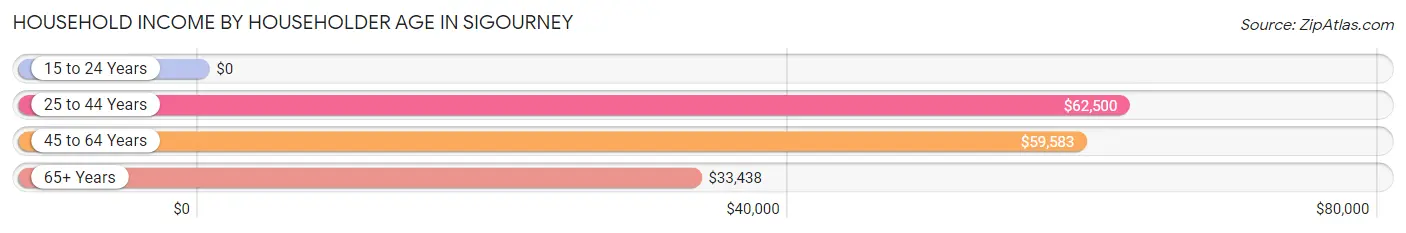
| Income Bracket | # Households | Median Income |
| 15 to 24 Years | 15 (1.7%) | $0 |
| 25 to 44 Years | 218 (25.0%) | $62,500 |
| 45 to 64 Years | 263 (30.1%) | $59,583 |
| 65+ Years | 377 (43.2%) | $33,438 |
| Total | 873 (100.0%) | $49,688 |
Poverty in Sigourney
Income Below Poverty by Sex and Age in Sigourney
With 14.6% poverty level for males and 11.8% for females among the residents of Sigourney, 6 to 11 year old males and 35 to 44 year old females are the most vulnerable to poverty, with 37 males (52.9%) and 29 females (26.6%) in their respective age groups living below the poverty level.
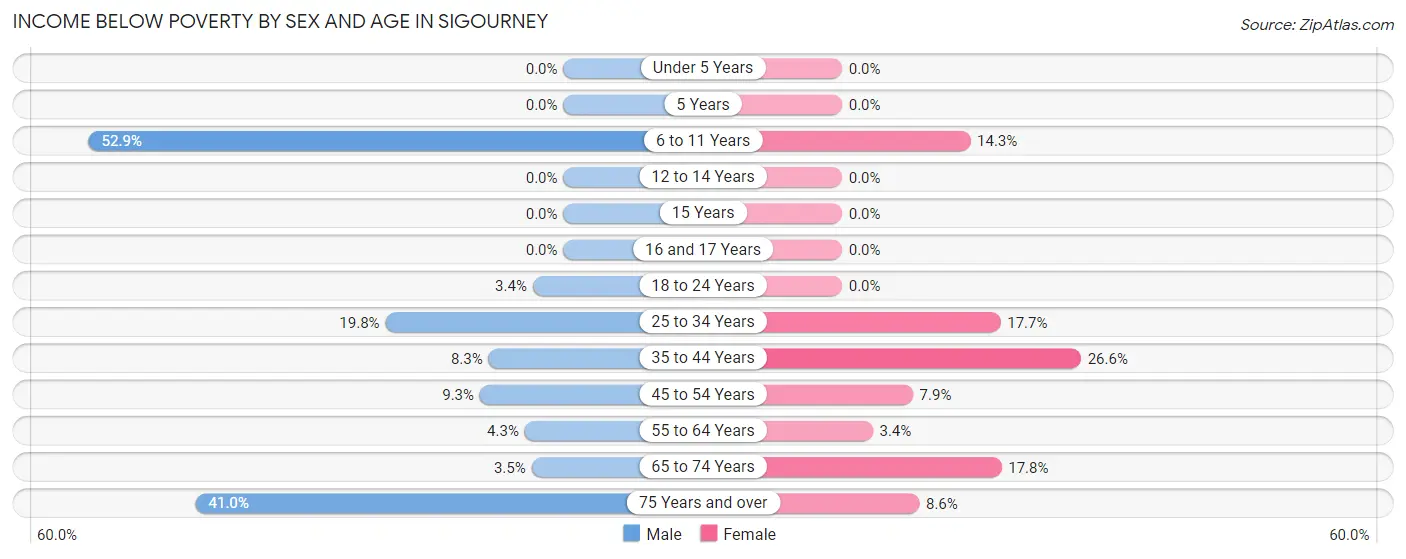
| Age Bracket | Male | Female |
| Under 5 Years | 0 (0.0%) | 0 (0.0%) |
| 5 Years | 0 (0.0%) | 0 (0.0%) |
| 6 to 11 Years | 37 (52.9%) | 6 (14.3%) |
| 12 to 14 Years | 0 (0.0%) | 0 (0.0%) |
| 15 Years | 0 (0.0%) | 0 (0.0%) |
| 16 and 17 Years | 0 (0.0%) | 0 (0.0%) |
| 18 to 24 Years | 3 (3.4%) | 0 (0.0%) |
| 25 to 34 Years | 22 (19.8%) | 15 (17.6%) |
| 35 to 44 Years | 10 (8.3%) | 29 (26.6%) |
| 45 to 54 Years | 12 (9.3%) | 6 (7.9%) |
| 55 to 64 Years | 4 (4.3%) | 4 (3.4%) |
| 65 to 74 Years | 4 (3.5%) | 19 (17.8%) |
| 75 Years and over | 43 (40.9%) | 16 (8.6%) |
| Total | 135 (14.6%) | 95 (11.8%) |
Income Above Poverty by Sex and Age in Sigourney
According to the poverty statistics in Sigourney, males aged under 5 years and females aged under 5 years are the age groups that are most secure financially, with 100.0% of males and 100.0% of females in these age groups living above the poverty line.
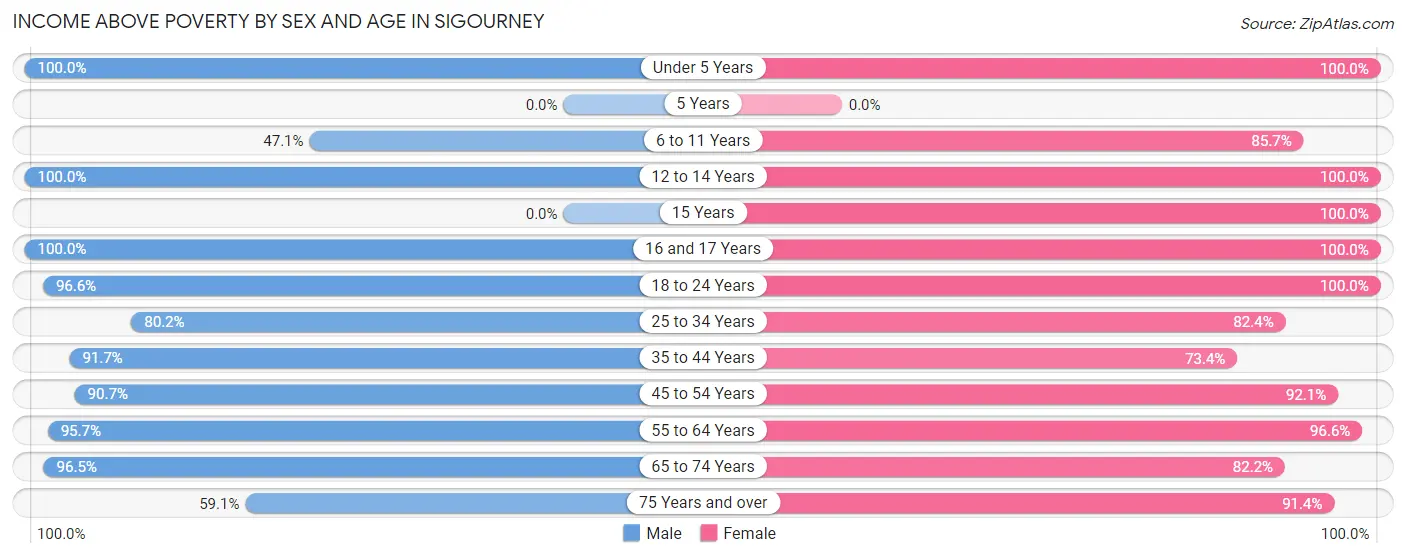
| Age Bracket | Male | Female |
| Under 5 Years | 43 (100.0%) | 14 (100.0%) |
| 5 Years | 0 (0.0%) | 0 (0.0%) |
| 6 to 11 Years | 33 (47.1%) | 36 (85.7%) |
| 12 to 14 Years | 20 (100.0%) | 21 (100.0%) |
| 15 Years | 0 (0.0%) | 12 (100.0%) |
| 16 and 17 Years | 30 (100.0%) | 16 (100.0%) |
| 18 to 24 Years | 85 (96.6%) | 21 (100.0%) |
| 25 to 34 Years | 89 (80.2%) | 70 (82.4%) |
| 35 to 44 Years | 110 (91.7%) | 80 (73.4%) |
| 45 to 54 Years | 117 (90.7%) | 70 (92.1%) |
| 55 to 64 Years | 89 (95.7%) | 113 (96.6%) |
| 65 to 74 Years | 109 (96.5%) | 88 (82.2%) |
| 75 Years and over | 62 (59.1%) | 170 (91.4%) |
| Total | 787 (85.4%) | 711 (88.2%) |
Income Below Poverty Among Married-Couple Families in Sigourney
The poverty statistics for married-couple families in Sigourney show that 10.4% or 37 of the total 355 families live below the poverty line. Families with no children have the highest poverty rate of 13.6%, comprising of 37 families. On the other hand, families with 1 or 2 children have the lowest poverty rate of 0.0%, which includes 0 families.
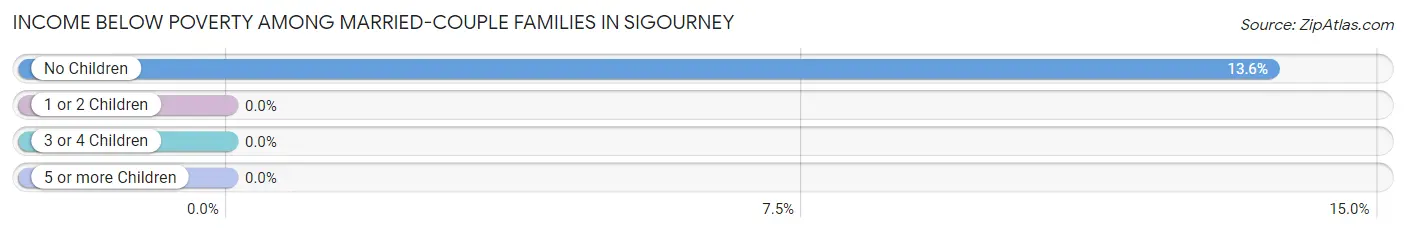
| Children | Above Poverty | Below Poverty |
| No Children | 235 (86.4%) | 37 (13.6%) |
| 1 or 2 Children | 78 (100.0%) | 0 (0.0%) |
| 3 or 4 Children | 5 (100.0%) | 0 (0.0%) |
| 5 or more Children | 0 (0.0%) | 0 (0.0%) |
| Total | 318 (89.6%) | 37 (10.4%) |
Income Below Poverty Among Single-Parent Households in Sigourney
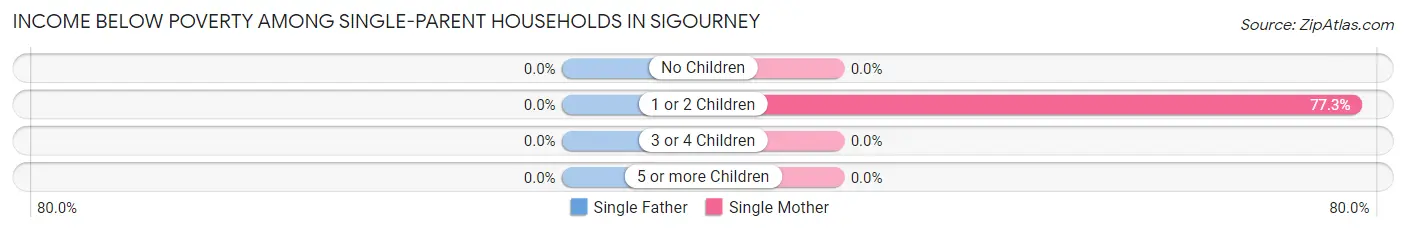
| Children | Single Father | Single Mother |
| No Children | 0 (0.0%) | 0 (0.0%) |
| 1 or 2 Children | 0 (0.0%) | 34 (77.3%) |
| 3 or 4 Children | 0 (0.0%) | 0 (0.0%) |
| 5 or more Children | 0 (0.0%) | 0 (0.0%) |
| Total | 0 (0.0%) | 34 (50.7%) |
Income Below Poverty Among Married-Couple vs Single-Parent Households in Sigourney
The poverty data for Sigourney shows that 37 of the married-couple family households (10.4%) and 34 of the single-parent households (28.6%) are living below the poverty level. Within the married-couple family households, those with no children have the highest poverty rate, with 37 households (13.6%) falling below the poverty line. Among the single-parent households, those with 1 or 2 children have the highest poverty rate, with 34 household (38.6%) living below poverty.
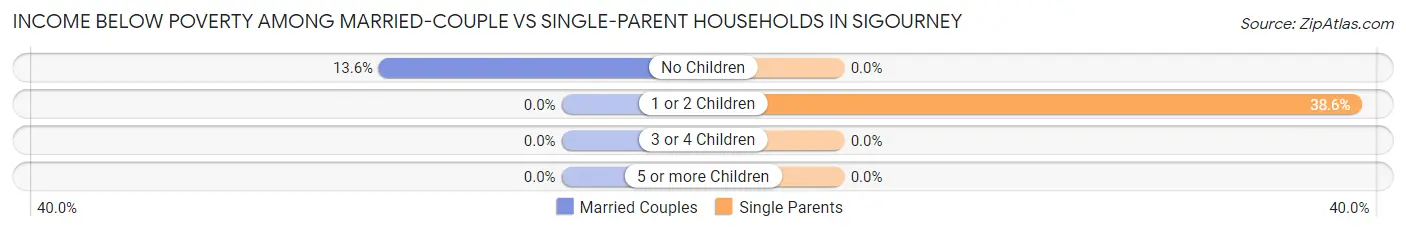
| Children | Married-Couple Families | Single-Parent Households |
| No Children | 37 (13.6%) | 0 (0.0%) |
| 1 or 2 Children | 0 (0.0%) | 34 (38.6%) |
| 3 or 4 Children | 0 (0.0%) | 0 (0.0%) |
| 5 or more Children | 0 (0.0%) | 0 (0.0%) |
| Total | 37 (10.4%) | 34 (28.6%) |
Race in Sigourney
The most populous races in Sigourney are White / Caucasian (1,787 | 97.4%), Two or more Races (22 | 1.2%), and Black / African American (19 | 1.0%).
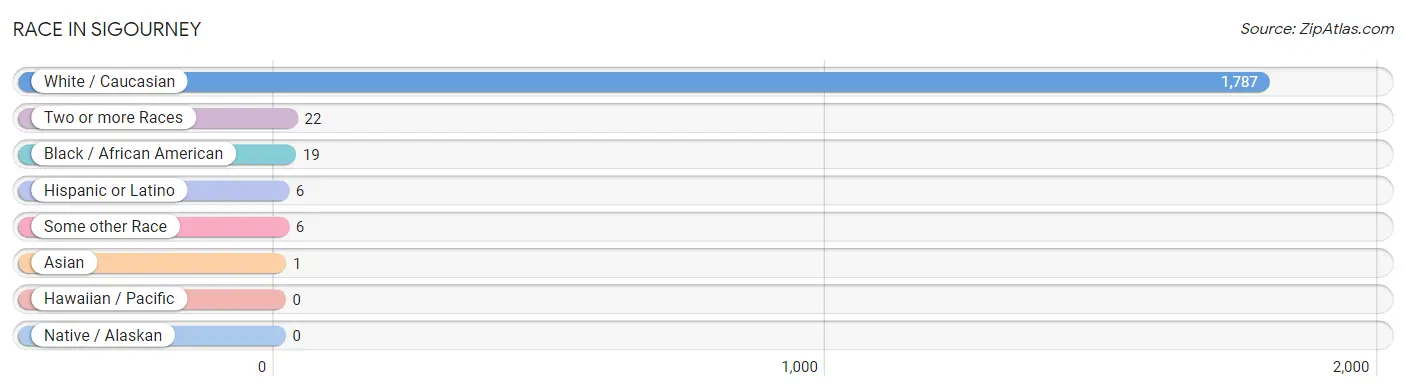
| Race | # Population | % Population |
| Asian | 1 | 0.1% |
| Black / African American | 19 | 1.0% |
| Hawaiian / Pacific | 0 | 0.0% |
| Hispanic or Latino | 6 | 0.3% |
| Native / Alaskan | 0 | 0.0% |
| White / Caucasian | 1,787 | 97.4% |
| Two or more Races | 22 | 1.2% |
| Some other Race | 6 | 0.3% |
| Total | 1,835 | 100.0% |
Ancestry in Sigourney
The most populous ancestries reported in Sigourney are German (635 | 34.6%), Irish (191 | 10.4%), American (168 | 9.2%), English (133 | 7.2%), and Dutch (74 | 4.0%), together accounting for 65.4% of all Sigourney residents.
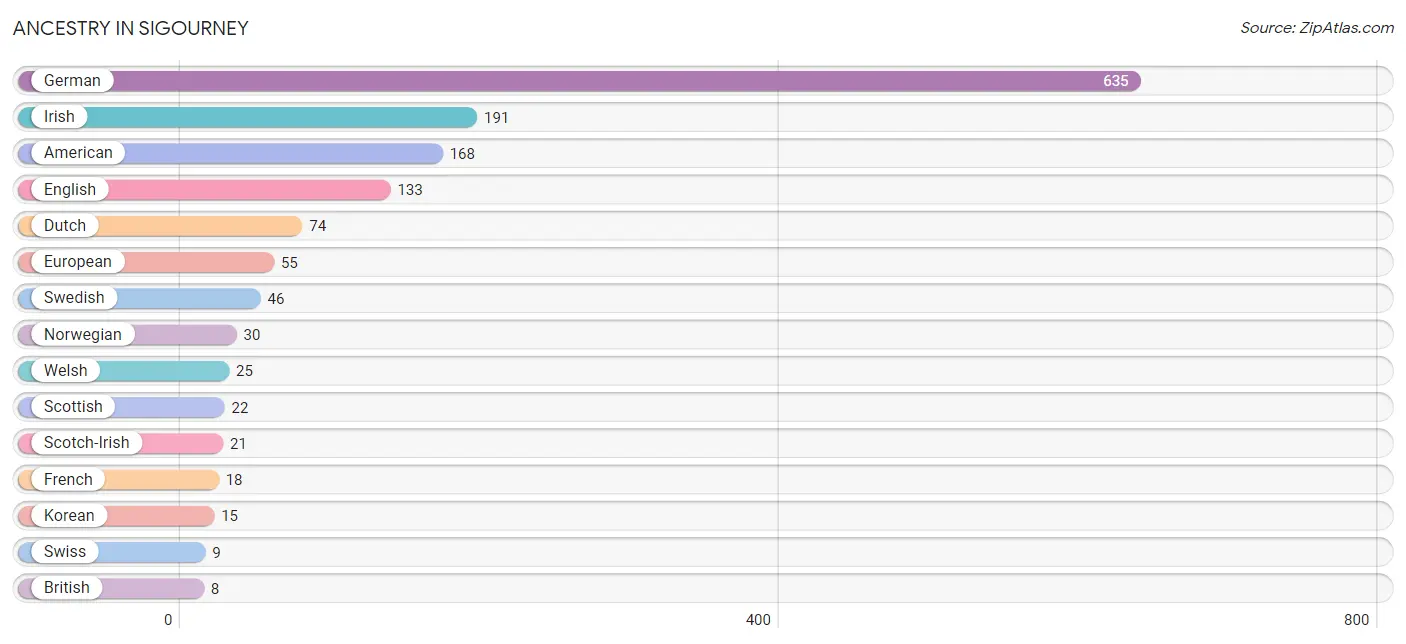
| Ancestry | # Population | % Population |
| American | 168 | 9.2% |
| Austrian | 7 | 0.4% |
| Belgian | 5 | 0.3% |
| British | 8 | 0.4% |
| Canadian | 6 | 0.3% |
| Danish | 8 | 0.4% |
| Dutch | 74 | 4.0% |
| English | 133 | 7.2% |
| European | 55 | 3.0% |
| French | 18 | 1.0% |
| German | 635 | 34.6% |
| Irish | 191 | 10.4% |
| Korean | 15 | 0.8% |
| Liberian | 1 | 0.1% |
| Mexican | 6 | 0.3% |
| Norwegian | 30 | 1.6% |
| Scotch-Irish | 21 | 1.1% |
| Scottish | 22 | 1.2% |
| Subsaharan African | 5 | 0.3% |
| Swedish | 46 | 2.5% |
| Swiss | 9 | 0.5% |
| Ukrainian | 8 | 0.4% |
| Welsh | 25 | 1.4% |
| West Indian | 3 | 0.2% | View All 24 Rows |
Immigrants in Sigourney
The most numerous immigrant groups reported in Sigourney came from Latin America (14 | 0.8%), Barbados (8 | 0.4%), Caribbean (8 | 0.4%), Central America (6 | 0.3%), and Mexico (6 | 0.3%), together accounting for 2.3% of all Sigourney residents.
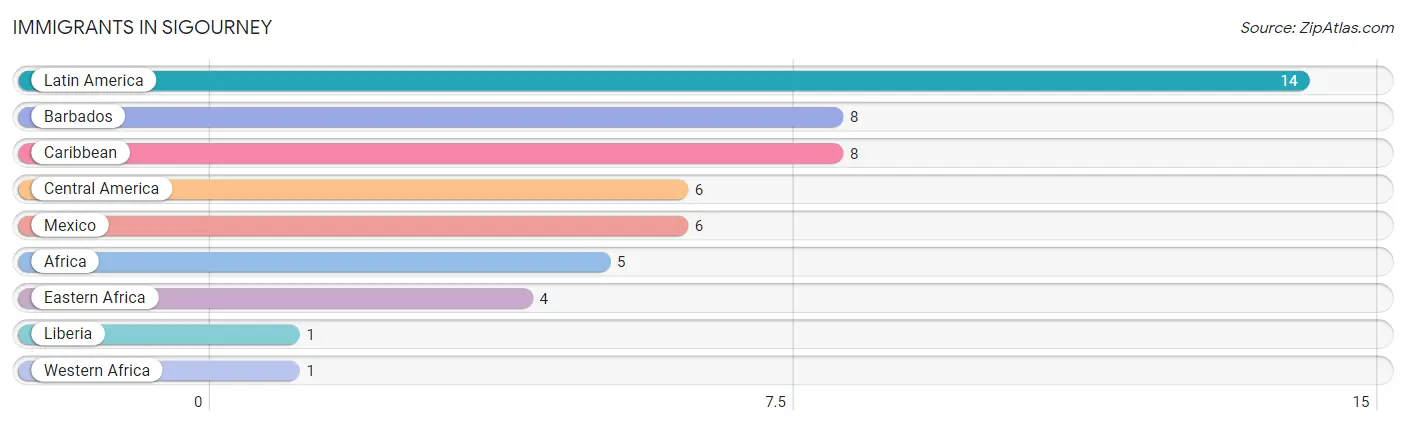
| Immigration Origin | # Population | % Population |
| Africa | 5 | 0.3% |
| Barbados | 8 | 0.4% |
| Caribbean | 8 | 0.4% |
| Central America | 6 | 0.3% |
| Eastern Africa | 4 | 0.2% |
| Latin America | 14 | 0.8% |
| Liberia | 1 | 0.1% |
| Mexico | 6 | 0.3% |
| Western Africa | 1 | 0.1% | View All 9 Rows |
Sex and Age in Sigourney
Sex and Age in Sigourney
The most populous age groups in Sigourney are 65 to 69 Years (97 | 10.1%) for men and 85 Years and over (120 | 13.8%) for women.
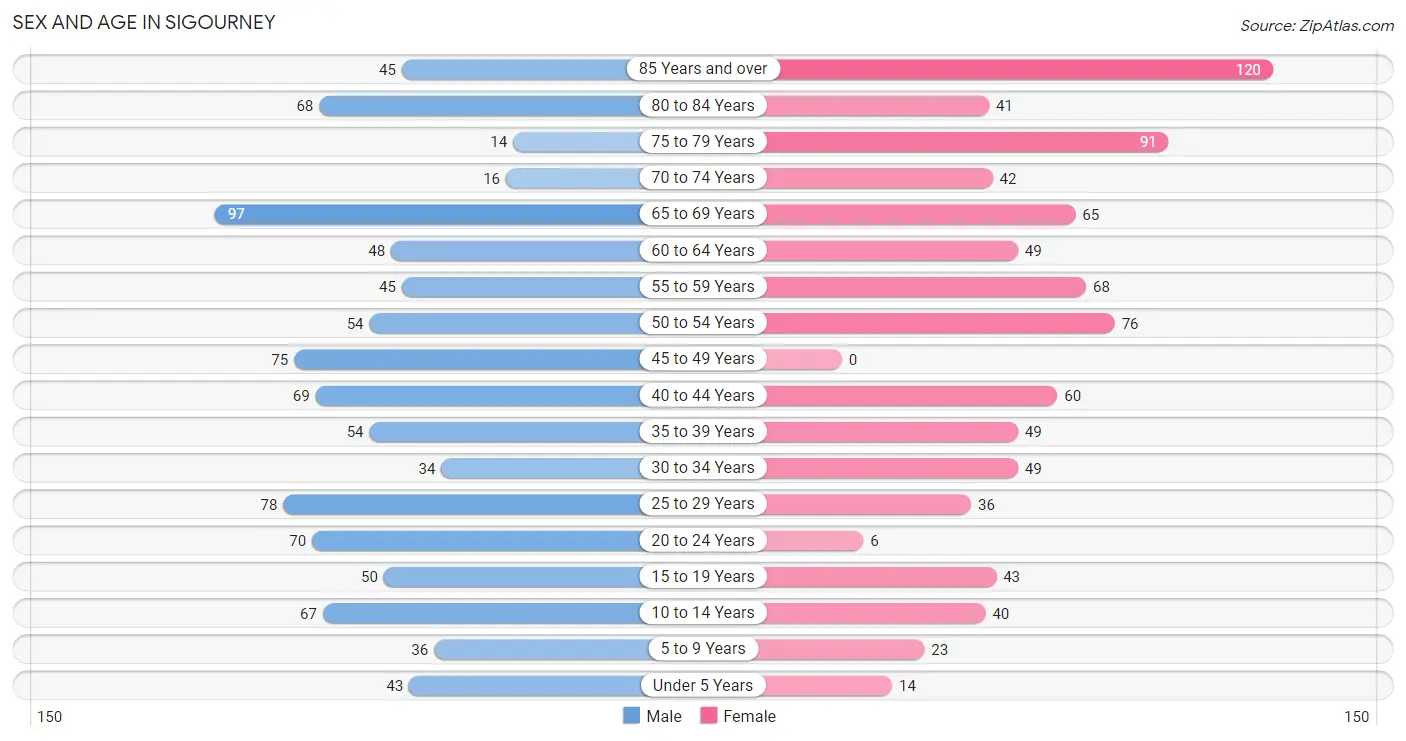
| Age Bracket | Male | Female |
| Under 5 Years | 43 (4.5%) | 14 (1.6%) |
| 5 to 9 Years | 36 (3.7%) | 23 (2.6%) |
| 10 to 14 Years | 67 (7.0%) | 40 (4.6%) |
| 15 to 19 Years | 50 (5.2%) | 43 (4.9%) |
| 20 to 24 Years | 70 (7.3%) | 6 (0.7%) |
| 25 to 29 Years | 78 (8.1%) | 36 (4.1%) |
| 30 to 34 Years | 34 (3.5%) | 49 (5.6%) |
| 35 to 39 Years | 54 (5.6%) | 49 (5.6%) |
| 40 to 44 Years | 69 (7.2%) | 60 (6.9%) |
| 45 to 49 Years | 75 (7.8%) | 0 (0.0%) |
| 50 to 54 Years | 54 (5.6%) | 76 (8.7%) |
| 55 to 59 Years | 45 (4.7%) | 68 (7.8%) |
| 60 to 64 Years | 48 (5.0%) | 49 (5.6%) |
| 65 to 69 Years | 97 (10.1%) | 65 (7.4%) |
| 70 to 74 Years | 16 (1.7%) | 42 (4.8%) |
| 75 to 79 Years | 14 (1.5%) | 91 (10.4%) |
| 80 to 84 Years | 68 (7.1%) | 41 (4.7%) |
| 85 Years and over | 45 (4.7%) | 120 (13.8%) |
| Total | 963 (100.0%) | 872 (100.0%) |
Families and Households in Sigourney
Median Family Size in Sigourney
The median family size in Sigourney is 2.64 persons per family, with single male/father families (52 | 11.0%) accounting for the largest median family size of 3 persons per family. On the other hand, single female/mother families (67 | 14.1%) represent the smallest median family size with 2.51 persons per family.
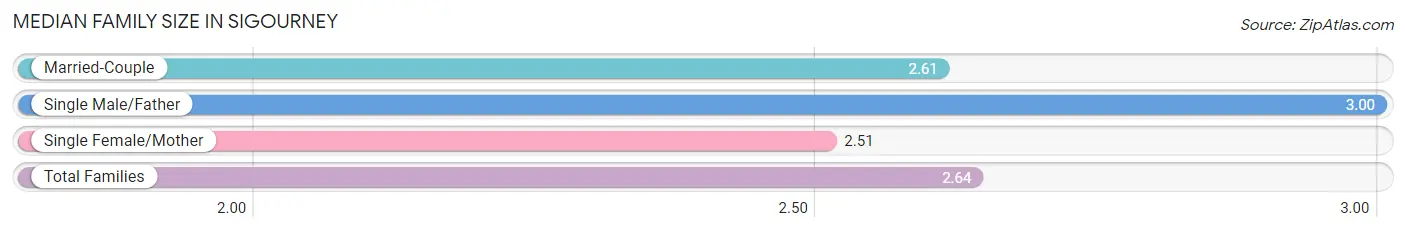
| Family Type | # Families | Family Size |
| Married-Couple | 355 (74.9%) | 2.61 |
| Single Male/Father | 52 (11.0%) | 3.00 |
| Single Female/Mother | 67 (14.1%) | 2.51 |
| Total Families | 474 (100.0%) | 2.64 |
Median Household Size in Sigourney
The median household size in Sigourney is 1.97 persons per household, with single male/father households (52 | 6.0%) accounting for the largest median household size of 3.25 persons per household. non-family households (399 | 45.7%) represent the smallest median household size with 1.10 persons per household.
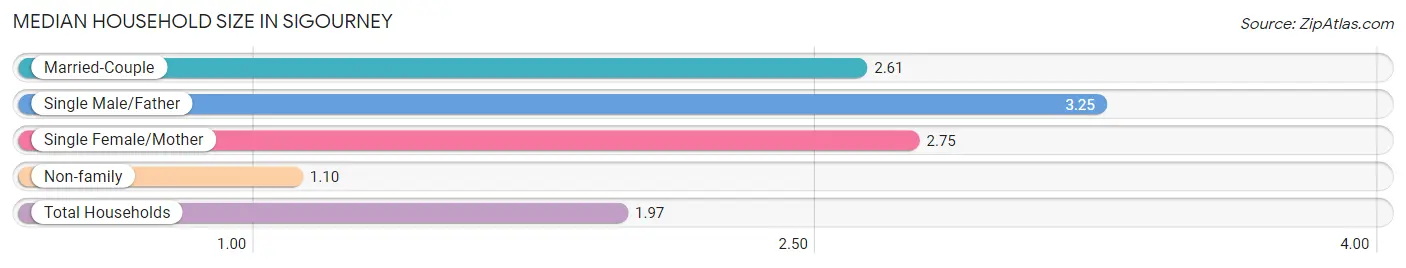
| Household Type | # Households | Household Size |
| Married-Couple | 355 (40.7%) | 2.61 |
| Single Male/Father | 52 (6.0%) | 3.25 |
| Single Female/Mother | 67 (7.7%) | 2.75 |
| Non-family | 399 (45.7%) | 1.10 |
| Total Households | 873 (100.0%) | 1.97 |
Household Size by Marriage Status in Sigourney
Out of a total of 873 households in Sigourney, 474 (54.3%) are family households, while 399 (45.7%) are nonfamily households. The most numerous type of family households are 2-person households, comprising 300, and the most common type of nonfamily households are 1-person households, comprising 364.
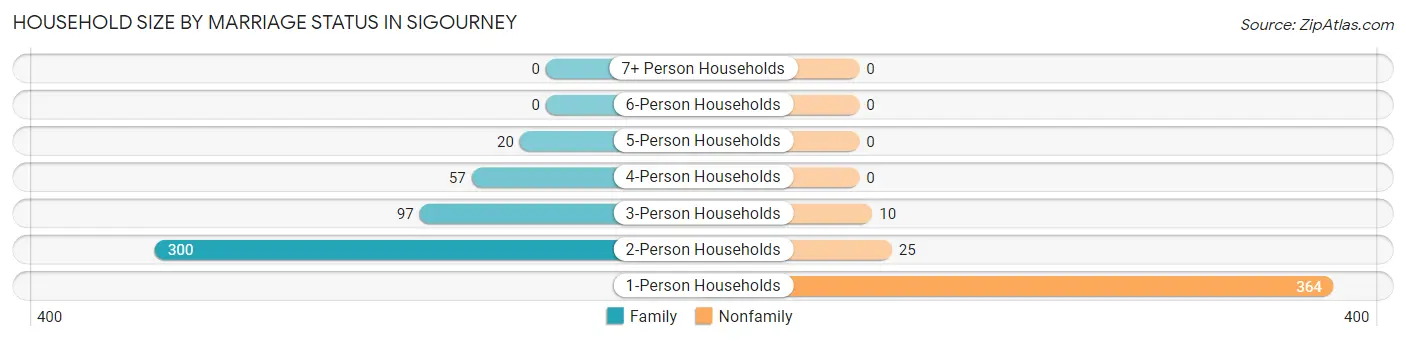
| Household Size | Family Households | Nonfamily Households |
| 1-Person Households | - | 364 (41.7%) |
| 2-Person Households | 300 (34.4%) | 25 (2.9%) |
| 3-Person Households | 97 (11.1%) | 10 (1.1%) |
| 4-Person Households | 57 (6.5%) | 0 (0.0%) |
| 5-Person Households | 20 (2.3%) | 0 (0.0%) |
| 6-Person Households | 0 (0.0%) | 0 (0.0%) |
| 7+ Person Households | 0 (0.0%) | 0 (0.0%) |
| Total | 474 (54.3%) | 399 (45.7%) |
Female Fertility in Sigourney
Fertility by Age in Sigourney
Average fertility rate in Sigourney is 62.0 births per 1,000 women. Women in the age bracket of 20 to 34 years have the highest fertility rate with 187.0 births per 1,000 women. Women in the age bracket of 20 to 34 years acount for 100.0% of all women with births.
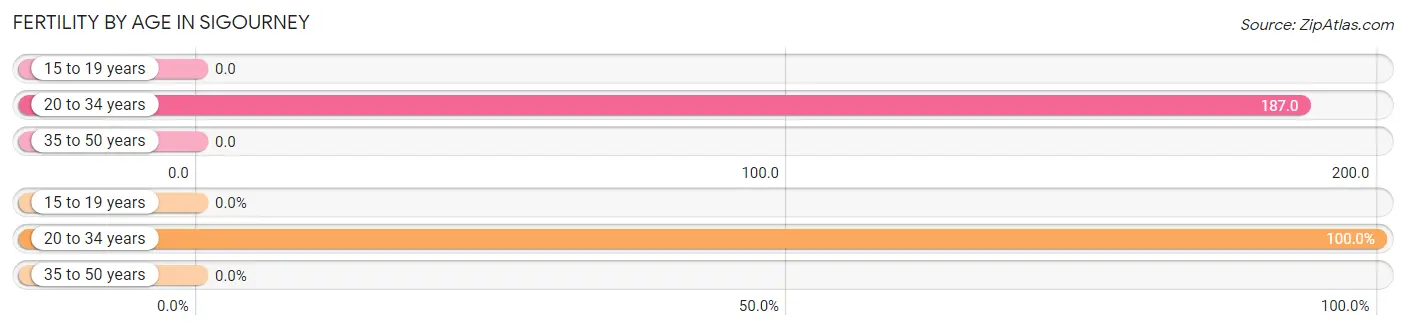
| Age Bracket | Women with Births | Births / 1,000 Women |
| 15 to 19 years | 0 (0.0%) | 0.0 |
| 20 to 34 years | 17 (100.0%) | 187.0 |
| 35 to 50 years | 0 (0.0%) | 0.0 |
| Total | 17 (100.0%) | 62.0 |
Fertility by Age by Marriage Status in Sigourney
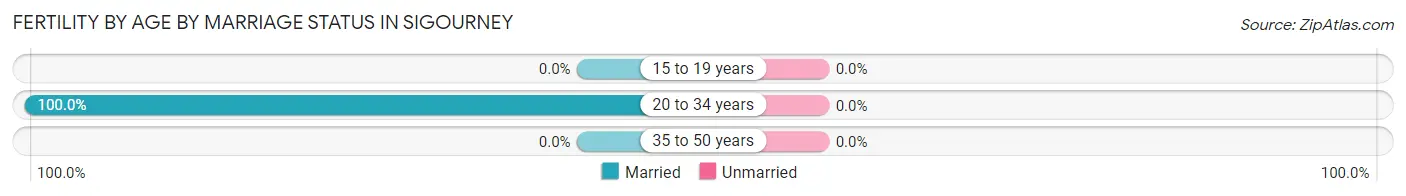
| Age Bracket | Married | Unmarried |
| 15 to 19 years | 0 (0.0%) | 0 (0.0%) |
| 20 to 34 years | 17 (100.0%) | 0 (0.0%) |
| 35 to 50 years | 0 (0.0%) | 0 (0.0%) |
| Total | 17 (100.0%) | 0 (0.0%) |
Fertility by Education in Sigourney
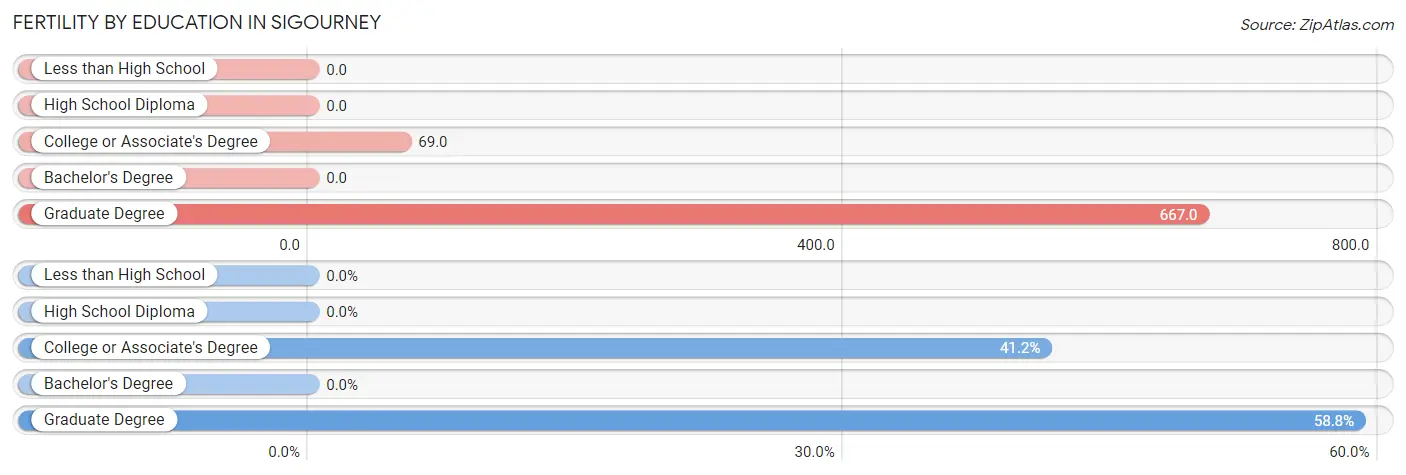
| Educational Attainment | Women with Births | Births / 1,000 Women |
| Less than High School | 0 (0.0%) | 0.0 |
| High School Diploma | 0 (0.0%) | 0.0 |
| College or Associate's Degree | 7 (41.2%) | 69.0 |
| Bachelor's Degree | 0 (0.0%) | 0.0 |
| Graduate Degree | 10 (58.8%) | 667.0 |
| Total | 17 (100.0%) | 62.0 |
Fertility by Education by Marriage Status in Sigourney
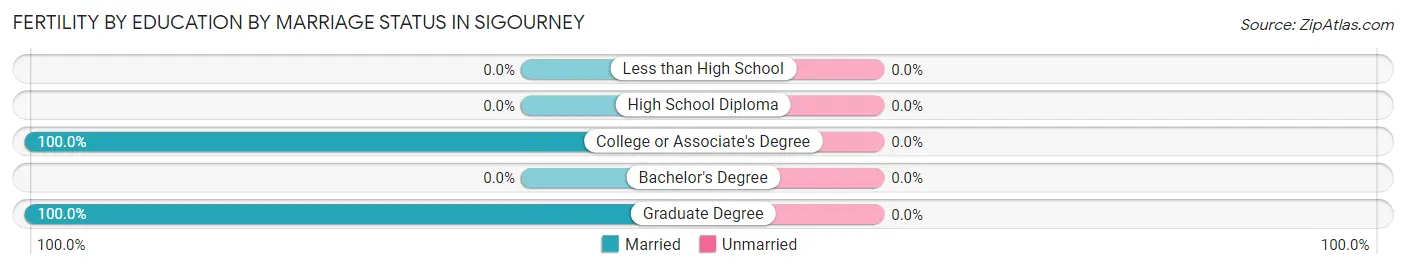
| Educational Attainment | Married | Unmarried |
| Less than High School | 0 (0.0%) | 0 (0.0%) |
| High School Diploma | 0 (0.0%) | 0 (0.0%) |
| College or Associate's Degree | 7 (100.0%) | 0 (0.0%) |
| Bachelor's Degree | 0 (0.0%) | 0 (0.0%) |
| Graduate Degree | 10 (100.0%) | 0 (0.0%) |
| Total | 17 (100.0%) | 0 (0.0%) |
Employment Characteristics in Sigourney
Employment by Class of Employer in Sigourney
Among the 796 employed individuals in Sigourney, private company employees (533 | 67.0%), self-employed (not incorporated) (125 | 15.7%), and not-for-profit organizations (75 | 9.4%) make up the most common classes of employment.
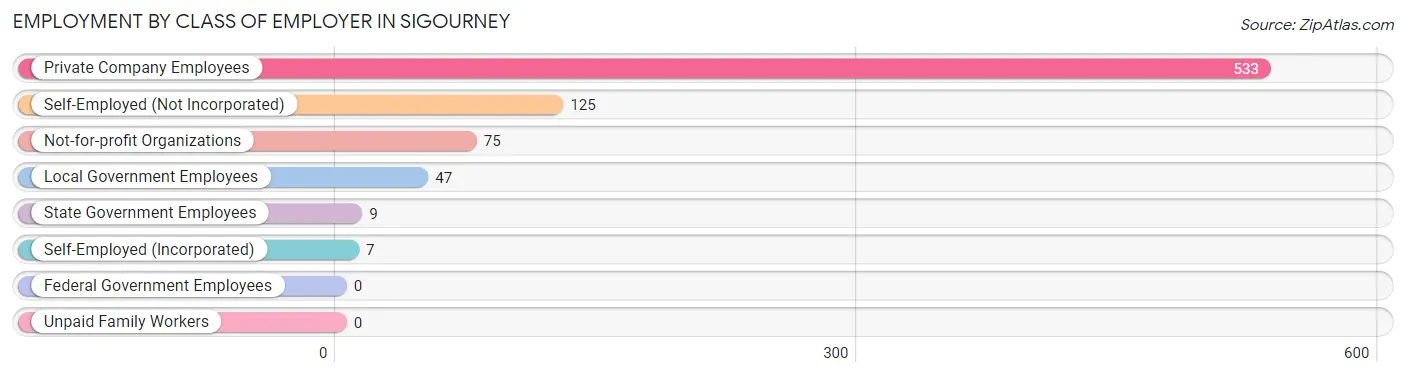
| Employer Class | # Employees | % Employees |
| Private Company Employees | 533 | 67.0% |
| Self-Employed (Incorporated) | 7 | 0.9% |
| Self-Employed (Not Incorporated) | 125 | 15.7% |
| Not-for-profit Organizations | 75 | 9.4% |
| Local Government Employees | 47 | 5.9% |
| State Government Employees | 9 | 1.1% |
| Federal Government Employees | 0 | 0.0% |
| Unpaid Family Workers | 0 | 0.0% |
| Total | 796 | 100.0% |
Employment Status by Age in Sigourney
According to the labor force statistics for Sigourney, out of the total population over 16 years of age (1,600), 51.2% or 819 individuals are in the labor force, with 1.5% or 12 of them unemployed. The age group with the highest labor force participation rate is 20 to 24 years, with 88.2% or 67 individuals in the labor force. Within the labor force, the 45 to 54 years age range has the highest percentage of unemployed individuals, with 7.1% or 12 of them being unemployed.
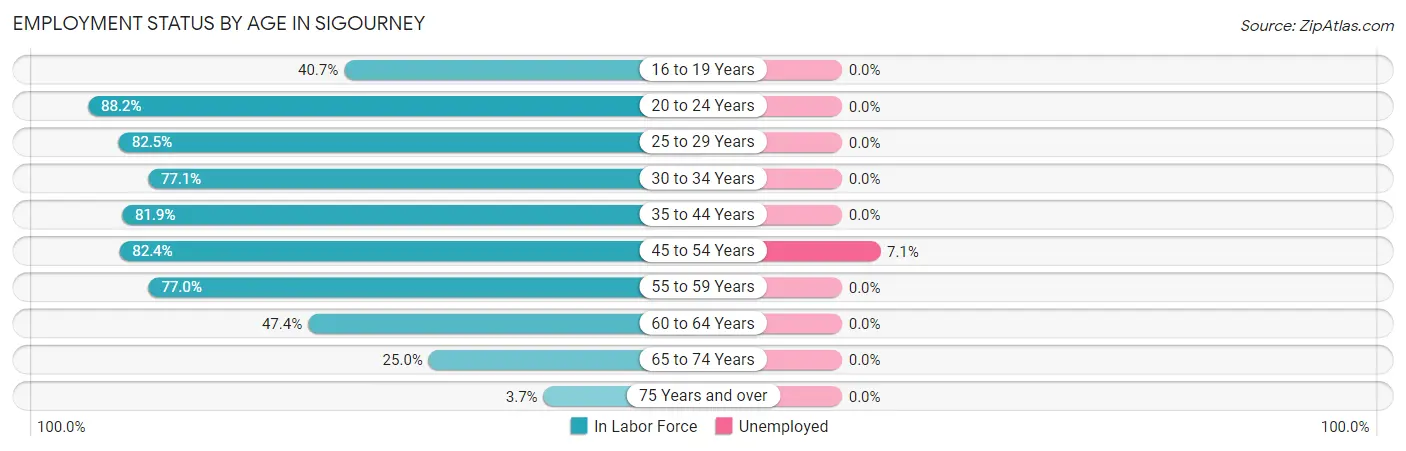
| Age Bracket | In Labor Force | Unemployed |
| 16 to 19 Years | 33 (40.7%) | 0 (0.0%) |
| 20 to 24 Years | 67 (88.2%) | 0 (0.0%) |
| 25 to 29 Years | 94 (82.5%) | 0 (0.0%) |
| 30 to 34 Years | 64 (77.1%) | 0 (0.0%) |
| 35 to 44 Years | 190 (81.9%) | 0 (0.0%) |
| 45 to 54 Years | 169 (82.4%) | 12 (7.1%) |
| 55 to 59 Years | 87 (77.0%) | 0 (0.0%) |
| 60 to 64 Years | 46 (47.4%) | 0 (0.0%) |
| 65 to 74 Years | 55 (25.0%) | 0 (0.0%) |
| 75 Years and over | 14 (3.7%) | 0 (0.0%) |
| Total | 819 (51.2%) | 12 (1.5%) |
Employment Status by Educational Attainment in Sigourney
According to labor force statistics for Sigourney, 77.0% of individuals (650) out of the total population between 25 and 64 years of age (844) are in the labor force, with 1.8% or 12 of them being unemployed. The group with the highest labor force participation rate are those with the educational attainment of bachelor's degree or higher, with 91.4% or 180 individuals in the labor force. Within the labor force, individuals with high school diploma education have the highest percentage of unemployment, with 3.9% or 7 of them being unemployed.
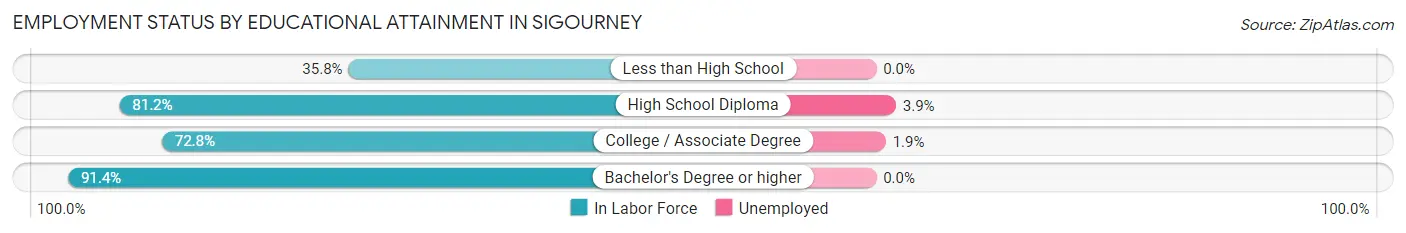
| Educational Attainment | In Labor Force | Unemployed |
| Less than High School | 19 (35.8%) | 0 (0.0%) |
| High School Diploma | 181 (81.2%) | 9 (3.9%) |
| College / Associate Degree | 270 (72.8%) | 7 (1.9%) |
| Bachelor's Degree or higher | 180 (91.4%) | 0 (0.0%) |
| Total | 650 (77.0%) | 15 (1.8%) |
Employment Occupations by Sex in Sigourney
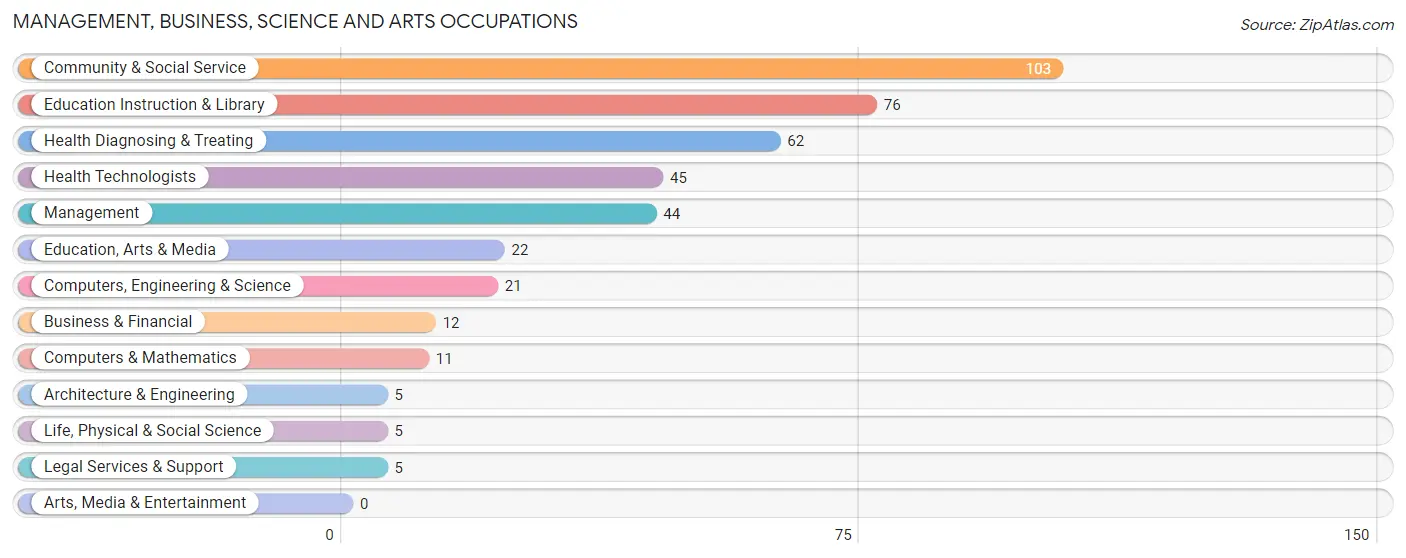
Management, Business, Science and Arts Occupations
The most common Management, Business, Science and Arts occupations in Sigourney are Community & Social Service (103 | 12.8%), Education Instruction & Library (76 | 9.4%), Health Diagnosing & Treating (62 | 7.7%), Health Technologists (45 | 5.6%), and Management (44 | 5.4%).
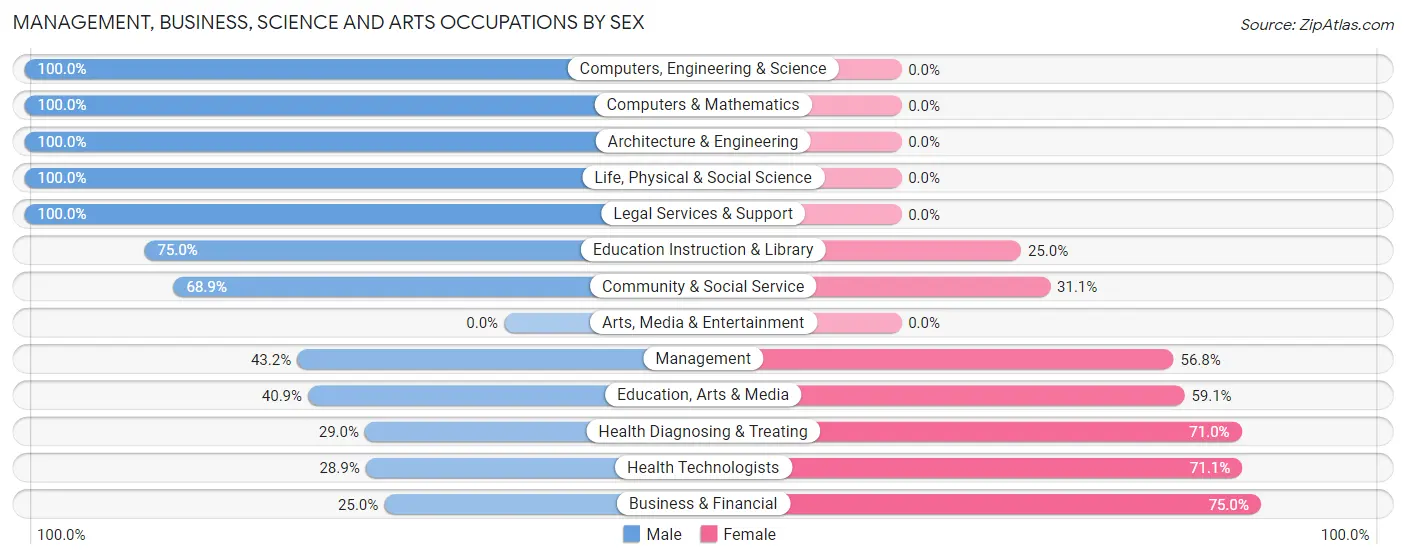
Management, Business, Science and Arts Occupations by Sex
Within the Management, Business, Science and Arts occupations in Sigourney, the most male-oriented occupations are Computers, Engineering & Science (100.0%), Computers & Mathematics (100.0%), and Architecture & Engineering (100.0%), while the most female-oriented occupations are Business & Financial (75.0%), Health Technologists (71.1%), and Health Diagnosing & Treating (71.0%).
| Occupation | Male | Female |
| Management | 19 (43.2%) | 25 (56.8%) |
| Business & Financial | 3 (25.0%) | 9 (75.0%) |
| Computers, Engineering & Science | 21 (100.0%) | 0 (0.0%) |
| Computers & Mathematics | 11 (100.0%) | 0 (0.0%) |
| Architecture & Engineering | 5 (100.0%) | 0 (0.0%) |
| Life, Physical & Social Science | 5 (100.0%) | 0 (0.0%) |
| Community & Social Service | 71 (68.9%) | 32 (31.1%) |
| Education, Arts & Media | 9 (40.9%) | 13 (59.1%) |
| Legal Services & Support | 5 (100.0%) | 0 (0.0%) |
| Education Instruction & Library | 57 (75.0%) | 19 (25.0%) |
| Arts, Media & Entertainment | 0 (0.0%) | 0 (0.0%) |
| Health Diagnosing & Treating | 18 (29.0%) | 44 (71.0%) |
| Health Technologists | 13 (28.9%) | 32 (71.1%) |
| Total (Category) | 132 (54.5%) | 110 (45.5%) |
| Total (Overall) | 490 (60.7%) | 317 (39.3%) |
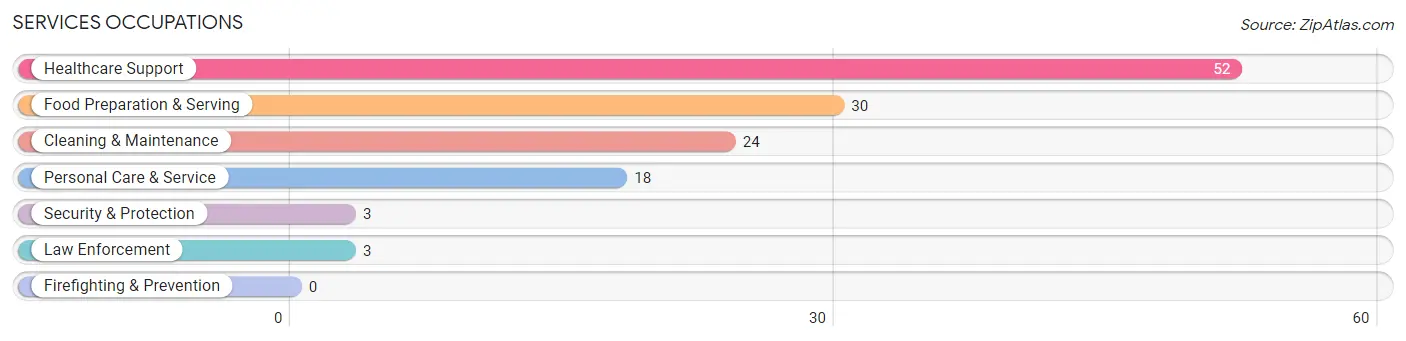
Services Occupations
The most common Services occupations in Sigourney are Healthcare Support (52 | 6.4%), Food Preparation & Serving (30 | 3.7%), Cleaning & Maintenance (24 | 3.0%), Personal Care & Service (18 | 2.2%), and Security & Protection (3 | 0.4%).
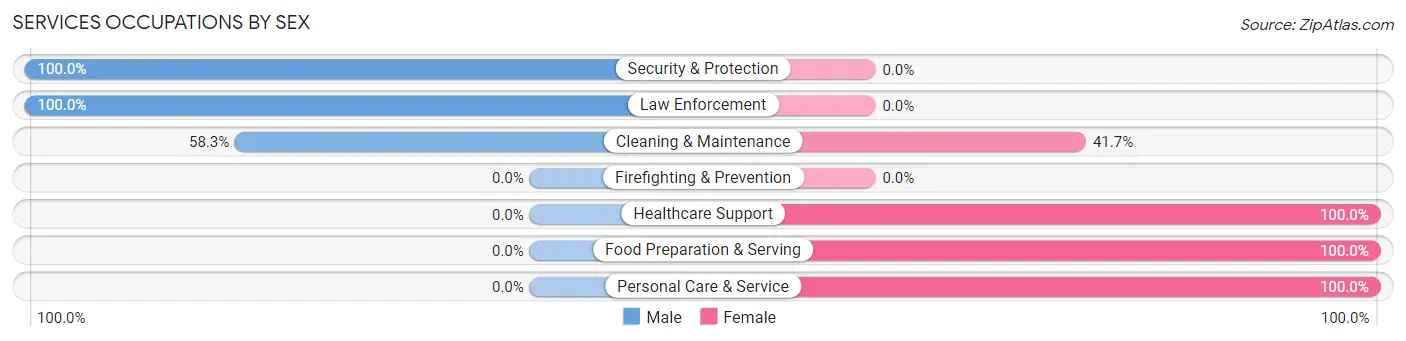
Services Occupations by Sex
Within the Services occupations in Sigourney, the most male-oriented occupations are Security & Protection (100.0%), Law Enforcement (100.0%), and Cleaning & Maintenance (58.3%), while the most female-oriented occupations are Healthcare Support (100.0%), Food Preparation & Serving (100.0%), and Personal Care & Service (100.0%).
| Occupation | Male | Female |
| Healthcare Support | 0 (0.0%) | 52 (100.0%) |
| Security & Protection | 3 (100.0%) | 0 (0.0%) |
| Firefighting & Prevention | 0 (0.0%) | 0 (0.0%) |
| Law Enforcement | 3 (100.0%) | 0 (0.0%) |
| Food Preparation & Serving | 0 (0.0%) | 30 (100.0%) |
| Cleaning & Maintenance | 14 (58.3%) | 10 (41.7%) |
| Personal Care & Service | 0 (0.0%) | 18 (100.0%) |
| Total (Category) | 17 (13.4%) | 110 (86.6%) |
| Total (Overall) | 490 (60.7%) | 317 (39.3%) |
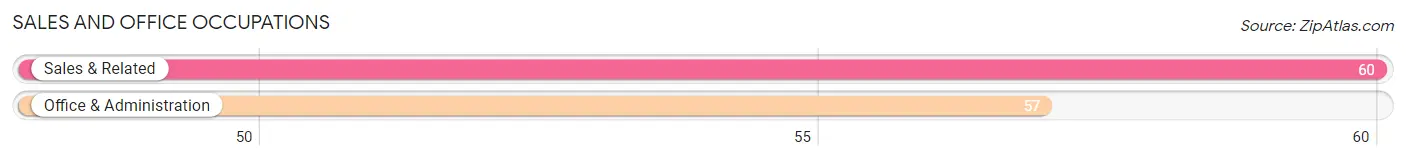
Sales and Office Occupations
The most common Sales and Office occupations in Sigourney are Sales & Related (60 | 7.4%), and Office & Administration (57 | 7.1%).
Sales and Office Occupations by Sex
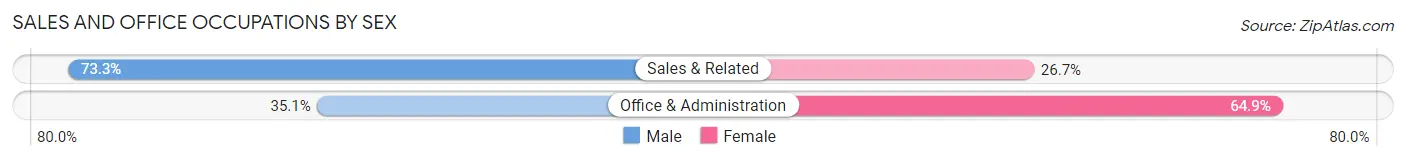
| Occupation | Male | Female |
| Sales & Related | 44 (73.3%) | 16 (26.7%) |
| Office & Administration | 20 (35.1%) | 37 (64.9%) |
| Total (Category) | 64 (54.7%) | 53 (45.3%) |
| Total (Overall) | 490 (60.7%) | 317 (39.3%) |
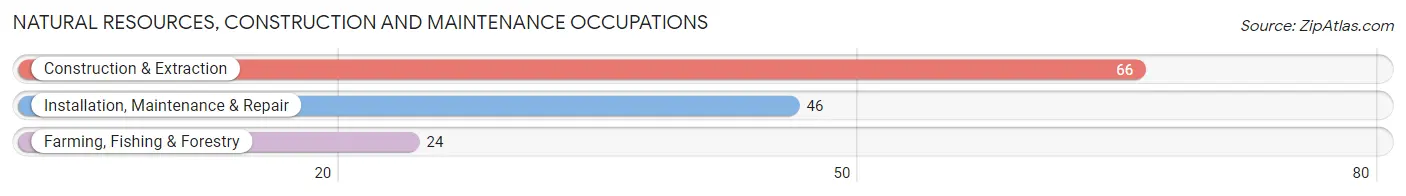
Natural Resources, Construction and Maintenance Occupations
The most common Natural Resources, Construction and Maintenance occupations in Sigourney are Construction & Extraction (66 | 8.2%), Installation, Maintenance & Repair (46 | 5.7%), and Farming, Fishing & Forestry (24 | 3.0%).
Natural Resources, Construction and Maintenance Occupations by Sex
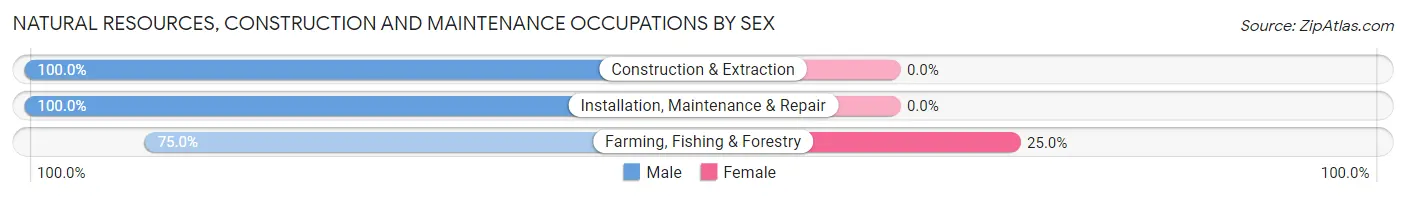
| Occupation | Male | Female |
| Farming, Fishing & Forestry | 18 (75.0%) | 6 (25.0%) |
| Construction & Extraction | 66 (100.0%) | 0 (0.0%) |
| Installation, Maintenance & Repair | 46 (100.0%) | 0 (0.0%) |
| Total (Category) | 130 (95.6%) | 6 (4.4%) |
| Total (Overall) | 490 (60.7%) | 317 (39.3%) |
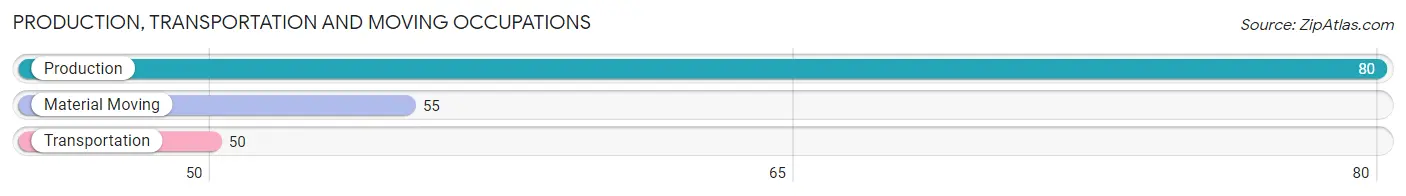
Production, Transportation and Moving Occupations
The most common Production, Transportation and Moving occupations in Sigourney are Production (80 | 9.9%), Material Moving (55 | 6.8%), and Transportation (50 | 6.2%).
Production, Transportation and Moving Occupations by Sex
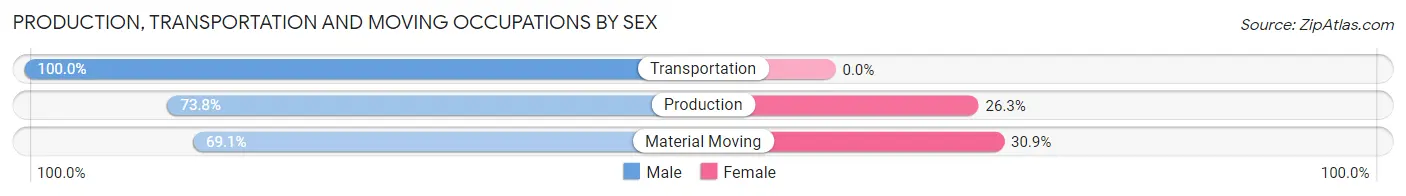
| Occupation | Male | Female |
| Production | 59 (73.8%) | 21 (26.3%) |
| Transportation | 50 (100.0%) | 0 (0.0%) |
| Material Moving | 38 (69.1%) | 17 (30.9%) |
| Total (Category) | 147 (79.5%) | 38 (20.5%) |
| Total (Overall) | 490 (60.7%) | 317 (39.3%) |
Employment Industries by Sex in Sigourney
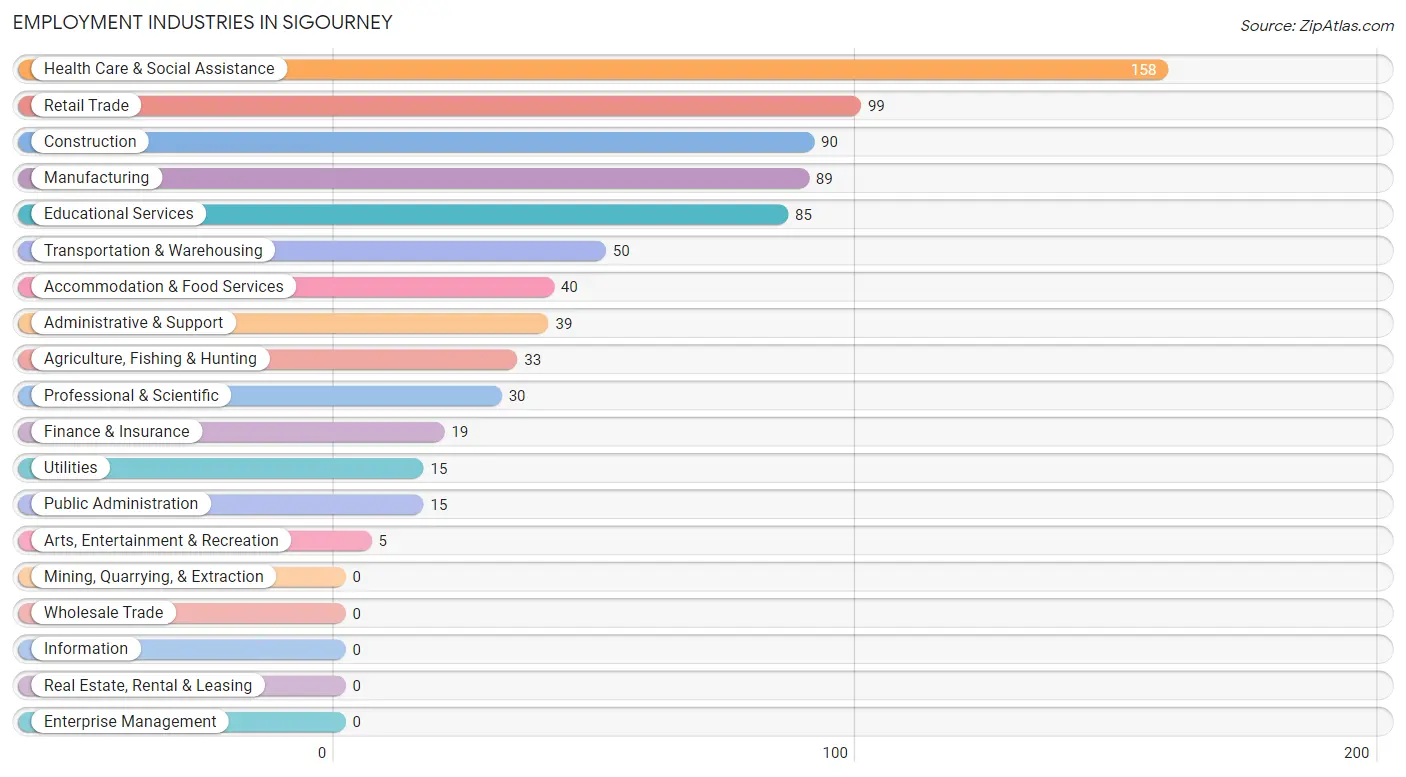
Employment Industries in Sigourney
The major employment industries in Sigourney include Health Care & Social Assistance (158 | 19.6%), Retail Trade (99 | 12.3%), Construction (90 | 11.2%), Manufacturing (89 | 11.0%), and Educational Services (85 | 10.5%).
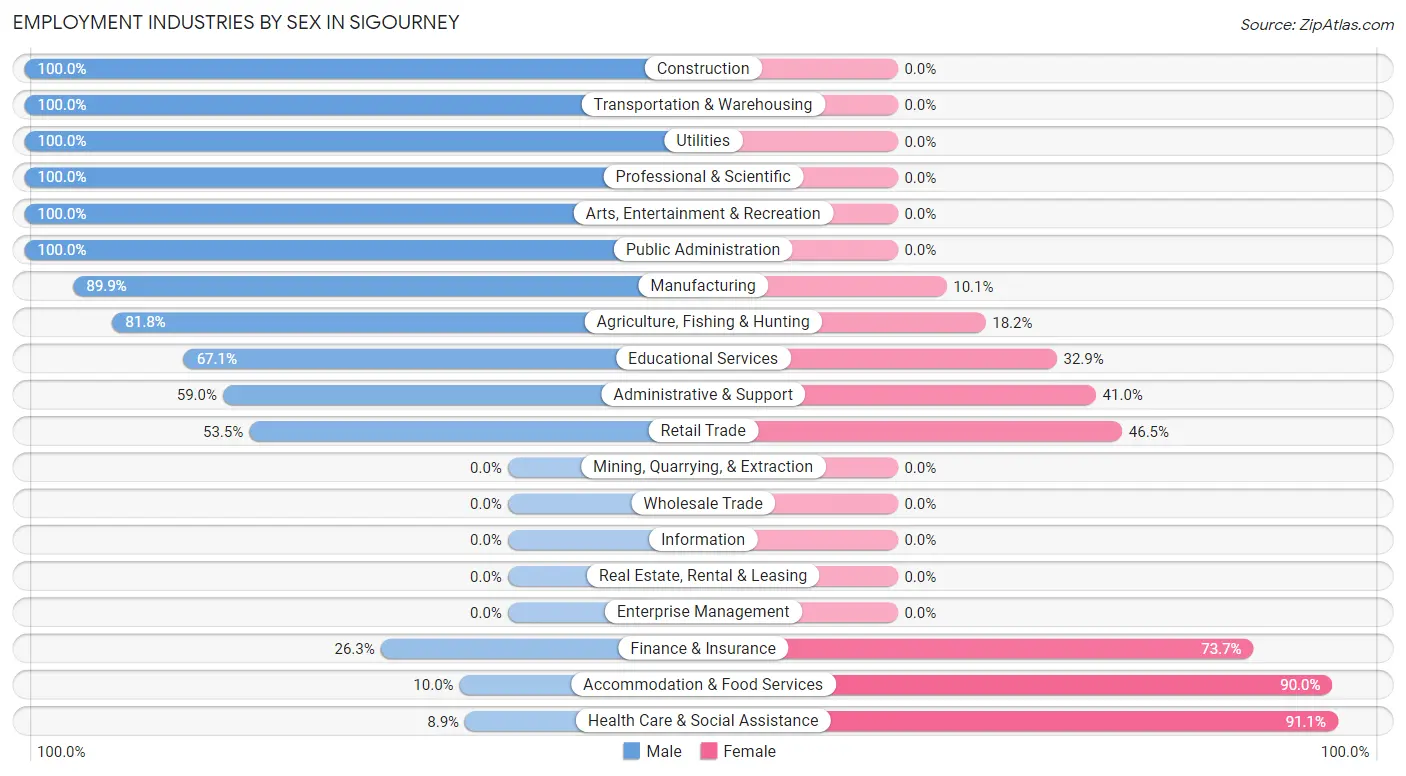
Employment Industries by Sex in Sigourney
The Sigourney industries that see more men than women are Construction (100.0%), Transportation & Warehousing (100.0%), and Utilities (100.0%), whereas the industries that tend to have a higher number of women are Health Care & Social Assistance (91.1%), Accommodation & Food Services (90.0%), and Finance & Insurance (73.7%).
| Industry | Male | Female |
| Agriculture, Fishing & Hunting | 27 (81.8%) | 6 (18.2%) |
| Mining, Quarrying, & Extraction | 0 (0.0%) | 0 (0.0%) |
| Construction | 90 (100.0%) | 0 (0.0%) |
| Manufacturing | 80 (89.9%) | 9 (10.1%) |
| Wholesale Trade | 0 (0.0%) | 0 (0.0%) |
| Retail Trade | 53 (53.5%) | 46 (46.5%) |
| Transportation & Warehousing | 50 (100.0%) | 0 (0.0%) |
| Utilities | 15 (100.0%) | 0 (0.0%) |
| Information | 0 (0.0%) | 0 (0.0%) |
| Finance & Insurance | 5 (26.3%) | 14 (73.7%) |
| Real Estate, Rental & Leasing | 0 (0.0%) | 0 (0.0%) |
| Professional & Scientific | 30 (100.0%) | 0 (0.0%) |
| Enterprise Management | 0 (0.0%) | 0 (0.0%) |
| Administrative & Support | 23 (59.0%) | 16 (41.0%) |
| Educational Services | 57 (67.1%) | 28 (32.9%) |
| Health Care & Social Assistance | 14 (8.9%) | 144 (91.1%) |
| Arts, Entertainment & Recreation | 5 (100.0%) | 0 (0.0%) |
| Accommodation & Food Services | 4 (10.0%) | 36 (90.0%) |
| Public Administration | 15 (100.0%) | 0 (0.0%) |
| Total | 490 (60.7%) | 317 (39.3%) |
Education in Sigourney
School Enrollment in Sigourney
The most common levels of schooling among the 291 students in Sigourney are middle school (95 | 32.7%), elementary school (71 | 24.4%), and high school (69 | 23.7%).
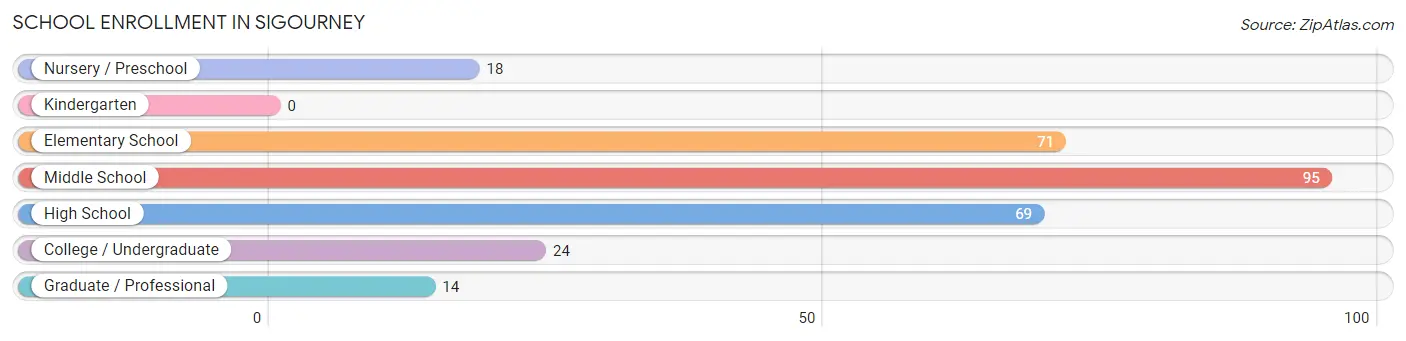
| School Level | # Students | % Students |
| Nursery / Preschool | 18 | 6.2% |
| Kindergarten | 0 | 0.0% |
| Elementary School | 71 | 24.4% |
| Middle School | 95 | 32.7% |
| High School | 69 | 23.7% |
| College / Undergraduate | 24 | 8.3% |
| Graduate / Professional | 14 | 4.8% |
| Total | 291 | 100.0% |
School Enrollment by Age by Funding Source in Sigourney
Out of a total of 291 students who are enrolled in schools in Sigourney, 8 (2.7%) attend a private institution, while the remaining 283 (97.3%) are enrolled in public schools. The age group of 35 years and over has the highest likelihood of being enrolled in private schools, with 8 (57.1% in the age bracket) enrolled. Conversely, the age group of 3 to 4 year olds has the lowest likelihood of being enrolled in a private school, with 18 (100.0% in the age bracket) attending a public institution.
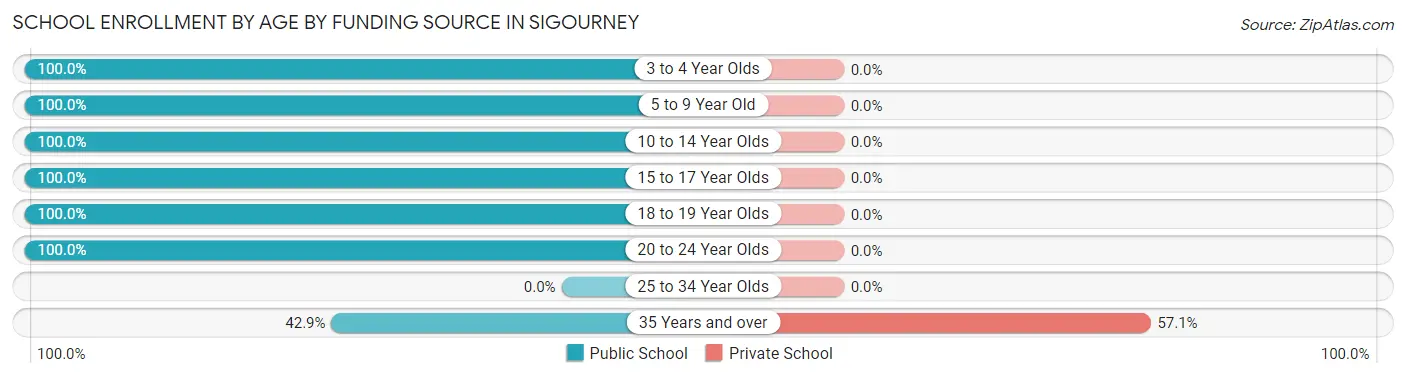
| Age Bracket | Public School | Private School |
| 3 to 4 Year Olds | 18 (100.0%) | 0 (0.0%) |
| 5 to 9 Year Old | 59 (100.0%) | 0 (0.0%) |
| 10 to 14 Year Olds | 107 (100.0%) | 0 (0.0%) |
| 15 to 17 Year Olds | 58 (100.0%) | 0 (0.0%) |
| 18 to 19 Year Olds | 13 (100.0%) | 0 (0.0%) |
| 20 to 24 Year Olds | 22 (100.0%) | 0 (0.0%) |
| 25 to 34 Year Olds | 0 (0.0%) | 0 (0.0%) |
| 35 Years and over | 6 (42.9%) | 8 (57.1%) |
| Total | 283 (97.3%) | 8 (2.7%) |
Educational Attainment by Field of Study in Sigourney
Education (75 | 22.7%), psychology (56 | 16.9%), business (43 | 13.0%), liberal arts & history (40 | 12.1%), and bio, nature & agricultural (38 | 11.5%) are the most common fields of study among 331 individuals in Sigourney who have obtained a bachelor's degree or higher.
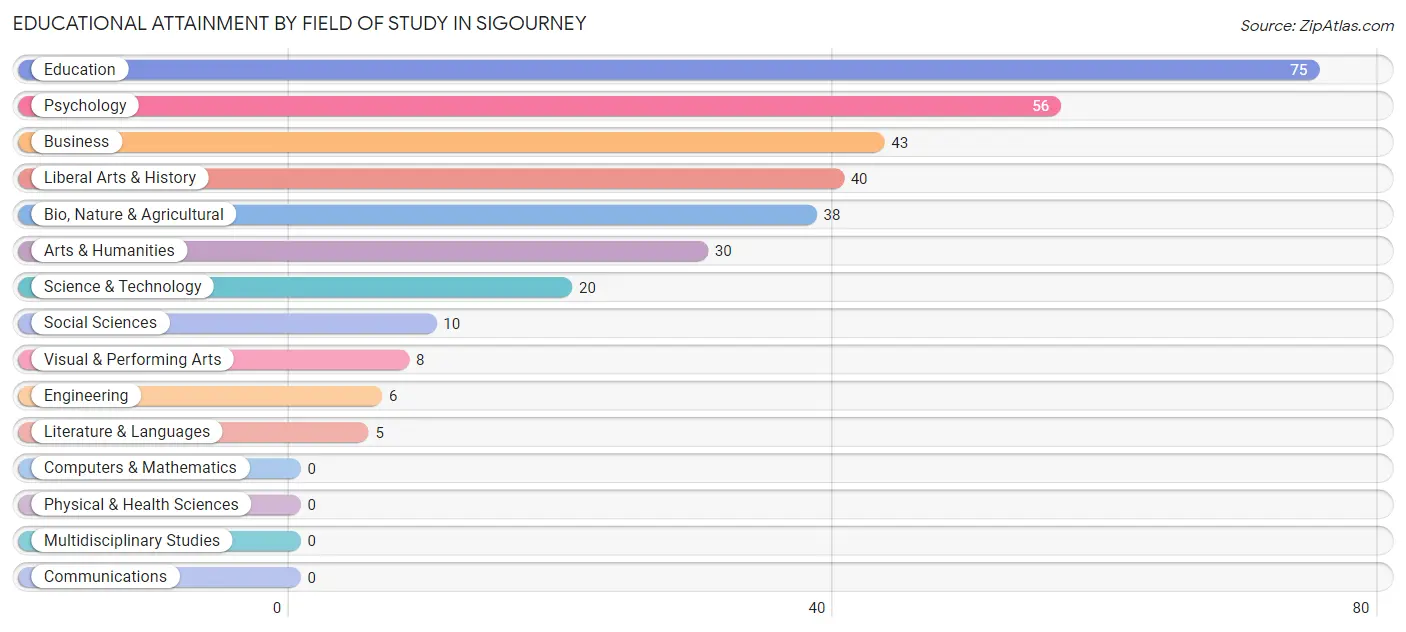
| Field of Study | # Graduates | % Graduates |
| Computers & Mathematics | 0 | 0.0% |
| Bio, Nature & Agricultural | 38 | 11.5% |
| Physical & Health Sciences | 0 | 0.0% |
| Psychology | 56 | 16.9% |
| Social Sciences | 10 | 3.0% |
| Engineering | 6 | 1.8% |
| Multidisciplinary Studies | 0 | 0.0% |
| Science & Technology | 20 | 6.0% |
| Business | 43 | 13.0% |
| Education | 75 | 22.7% |
| Literature & Languages | 5 | 1.5% |
| Liberal Arts & History | 40 | 12.1% |
| Visual & Performing Arts | 8 | 2.4% |
| Communications | 0 | 0.0% |
| Arts & Humanities | 30 | 9.1% |
| Total | 331 | 100.0% |
Transportation & Commute in Sigourney
Vehicle Availability by Sex in Sigourney
The most prevalent vehicle ownership categories in Sigourney are males with 3 vehicles (128, accounting for 27.2%) and females with 3 vehicles (71, making up 40.9%).
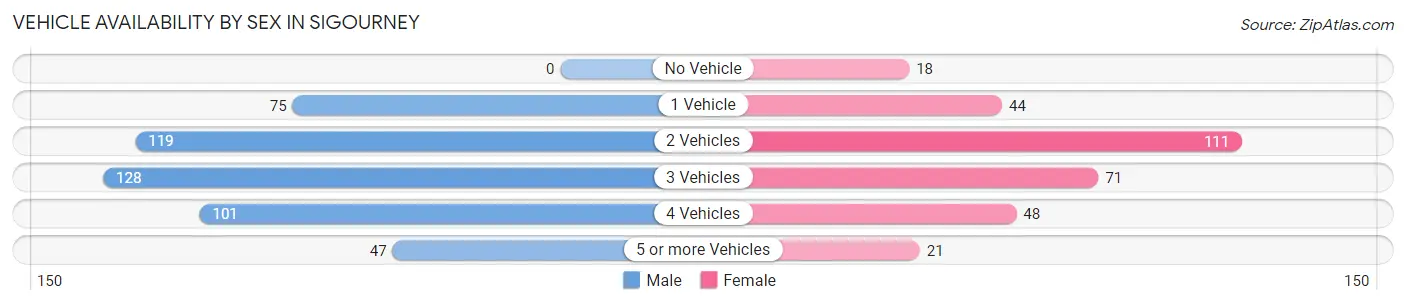
| Vehicles Available | Male | Female |
| No Vehicle | 0 (0.0%) | 18 (5.8%) |
| 1 Vehicle | 75 (16.0%) | 44 (14.1%) |
| 2 Vehicles | 119 (25.3%) | 111 (35.5%) |
| 3 Vehicles | 128 (27.2%) | 71 (22.7%) |
| 4 Vehicles | 101 (21.5%) | 48 (15.3%) |
| 5 or more Vehicles | 47 (10.0%) | 21 (6.7%) |
| Total | 470 (100.0%) | 313 (100.0%) |
Commute Time in Sigourney
The most frequently occuring commute durations in Sigourney are 5 to 9 minutes (251 commuters, 35.5%), less than 5 minutes (83 commuters, 11.7%), and 20 to 24 minutes (78 commuters, 11.0%).
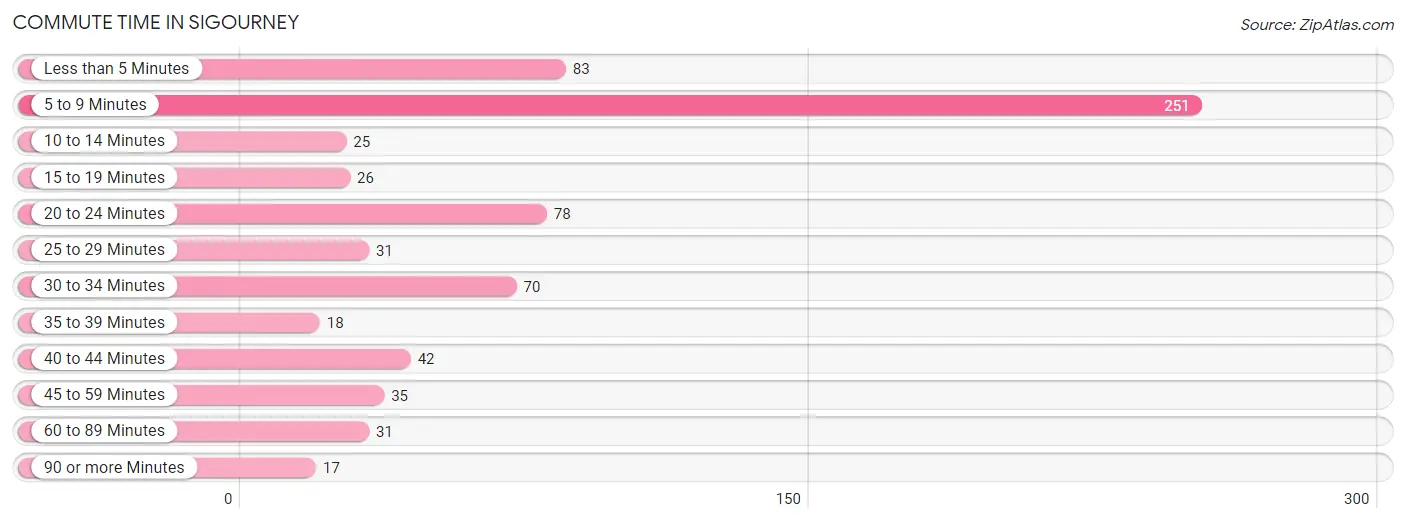
| Commute Time | # Commuters | % Commuters |
| Less than 5 Minutes | 83 | 11.7% |
| 5 to 9 Minutes | 251 | 35.5% |
| 10 to 14 Minutes | 25 | 3.5% |
| 15 to 19 Minutes | 26 | 3.7% |
| 20 to 24 Minutes | 78 | 11.0% |
| 25 to 29 Minutes | 31 | 4.4% |
| 30 to 34 Minutes | 70 | 9.9% |
| 35 to 39 Minutes | 18 | 2.5% |
| 40 to 44 Minutes | 42 | 5.9% |
| 45 to 59 Minutes | 35 | 5.0% |
| 60 to 89 Minutes | 31 | 4.4% |
| 90 or more Minutes | 17 | 2.4% |
Commute Time by Sex in Sigourney
The most common commute times in Sigourney are 5 to 9 minutes (100 commuters, 24.5%) for males and 5 to 9 minutes (151 commuters, 50.5%) for females.
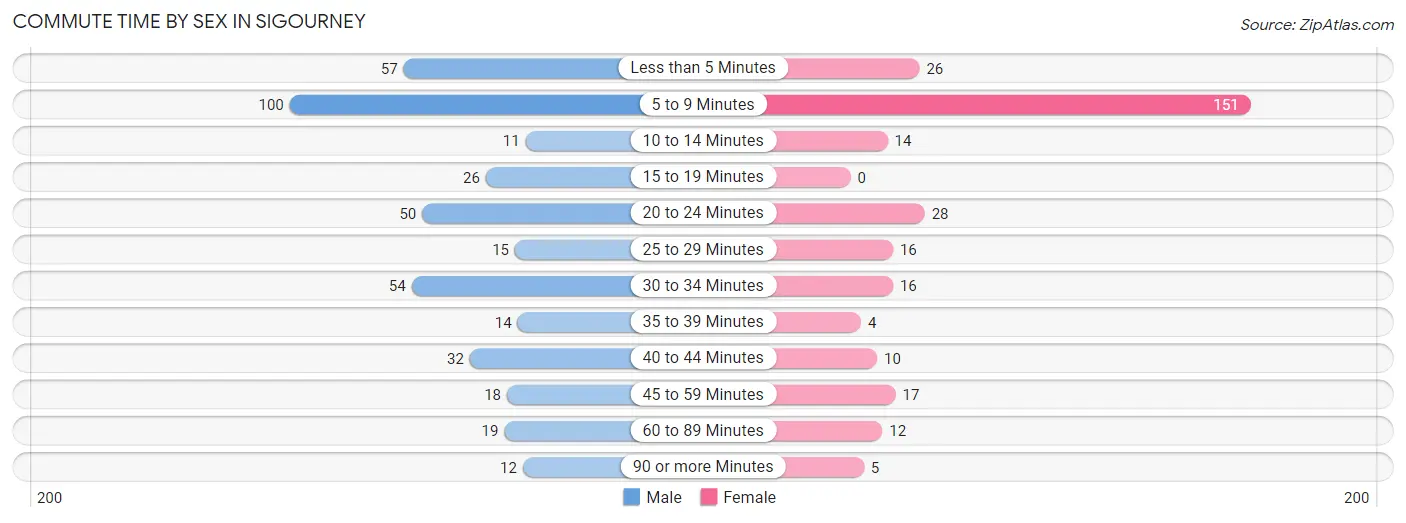
| Commute Time | Male | Female |
| Less than 5 Minutes | 57 (14.0%) | 26 (8.7%) |
| 5 to 9 Minutes | 100 (24.5%) | 151 (50.5%) |
| 10 to 14 Minutes | 11 (2.7%) | 14 (4.7%) |
| 15 to 19 Minutes | 26 (6.4%) | 0 (0.0%) |
| 20 to 24 Minutes | 50 (12.2%) | 28 (9.4%) |
| 25 to 29 Minutes | 15 (3.7%) | 16 (5.3%) |
| 30 to 34 Minutes | 54 (13.2%) | 16 (5.3%) |
| 35 to 39 Minutes | 14 (3.4%) | 4 (1.3%) |
| 40 to 44 Minutes | 32 (7.8%) | 10 (3.3%) |
| 45 to 59 Minutes | 18 (4.4%) | 17 (5.7%) |
| 60 to 89 Minutes | 19 (4.7%) | 12 (4.0%) |
| 90 or more Minutes | 12 (2.9%) | 5 (1.7%) |
Time of Departure to Work by Sex in Sigourney
The most frequent times of departure to work in Sigourney are 7:00 AM to 7:29 AM (68, 16.7%) for males and 7:30 AM to 7:59 AM (43, 14.4%) for females.
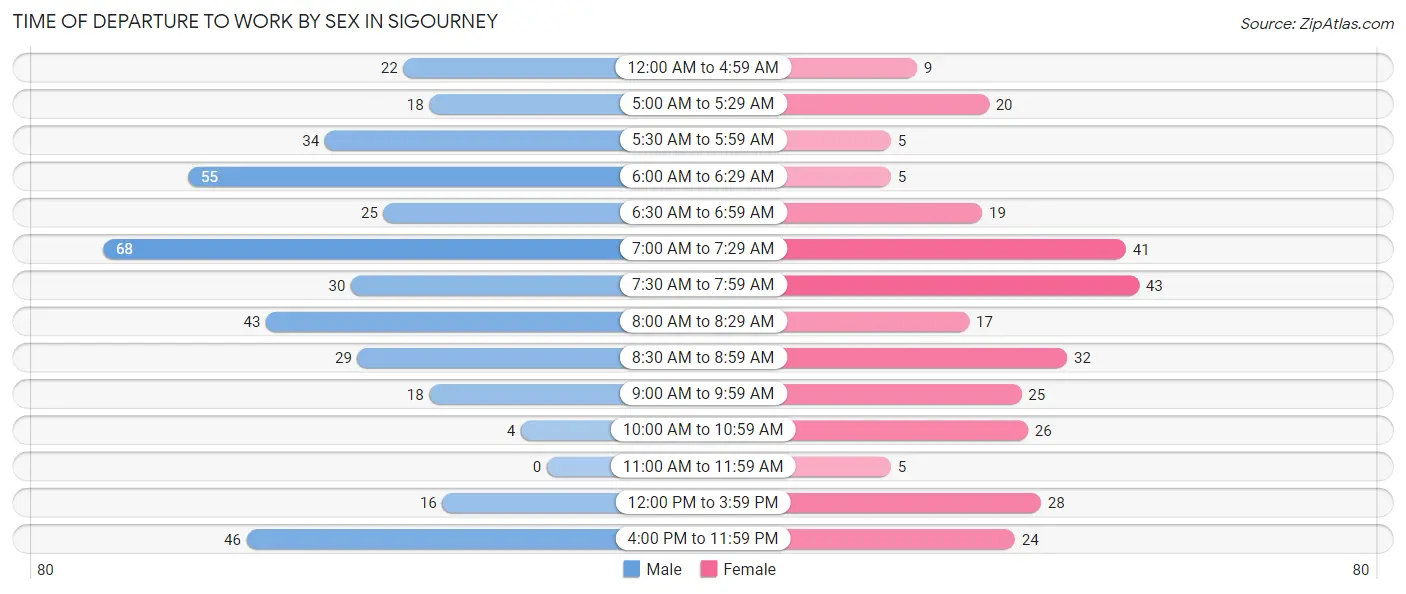
| Time of Departure | Male | Female |
| 12:00 AM to 4:59 AM | 22 (5.4%) | 9 (3.0%) |
| 5:00 AM to 5:29 AM | 18 (4.4%) | 20 (6.7%) |
| 5:30 AM to 5:59 AM | 34 (8.3%) | 5 (1.7%) |
| 6:00 AM to 6:29 AM | 55 (13.5%) | 5 (1.7%) |
| 6:30 AM to 6:59 AM | 25 (6.1%) | 19 (6.4%) |
| 7:00 AM to 7:29 AM | 68 (16.7%) | 41 (13.7%) |
| 7:30 AM to 7:59 AM | 30 (7.3%) | 43 (14.4%) |
| 8:00 AM to 8:29 AM | 43 (10.5%) | 17 (5.7%) |
| 8:30 AM to 8:59 AM | 29 (7.1%) | 32 (10.7%) |
| 9:00 AM to 9:59 AM | 18 (4.4%) | 25 (8.4%) |
| 10:00 AM to 10:59 AM | 4 (1.0%) | 26 (8.7%) |
| 11:00 AM to 11:59 AM | 0 (0.0%) | 5 (1.7%) |
| 12:00 PM to 3:59 PM | 16 (3.9%) | 28 (9.4%) |
| 4:00 PM to 11:59 PM | 46 (11.3%) | 24 (8.0%) |
| Total | 408 (100.0%) | 299 (100.0%) |
Housing Occupancy in Sigourney
Occupancy by Ownership in Sigourney
Of the total 873 dwellings in Sigourney, owner-occupied units account for 590 (67.6%), while renter-occupied units make up 283 (32.4%).
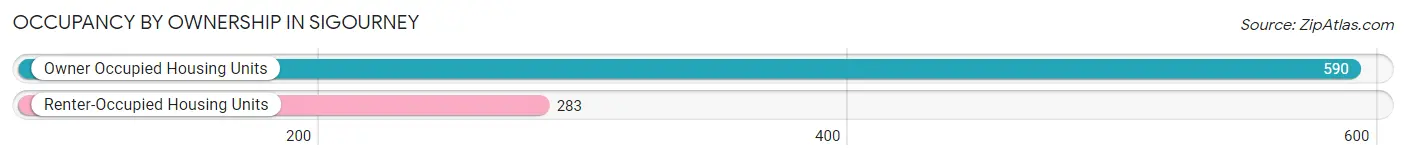
| Occupancy | # Housing Units | % Housing Units |
| Owner Occupied Housing Units | 590 | 67.6% |
| Renter-Occupied Housing Units | 283 | 32.4% |
| Total Occupied Housing Units | 873 | 100.0% |
Occupancy by Household Size in Sigourney
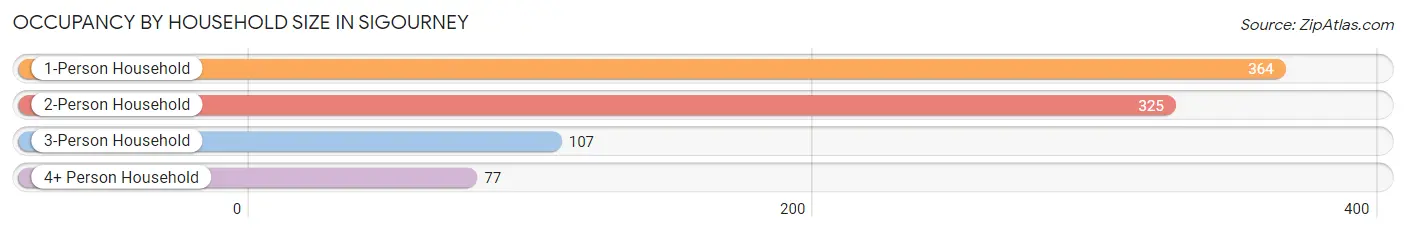
| Household Size | # Housing Units | % Housing Units |
| 1-Person Household | 364 | 41.7% |
| 2-Person Household | 325 | 37.2% |
| 3-Person Household | 107 | 12.3% |
| 4+ Person Household | 77 | 8.8% |
| Total Housing Units | 873 | 100.0% |
Occupancy by Ownership by Household Size in Sigourney
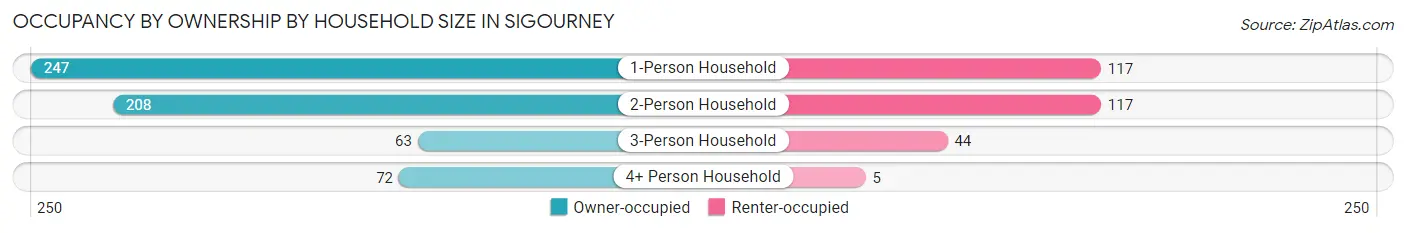
| Household Size | Owner-occupied | Renter-occupied |
| 1-Person Household | 247 (67.9%) | 117 (32.1%) |
| 2-Person Household | 208 (64.0%) | 117 (36.0%) |
| 3-Person Household | 63 (58.9%) | 44 (41.1%) |
| 4+ Person Household | 72 (93.5%) | 5 (6.5%) |
| Total Housing Units | 590 (67.6%) | 283 (32.4%) |
Occupancy by Educational Attainment in Sigourney
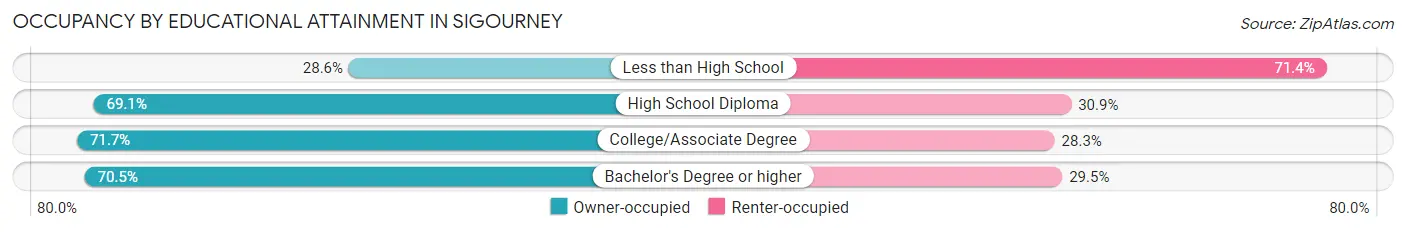
| Household Size | Owner-occupied | Renter-occupied |
| Less than High School | 16 (28.6%) | 40 (71.4%) |
| High School Diploma | 250 (69.1%) | 112 (30.9%) |
| College/Associate Degree | 195 (71.7%) | 77 (28.3%) |
| Bachelor's Degree or higher | 129 (70.5%) | 54 (29.5%) |
Occupancy by Age of Householder in Sigourney
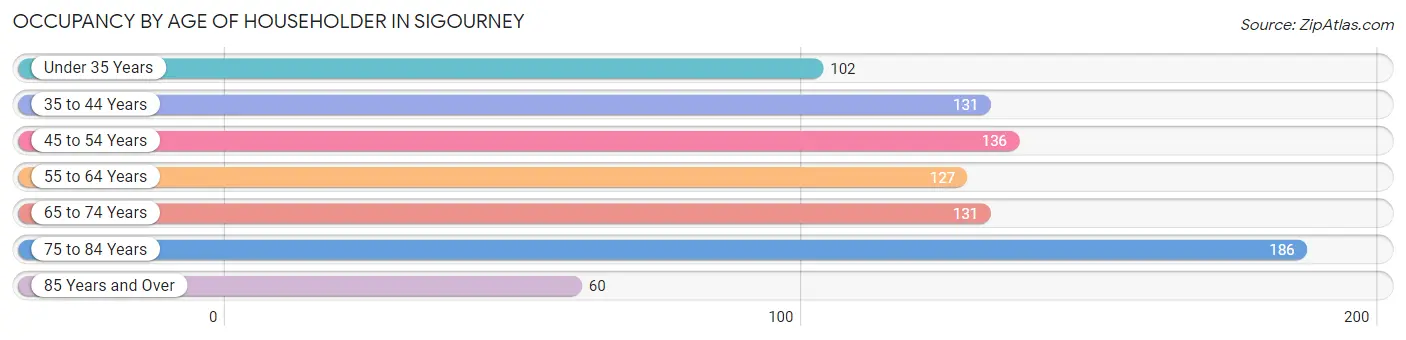
| Age Bracket | # Households | % Households |
| Under 35 Years | 102 | 11.7% |
| 35 to 44 Years | 131 | 15.0% |
| 45 to 54 Years | 136 | 15.6% |
| 55 to 64 Years | 127 | 14.5% |
| 65 to 74 Years | 131 | 15.0% |
| 75 to 84 Years | 186 | 21.3% |
| 85 Years and Over | 60 | 6.9% |
| Total | 873 | 100.0% |
Housing Finances in Sigourney
Median Income by Occupancy in Sigourney
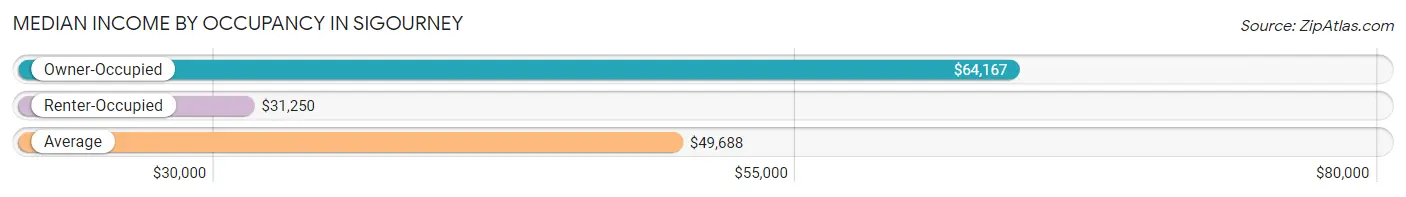
| Occupancy Type | # Households | Median Income |
| Owner-Occupied | 590 (67.6%) | $64,167 |
| Renter-Occupied | 283 (32.4%) | $31,250 |
| Average | 873 (100.0%) | $49,688 |
Occupancy by Householder Income Bracket in Sigourney
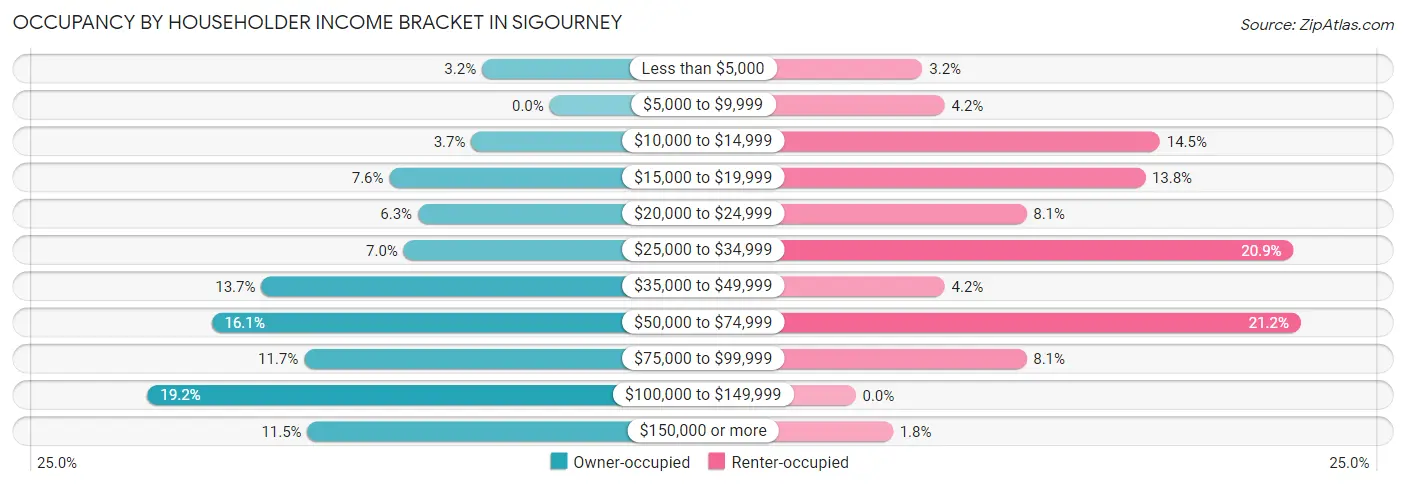
| Income Bracket | Owner-occupied | Renter-occupied |
| Less than $5,000 | 19 (3.2%) | 9 (3.2%) |
| $5,000 to $9,999 | 0 (0.0%) | 12 (4.2%) |
| $10,000 to $14,999 | 22 (3.7%) | 41 (14.5%) |
| $15,000 to $19,999 | 45 (7.6%) | 39 (13.8%) |
| $20,000 to $24,999 | 37 (6.3%) | 23 (8.1%) |
| $25,000 to $34,999 | 41 (7.0%) | 59 (20.8%) |
| $35,000 to $49,999 | 81 (13.7%) | 12 (4.2%) |
| $50,000 to $74,999 | 95 (16.1%) | 60 (21.2%) |
| $75,000 to $99,999 | 69 (11.7%) | 23 (8.1%) |
| $100,000 to $149,999 | 113 (19.2%) | 0 (0.0%) |
| $150,000 or more | 68 (11.5%) | 5 (1.8%) |
| Total | 590 (100.0%) | 283 (100.0%) |
Monthly Housing Cost Tiers in Sigourney
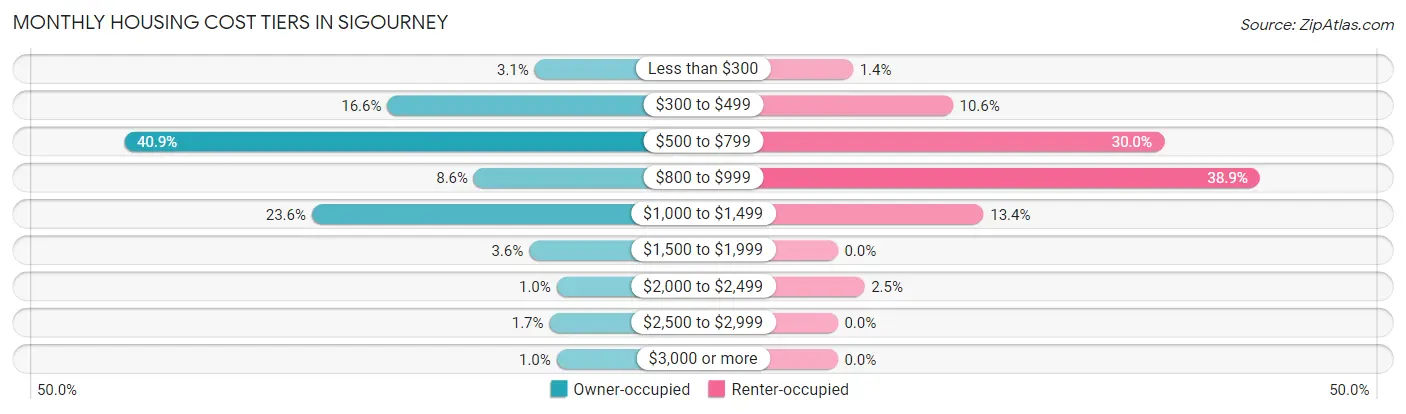
| Monthly Cost | Owner-occupied | Renter-occupied |
| Less than $300 | 18 (3.0%) | 4 (1.4%) |
| $300 to $499 | 98 (16.6%) | 30 (10.6%) |
| $500 to $799 | 241 (40.8%) | 85 (30.0%) |
| $800 to $999 | 51 (8.6%) | 110 (38.9%) |
| $1,000 to $1,499 | 139 (23.6%) | 38 (13.4%) |
| $1,500 to $1,999 | 21 (3.6%) | 0 (0.0%) |
| $2,000 to $2,499 | 6 (1.0%) | 7 (2.5%) |
| $2,500 to $2,999 | 10 (1.7%) | 0 (0.0%) |
| $3,000 or more | 6 (1.0%) | 0 (0.0%) |
| Total | 590 (100.0%) | 283 (100.0%) |
Physical Housing Characteristics in Sigourney
Housing Structures in Sigourney
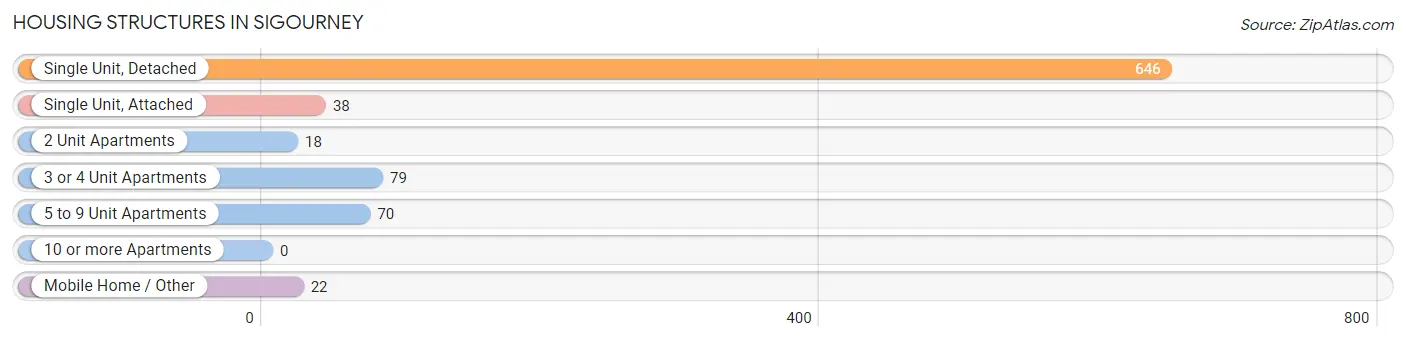
| Structure Type | # Housing Units | % Housing Units |
| Single Unit, Detached | 646 | 74.0% |
| Single Unit, Attached | 38 | 4.3% |
| 2 Unit Apartments | 18 | 2.1% |
| 3 or 4 Unit Apartments | 79 | 9.0% |
| 5 to 9 Unit Apartments | 70 | 8.0% |
| 10 or more Apartments | 0 | 0.0% |
| Mobile Home / Other | 22 | 2.5% |
| Total | 873 | 100.0% |
Housing Structures by Occupancy in Sigourney
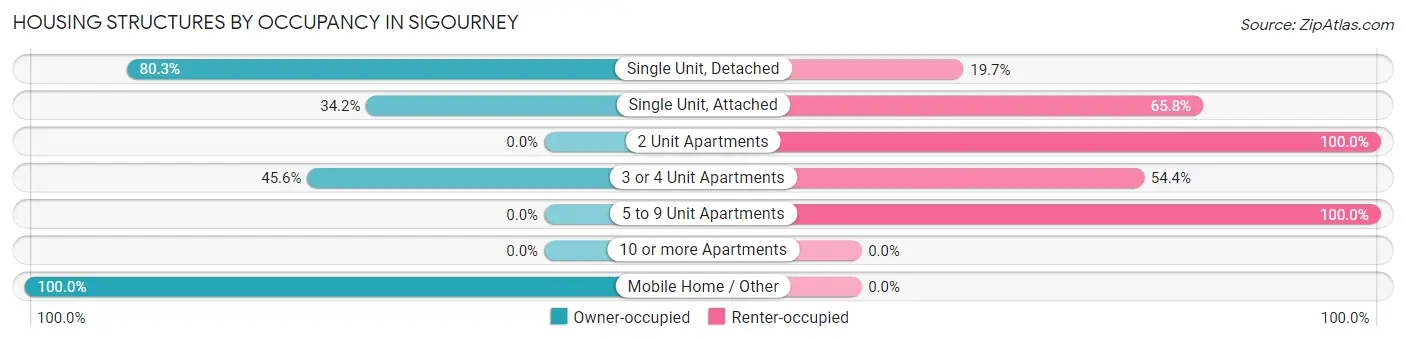
| Structure Type | Owner-occupied | Renter-occupied |
| Single Unit, Detached | 519 (80.3%) | 127 (19.7%) |
| Single Unit, Attached | 13 (34.2%) | 25 (65.8%) |
| 2 Unit Apartments | 0 (0.0%) | 18 (100.0%) |
| 3 or 4 Unit Apartments | 36 (45.6%) | 43 (54.4%) |
| 5 to 9 Unit Apartments | 0 (0.0%) | 70 (100.0%) |
| 10 or more Apartments | 0 (0.0%) | 0 (0.0%) |
| Mobile Home / Other | 22 (100.0%) | 0 (0.0%) |
| Total | 590 (67.6%) | 283 (32.4%) |
Housing Structures by Number of Rooms in Sigourney
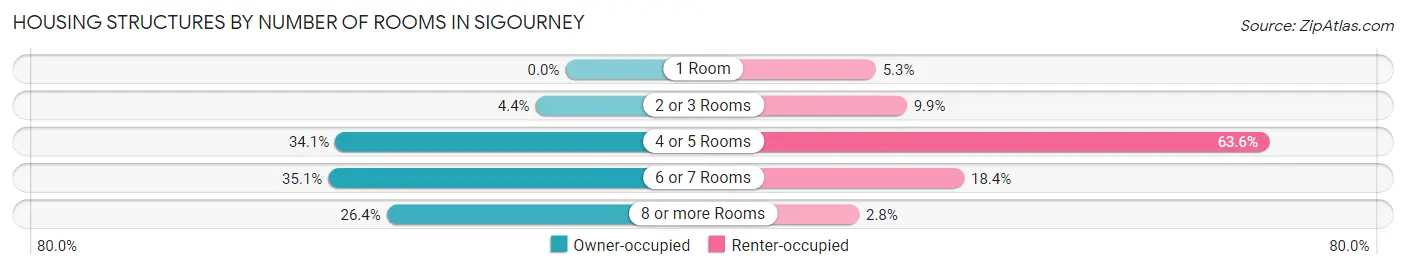
| Number of Rooms | Owner-occupied | Renter-occupied |
| 1 Room | 0 (0.0%) | 15 (5.3%) |
| 2 or 3 Rooms | 26 (4.4%) | 28 (9.9%) |
| 4 or 5 Rooms | 201 (34.1%) | 180 (63.6%) |
| 6 or 7 Rooms | 207 (35.1%) | 52 (18.4%) |
| 8 or more Rooms | 156 (26.4%) | 8 (2.8%) |
| Total | 590 (100.0%) | 283 (100.0%) |
Housing Structure by Heating Type in Sigourney
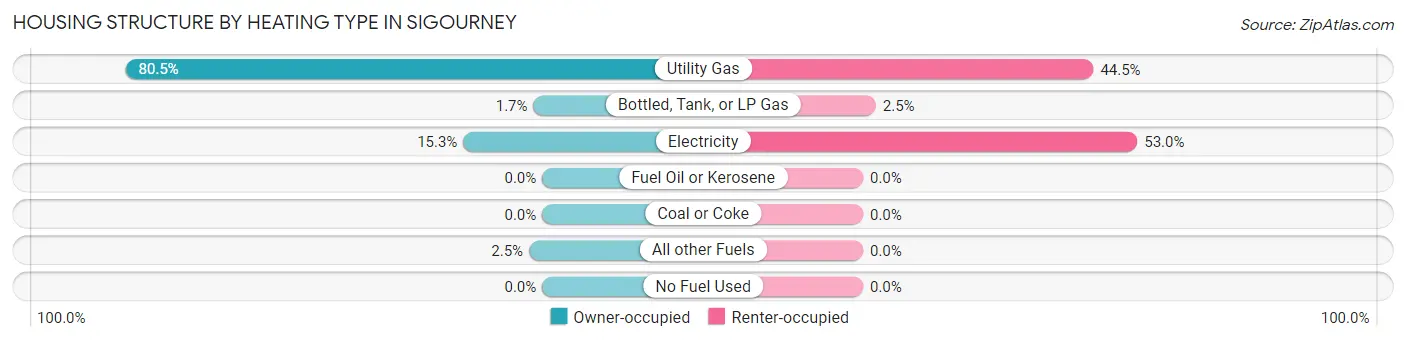
| Heating Type | Owner-occupied | Renter-occupied |
| Utility Gas | 475 (80.5%) | 126 (44.5%) |
| Bottled, Tank, or LP Gas | 10 (1.7%) | 7 (2.5%) |
| Electricity | 90 (15.2%) | 150 (53.0%) |
| Fuel Oil or Kerosene | 0 (0.0%) | 0 (0.0%) |
| Coal or Coke | 0 (0.0%) | 0 (0.0%) |
| All other Fuels | 15 (2.5%) | 0 (0.0%) |
| No Fuel Used | 0 (0.0%) | 0 (0.0%) |
| Total | 590 (100.0%) | 283 (100.0%) |
Household Vehicle Usage in Sigourney
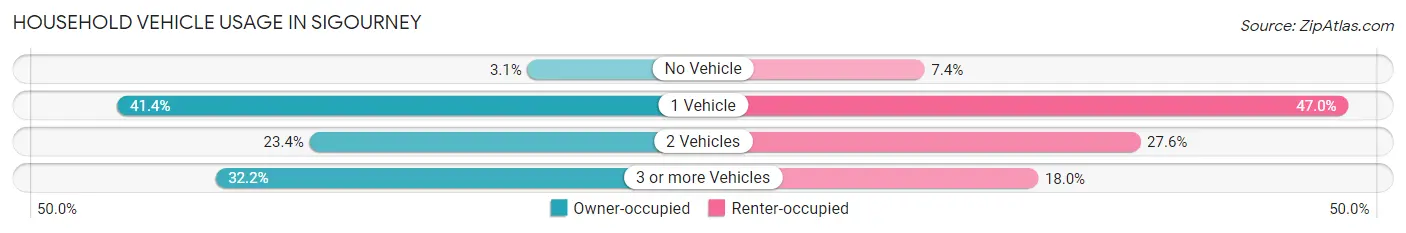
| Vehicles per Household | Owner-occupied | Renter-occupied |
| No Vehicle | 18 (3.0%) | 21 (7.4%) |
| 1 Vehicle | 244 (41.4%) | 133 (47.0%) |
| 2 Vehicles | 138 (23.4%) | 78 (27.6%) |
| 3 or more Vehicles | 190 (32.2%) | 51 (18.0%) |
| Total | 590 (100.0%) | 283 (100.0%) |
Real Estate & Mortgages in Sigourney
Real Estate and Mortgage Overview in Sigourney
| Characteristic | Without Mortgage | With Mortgage |
| Housing Units | 292 | 298 |
| Median Property Value | $109,900 | $98,400 |
| Median Household Income | $47,500 | $31 |
| Monthly Housing Costs | $538 | $6 |
| Real Estate Taxes | $1,870 | $0 |
Property Value by Mortgage Status in Sigourney
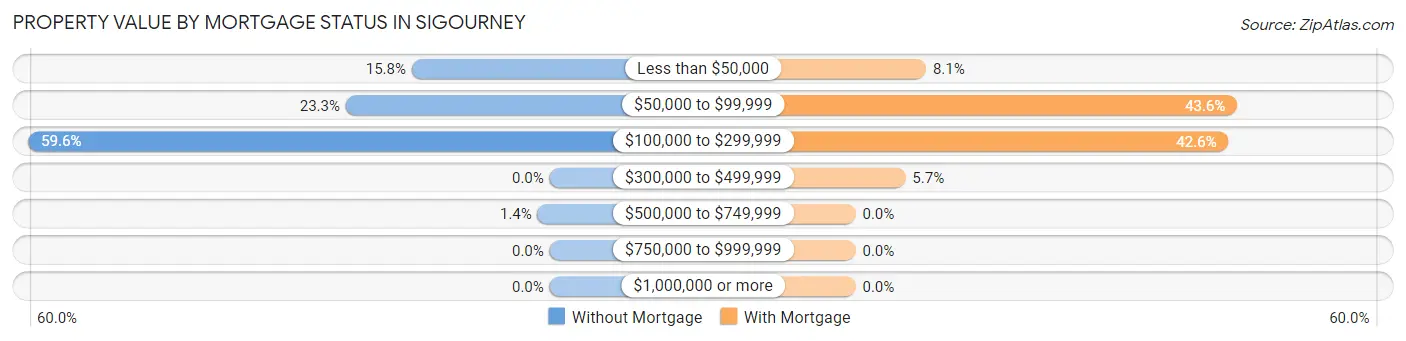
| Property Value | Without Mortgage | With Mortgage |
| Less than $50,000 | 46 (15.8%) | 24 (8.1%) |
| $50,000 to $99,999 | 68 (23.3%) | 130 (43.6%) |
| $100,000 to $299,999 | 174 (59.6%) | 127 (42.6%) |
| $300,000 to $499,999 | 0 (0.0%) | 17 (5.7%) |
| $500,000 to $749,999 | 4 (1.4%) | 0 (0.0%) |
| $750,000 to $999,999 | 0 (0.0%) | 0 (0.0%) |
| $1,000,000 or more | 0 (0.0%) | 0 (0.0%) |
| Total | 292 (100.0%) | 298 (100.0%) |
Household Income by Mortgage Status in Sigourney
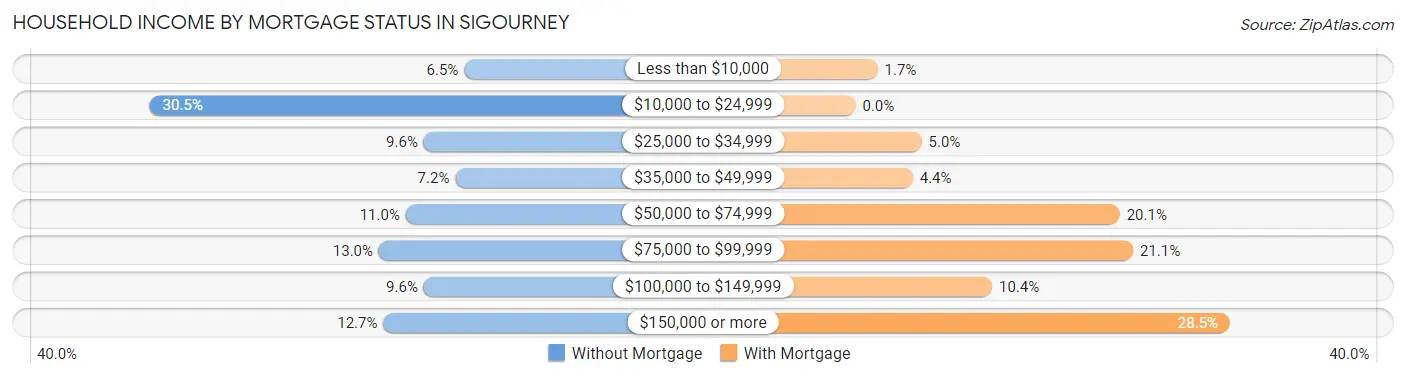
| Household Income | Without Mortgage | With Mortgage |
| Less than $10,000 | 19 (6.5%) | 5 (1.7%) |
| $10,000 to $24,999 | 89 (30.5%) | 0 (0.0%) |
| $25,000 to $34,999 | 28 (9.6%) | 15 (5.0%) |
| $35,000 to $49,999 | 21 (7.2%) | 13 (4.4%) |
| $50,000 to $74,999 | 32 (11.0%) | 60 (20.1%) |
| $75,000 to $99,999 | 38 (13.0%) | 63 (21.1%) |
| $100,000 to $149,999 | 28 (9.6%) | 31 (10.4%) |
| $150,000 or more | 37 (12.7%) | 85 (28.5%) |
| Total | 292 (100.0%) | 298 (100.0%) |
Property Value to Household Income Ratio in Sigourney
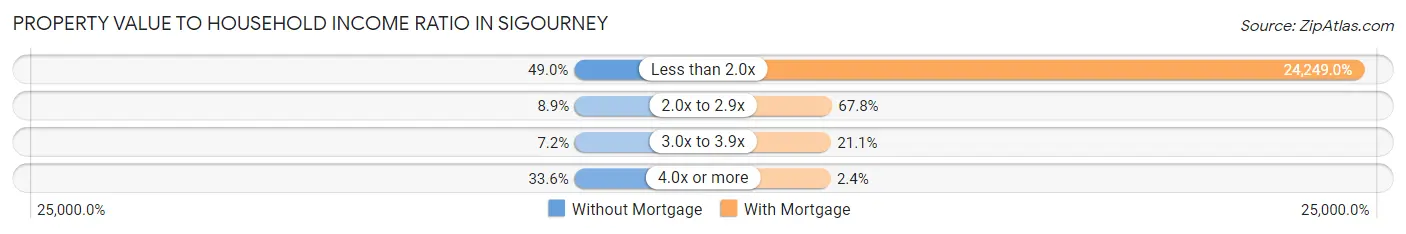
| Value-to-Income Ratio | Without Mortgage | With Mortgage |
| Less than 2.0x | 143 (49.0%) | 72,262 (24,249.0%) |
| 2.0x to 2.9x | 26 (8.9%) | 202 (67.8%) |
| 3.0x to 3.9x | 21 (7.2%) | 63 (21.1%) |
| 4.0x or more | 98 (33.6%) | 7 (2.4%) |
| Total | 292 (100.0%) | 298 (100.0%) |
Real Estate Taxes by Mortgage Status in Sigourney
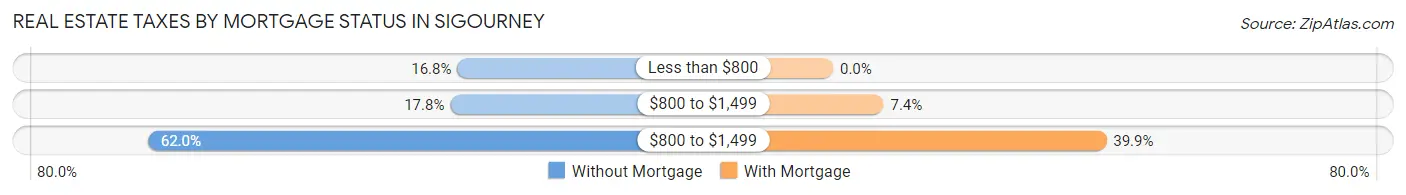
| Property Taxes | Without Mortgage | With Mortgage |
| Less than $800 | 49 (16.8%) | 0 (0.0%) |
| $800 to $1,499 | 52 (17.8%) | 22 (7.4%) |
| $800 to $1,499 | 181 (62.0%) | 119 (39.9%) |
| Total | 292 (100.0%) | 298 (100.0%) |
Health & Disability in Sigourney
Health Insurance Coverage by Age in Sigourney
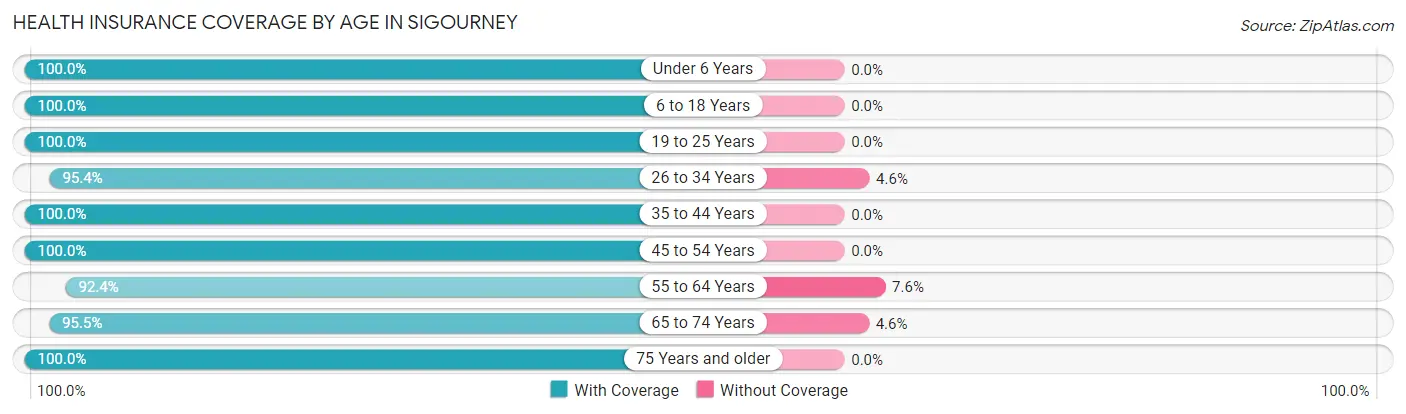
| Age Bracket | With Coverage | Without Coverage |
| Under 6 Years | 57 (100.0%) | 0 (0.0%) |
| 6 to 18 Years | 245 (100.0%) | 0 (0.0%) |
| 19 to 25 Years | 133 (100.0%) | 0 (0.0%) |
| 26 to 34 Years | 144 (95.4%) | 7 (4.6%) |
| 35 to 44 Years | 229 (100.0%) | 0 (0.0%) |
| 45 to 54 Years | 205 (100.0%) | 0 (0.0%) |
| 55 to 64 Years | 194 (92.4%) | 16 (7.6%) |
| 65 to 74 Years | 210 (95.5%) | 10 (4.5%) |
| 75 Years and older | 291 (100.0%) | 0 (0.0%) |
| Total | 1,708 (98.1%) | 33 (1.9%) |
Health Insurance Coverage by Citizenship Status in Sigourney
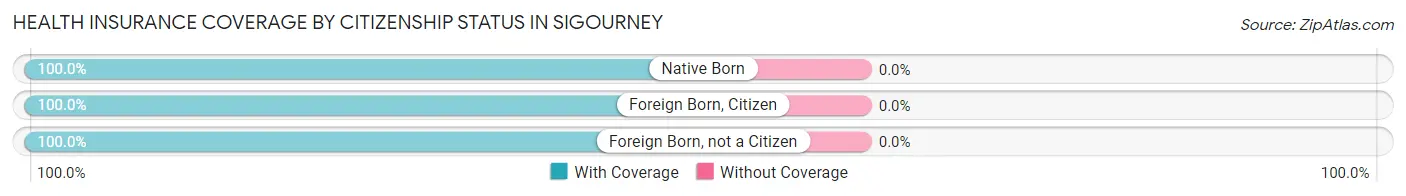
| Citizenship Status | With Coverage | Without Coverage |
| Native Born | 57 (100.0%) | 0 (0.0%) |
| Foreign Born, Citizen | 245 (100.0%) | 0 (0.0%) |
| Foreign Born, not a Citizen | 133 (100.0%) | 0 (0.0%) |
Health Insurance Coverage by Household Income in Sigourney
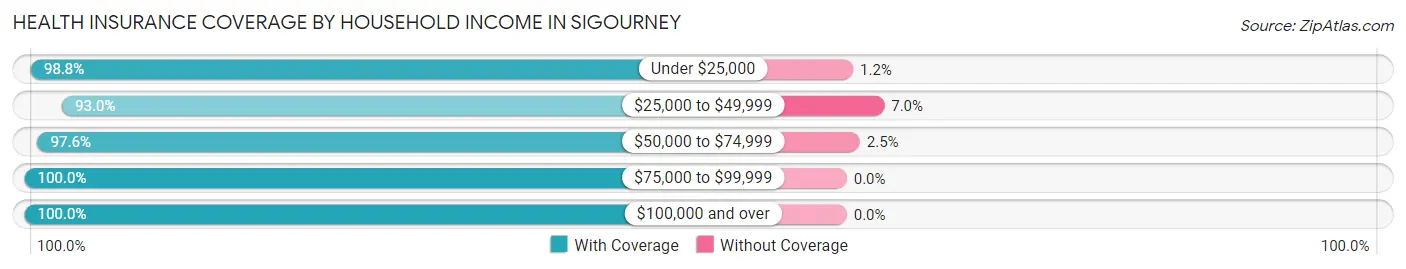
| Household Income | With Coverage | Without Coverage |
| Under $25,000 | 335 (98.8%) | 4 (1.2%) |
| $25,000 to $49,999 | 265 (93.0%) | 20 (7.0%) |
| $50,000 to $74,999 | 358 (97.6%) | 9 (2.5%) |
| $75,000 to $99,999 | 207 (100.0%) | 0 (0.0%) |
| $100,000 and over | 520 (100.0%) | 0 (0.0%) |
Public vs Private Health Insurance Coverage by Age in Sigourney
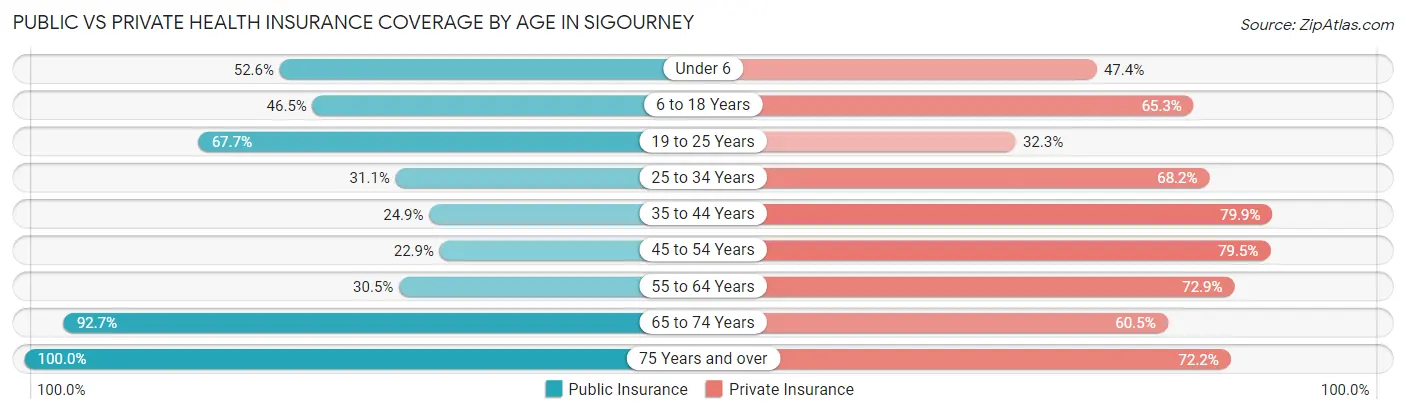
| Age Bracket | Public Insurance | Private Insurance |
| Under 6 | 30 (52.6%) | 27 (47.4%) |
| 6 to 18 Years | 114 (46.5%) | 160 (65.3%) |
| 19 to 25 Years | 90 (67.7%) | 43 (32.3%) |
| 25 to 34 Years | 47 (31.1%) | 103 (68.2%) |
| 35 to 44 Years | 57 (24.9%) | 183 (79.9%) |
| 45 to 54 Years | 47 (22.9%) | 163 (79.5%) |
| 55 to 64 Years | 64 (30.5%) | 153 (72.9%) |
| 65 to 74 Years | 204 (92.7%) | 133 (60.5%) |
| 75 Years and over | 291 (100.0%) | 210 (72.2%) |
| Total | 944 (54.2%) | 1,175 (67.5%) |
Disability Status by Sex by Age in Sigourney
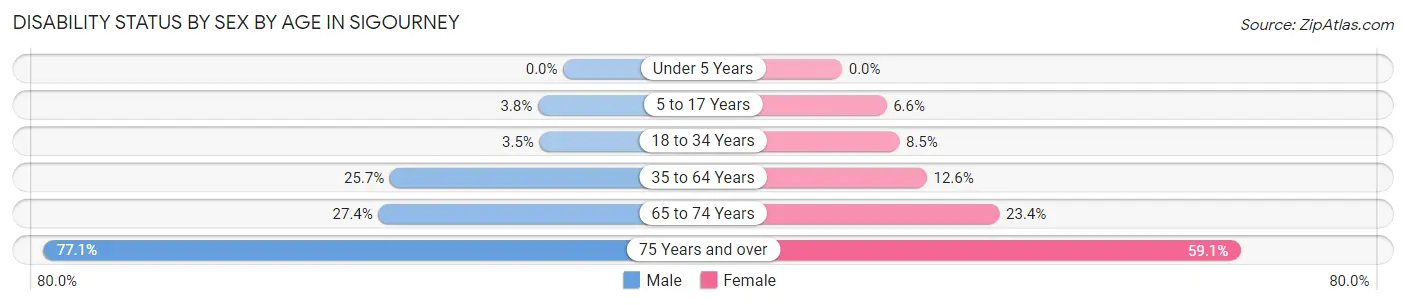
| Age Bracket | Male | Female |
| Under 5 Years | 0 (0.0%) | 0 (0.0%) |
| 5 to 17 Years | 5 (3.8%) | 6 (6.6%) |
| 18 to 34 Years | 7 (3.5%) | 9 (8.5%) |
| 35 to 64 Years | 88 (25.7%) | 38 (12.6%) |
| 65 to 74 Years | 31 (27.4%) | 25 (23.4%) |
| 75 Years and over | 81 (77.1%) | 110 (59.1%) |
Disability Class by Sex by Age in Sigourney
Disability Class: Hearing Difficulty
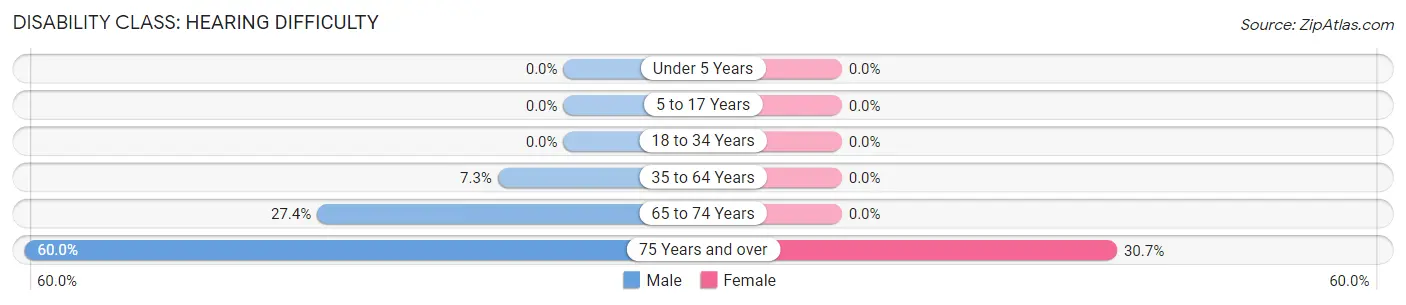
| Age Bracket | Male | Female |
| Under 5 Years | 0 (0.0%) | 0 (0.0%) |
| 5 to 17 Years | 0 (0.0%) | 0 (0.0%) |
| 18 to 34 Years | 0 (0.0%) | 0 (0.0%) |
| 35 to 64 Years | 25 (7.3%) | 0 (0.0%) |
| 65 to 74 Years | 31 (27.4%) | 0 (0.0%) |
| 75 Years and over | 63 (60.0%) | 57 (30.6%) |
Disability Class: Vision Difficulty
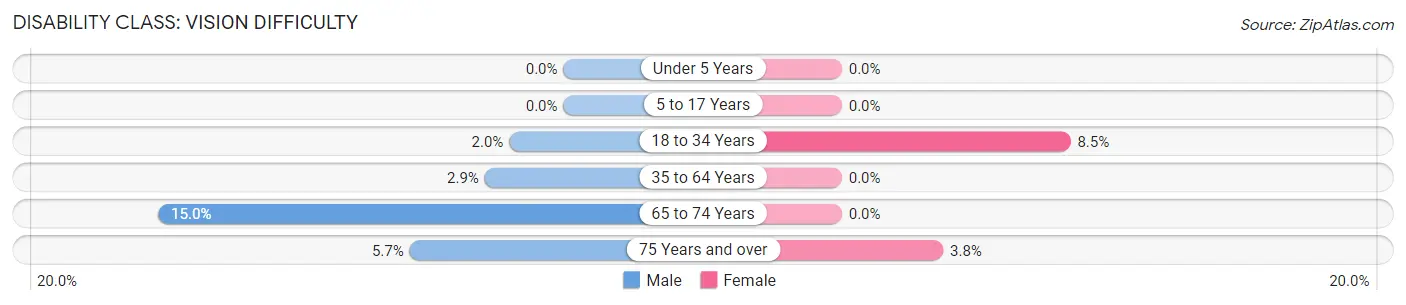
| Age Bracket | Male | Female |
| Under 5 Years | 0 (0.0%) | 0 (0.0%) |
| 5 to 17 Years | 0 (0.0%) | 0 (0.0%) |
| 18 to 34 Years | 4 (2.0%) | 9 (8.5%) |
| 35 to 64 Years | 10 (2.9%) | 0 (0.0%) |
| 65 to 74 Years | 17 (15.0%) | 0 (0.0%) |
| 75 Years and over | 6 (5.7%) | 7 (3.8%) |
Disability Class: Cognitive Difficulty
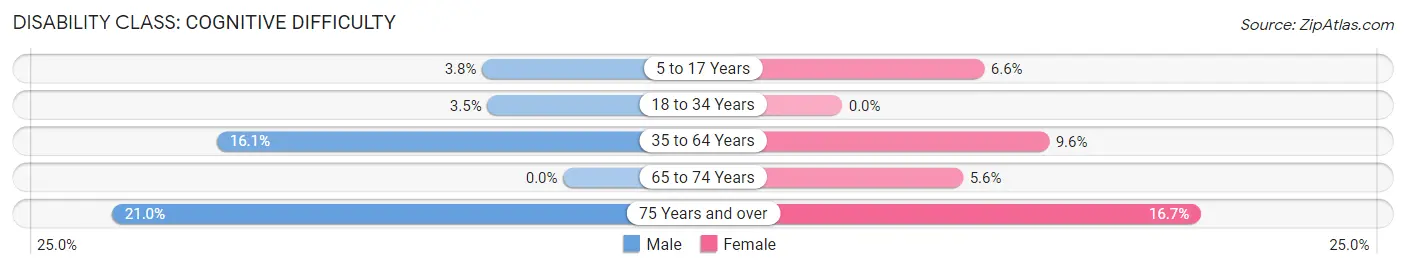
| Age Bracket | Male | Female |
| 5 to 17 Years | 5 (3.8%) | 6 (6.6%) |
| 18 to 34 Years | 7 (3.5%) | 0 (0.0%) |
| 35 to 64 Years | 55 (16.1%) | 29 (9.6%) |
| 65 to 74 Years | 0 (0.0%) | 6 (5.6%) |
| 75 Years and over | 22 (20.9%) | 31 (16.7%) |
Disability Class: Ambulatory Difficulty
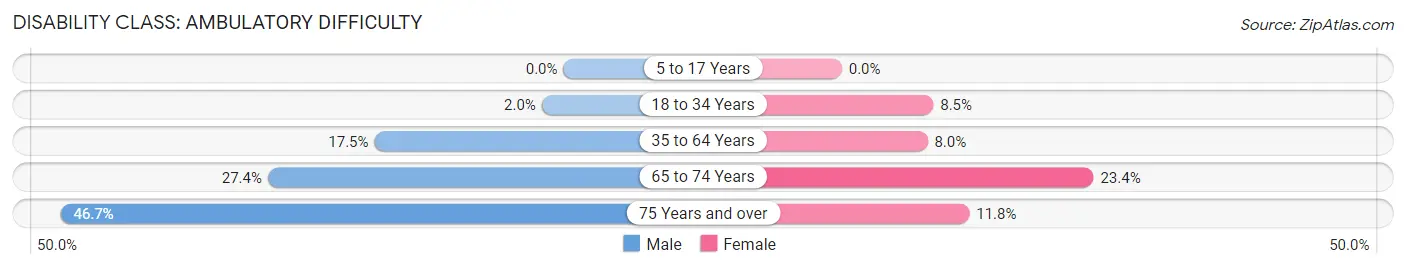
| Age Bracket | Male | Female |
| 5 to 17 Years | 0 (0.0%) | 0 (0.0%) |
| 18 to 34 Years | 4 (2.0%) | 9 (8.5%) |
| 35 to 64 Years | 60 (17.5%) | 24 (8.0%) |
| 65 to 74 Years | 31 (27.4%) | 25 (23.4%) |
| 75 Years and over | 49 (46.7%) | 22 (11.8%) |
Disability Class: Self-Care Difficulty
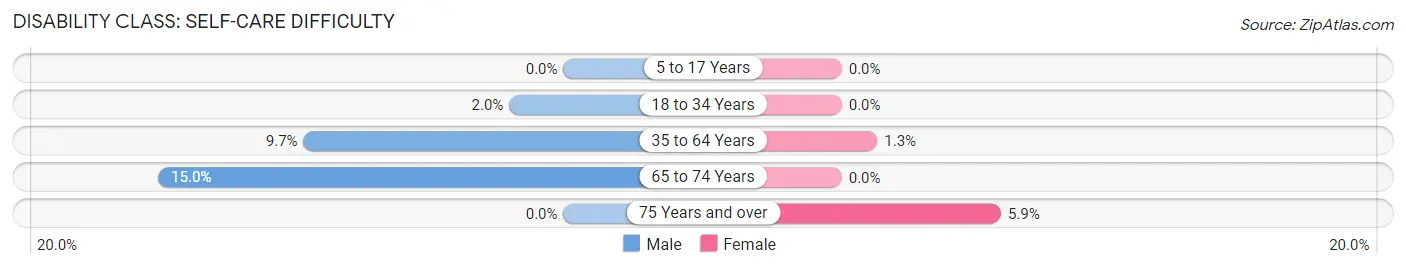
| Age Bracket | Male | Female |
| 5 to 17 Years | 0 (0.0%) | 0 (0.0%) |
| 18 to 34 Years | 4 (2.0%) | 0 (0.0%) |
| 35 to 64 Years | 33 (9.7%) | 4 (1.3%) |
| 65 to 74 Years | 17 (15.0%) | 0 (0.0%) |
| 75 Years and over | 0 (0.0%) | 11 (5.9%) |
Technology Access in Sigourney
Computing Device Access in Sigourney
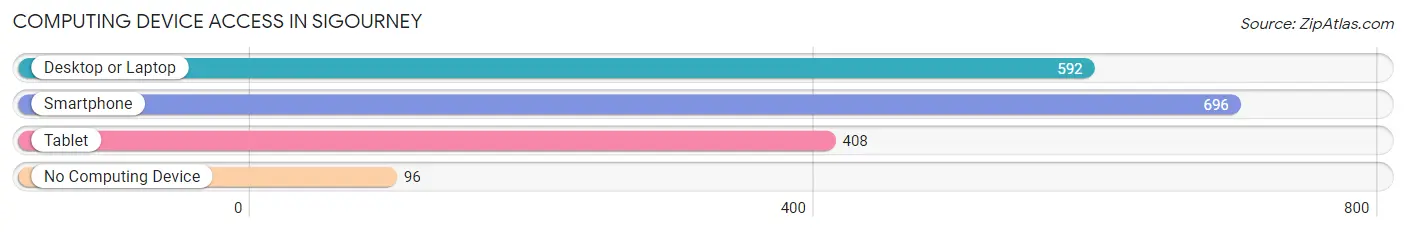
| Device Type | # Households | % Households |
| Desktop or Laptop | 592 | 67.8% |
| Smartphone | 696 | 79.7% |
| Tablet | 408 | 46.7% |
| No Computing Device | 96 | 11.0% |
| Total | 873 | 100.0% |
Internet Access in Sigourney
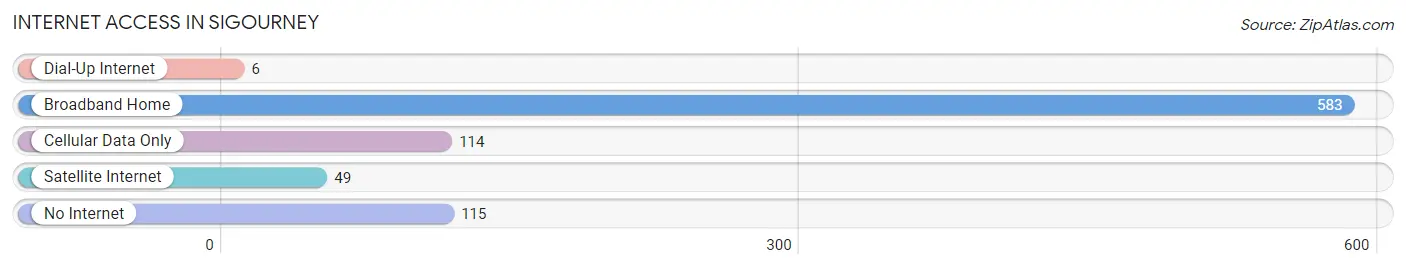
| Internet Type | # Households | % Households |
| Dial-Up Internet | 6 | 0.7% |
| Broadband Home | 583 | 66.8% |
| Cellular Data Only | 114 | 13.1% |
| Satellite Internet | 49 | 5.6% |
| No Internet | 115 | 13.2% |
| Total | 873 | 100.0% |
Sigourney Summary
Sigourney, Iowa is a small city located in Keokuk County, Iowa. It is situated in the southeastern part of the state, about 40 miles south of Iowa City. The city has a population of 2,619 people, according to the 2020 U.S. Census.
History
Sigourney was founded in 1851 by a group of settlers from Ohio. The city was named after Lydia Sigourney, a popular poet of the time. The city was incorporated in 1856 and was the county seat of Keokuk County until 1859.
The city was a major stop on the Underground Railroad, with many slaves escaping to freedom in Canada. The city was also a major stop on the Chicago, Burlington & Quincy Railroad, which ran through the city until the late 1960s.
Geography
Sigourney is located in the southeastern part of Iowa, about 40 miles south of Iowa City. The city is situated in the rolling hills of the Iowa River Valley. The city is surrounded by farmland and is located near the Iowa River.
The climate in Sigourney is humid continental, with hot summers and cold winters. The average annual temperature is around 50 degrees Fahrenheit.
Economy
The economy of Sigourney is largely based on agriculture. The city is home to several large farms, as well as a number of smaller farms. The city is also home to several manufacturing companies, including a furniture factory and a plastics factory.
The city is also home to several small businesses, including restaurants, shops, and other services. The city is also home to a number of tourist attractions, including the Keokuk County Historical Museum and the Sigourney Public Library.
Demographics
As of the 2020 U.S. Census, the population of Sigourney was 2,619 people. The racial makeup of the city was 97.3% White, 0.7% African American, 0.2% Native American, 0.3% Asian, 0.1% Pacific Islander, 0.3% from other races, and 1.3% from two or more races.
The median household income in Sigourney was $45,938, and the median family income was $54,813. The per capita income was $21,945. About 11.3% of the population was below the poverty line.
Sigourney is a small city with a rich history and a strong agricultural economy. The city is home to a diverse population and is a great place to live and work.
Common Questions
What is Per Capita Income in Sigourney?
Per Capita income in Sigourney is $31,823.
What is the Median Family Income in Sigourney?
Median Family Income in Sigourney is $71,328.
What is the Median Household income in Sigourney?
Median Household Income in Sigourney is $49,688.
What is Income or Wage Gap in Sigourney?
Income or Wage Gap in Sigourney is 8.1%.
Women in Sigourney earn 91.9 cents for every dollar earned by a man.
What is Inequality or Gini Index in Sigourney?
Inequality or Gini Index in Sigourney is 0.44.
What is the Total Population of Sigourney?
Total Population of Sigourney is 1,835.
What is the Total Male Population of Sigourney?
Total Male Population of Sigourney is 963.
What is the Total Female Population of Sigourney?
Total Female Population of Sigourney is 872.
What is the Ratio of Males per 100 Females in Sigourney?
There are 110.44 Males per 100 Females in Sigourney.
What is the Ratio of Females per 100 Males in Sigourney?
There are 90.55 Females per 100 Males in Sigourney.
What is the Median Population Age in Sigourney?
Median Population Age in Sigourney is 50.5 Years.
What is the Average Family Size in Sigourney
Average Family Size in Sigourney is 2.6 People.
What is the Average Household Size in Sigourney
Average Household Size in Sigourney is 2.0 People.
How Large is the Labor Force in Sigourney?
There are 819 People in the Labor Forcein in Sigourney.
What is the Percentage of People in the Labor Force in Sigourney?
51.2% of People are in the Labor Force in Sigourney.
What is the Unemployment Rate in Sigourney?
Unemployment Rate in Sigourney is 1.5%.