North Buena Vista, IA Map & Demographics
North Buena Vista Map
North Buena Vista Overview
$27,424
PER CAPITA INCOME
$49,375
AVG FAMILY INCOME
$47,813
AVG HOUSEHOLD INCOME
2.7%
WAGE / INCOME GAP [ % ]
97.3¢/ $1
WAGE / INCOME GAP [ $ ]
0.35
INEQUALITY / GINI INDEX
106
TOTAL POPULATION
56
MALE POPULATION
50
FEMALE POPULATION
112.00
MALES / 100 FEMALES
89.29
FEMALES / 100 MALES
54.8
MEDIAN AGE
2.6
AVG FAMILY SIZE
2.1
AVG HOUSEHOLD SIZE
44
LABOR FORCE [ PEOPLE ]
48.4%
PERCENT IN LABOR FORCE
9.1%
UNEMPLOYMENT RATE
North Buena Vista Zip Codes
North Buena Vista Area Codes
Income in North Buena Vista
Income Overview in North Buena Vista
Per Capita Income in North Buena Vista is $27,424, while median incomes of families and households are $49,375 and $47,813 respectively.
| Characteristic | Number | Measure |
| Per Capita Income | 106 | $27,424 |
| Median Family Income | 32 | $49,375 |
| Mean Family Income | 32 | $60,984 |
| Median Household Income | 51 | $47,813 |
| Mean Household Income | 51 | $57,394 |
| Income Deficit | 32 | $0 |
| Wage / Income Gap (%) | 106 | 2.70% |
| Wage / Income Gap ($) | 106 | 97.30¢ per $1 |
| Gini / Inequality Index | 106 | 0.35 |
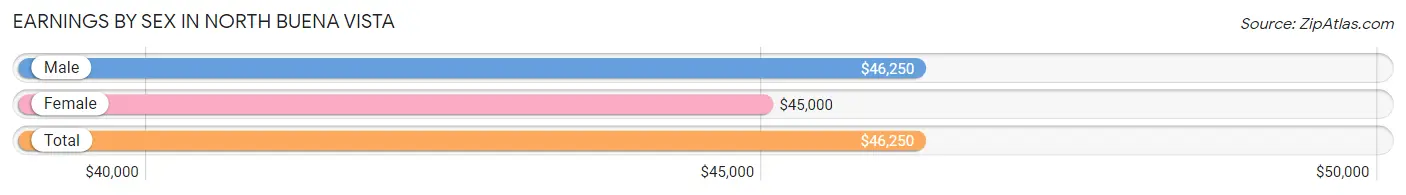
Earnings by Sex in North Buena Vista
Average Earnings in North Buena Vista are $46,250, $46,250 for men and $45,000 for women, a difference of 2.7%.
| Sex | Number | Average Earnings |
| Male | 29 (61.7%) | $46,250 |
| Female | 18 (38.3%) | $45,000 |
| Total | 47 (100.0%) | $46,250 |
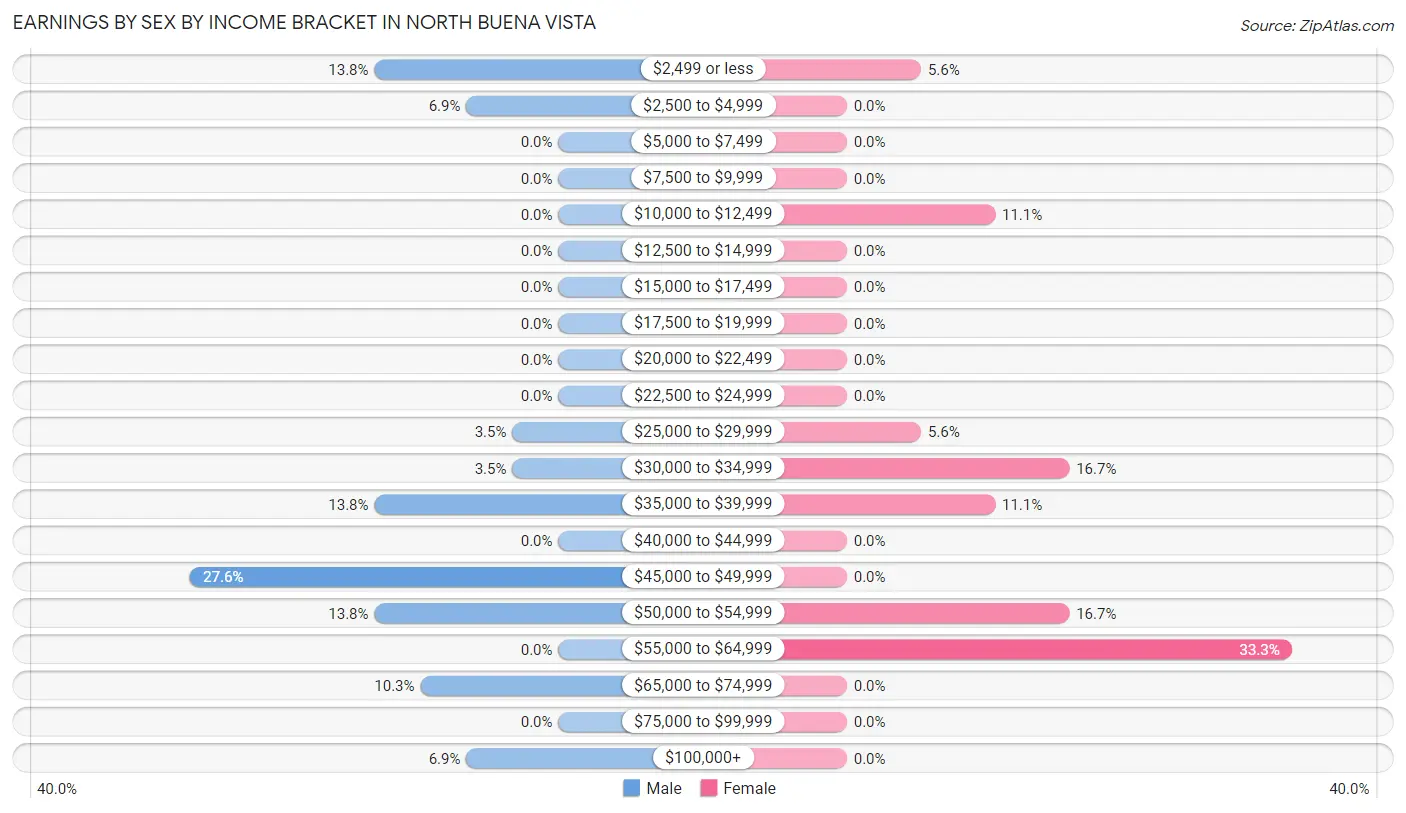
Earnings by Sex by Income Bracket in North Buena Vista
The most common earnings brackets in North Buena Vista are $45,000 to $49,999 for men (8 | 27.6%) and $55,000 to $64,999 for women (6 | 33.3%).
| Income | Male | Female |
| $2,499 or less | 4 (13.8%) | 1 (5.6%) |
| $2,500 to $4,999 | 2 (6.9%) | 0 (0.0%) |
| $5,000 to $7,499 | 0 (0.0%) | 0 (0.0%) |
| $7,500 to $9,999 | 0 (0.0%) | 0 (0.0%) |
| $10,000 to $12,499 | 0 (0.0%) | 2 (11.1%) |
| $12,500 to $14,999 | 0 (0.0%) | 0 (0.0%) |
| $15,000 to $17,499 | 0 (0.0%) | 0 (0.0%) |
| $17,500 to $19,999 | 0 (0.0%) | 0 (0.0%) |
| $20,000 to $22,499 | 0 (0.0%) | 0 (0.0%) |
| $22,500 to $24,999 | 0 (0.0%) | 0 (0.0%) |
| $25,000 to $29,999 | 1 (3.5%) | 1 (5.6%) |
| $30,000 to $34,999 | 1 (3.5%) | 3 (16.7%) |
| $35,000 to $39,999 | 4 (13.8%) | 2 (11.1%) |
| $40,000 to $44,999 | 0 (0.0%) | 0 (0.0%) |
| $45,000 to $49,999 | 8 (27.6%) | 0 (0.0%) |
| $50,000 to $54,999 | 4 (13.8%) | 3 (16.7%) |
| $55,000 to $64,999 | 0 (0.0%) | 6 (33.3%) |
| $65,000 to $74,999 | 3 (10.3%) | 0 (0.0%) |
| $75,000 to $99,999 | 0 (0.0%) | 0 (0.0%) |
| $100,000+ | 2 (6.9%) | 0 (0.0%) |
| Total | 29 (100.0%) | 18 (100.0%) |
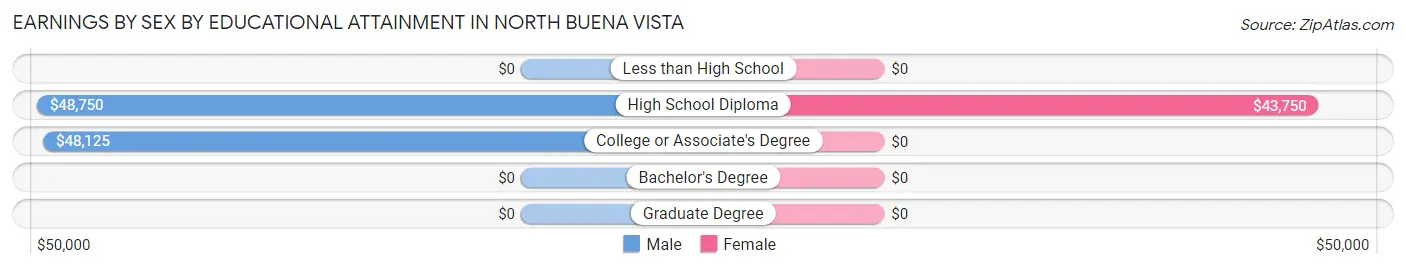
Earnings by Sex by Educational Attainment in North Buena Vista
Average earnings in North Buena Vista are $47,250 for men and $45,000 for women, a difference of 4.8%. Men with an educational attainment of high school diploma enjoy the highest average annual earnings of $48,750, while those with college or associate's degree education earn the least with $48,125. Women with an educational attainment of high school diploma earn the most with the average annual earnings of $43,750, while those with high school diploma education have the smallest earnings of $43,750.
| Educational Attainment | Male Income | Female Income |
| Less than High School | - | - |
| High School Diploma | $48,750 | $43,750 |
| College or Associate's Degree | $48,125 | $0 |
| Bachelor's Degree | - | - |
| Graduate Degree | - | - |
| Total | $47,250 | $45,000 |
Family Income in North Buena Vista
Family Income Brackets in North Buena Vista
According to the North Buena Vista family income data, there are 9 families falling into the $35,000 to $49,999 income range, which is the most common income bracket and makes up 28.1% of all families.
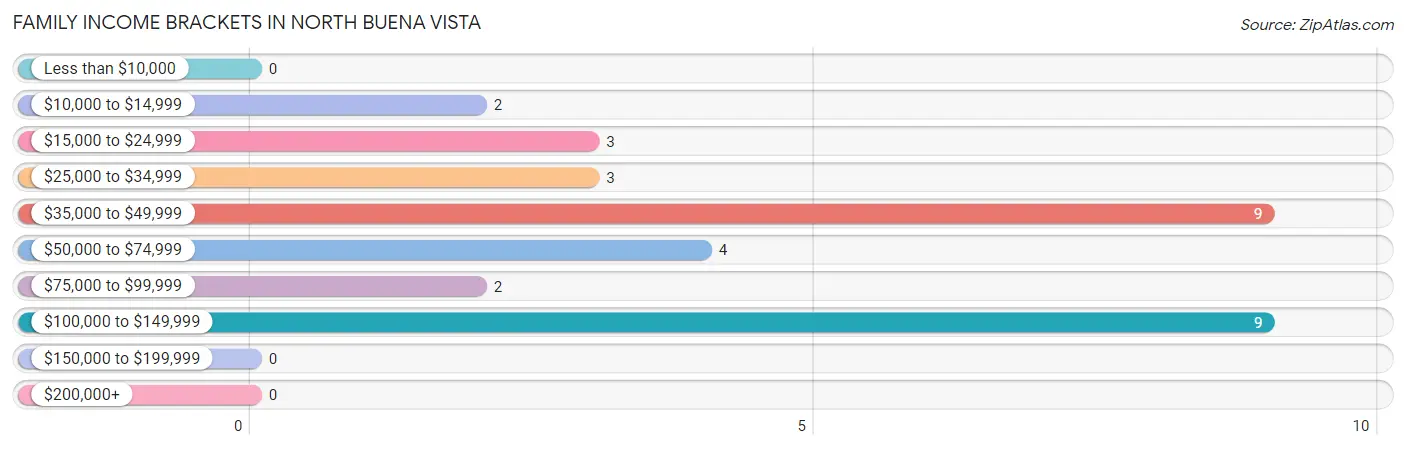
| Income Bracket | # Families | % Families |
| Less than $10,000 | 0 | 0.0% |
| $10,000 to $14,999 | 2 | 6.3% |
| $15,000 to $24,999 | 3 | 9.4% |
| $25,000 to $34,999 | 3 | 9.4% |
| $35,000 to $49,999 | 9 | 28.1% |
| $50,000 to $74,999 | 4 | 12.5% |
| $75,000 to $99,999 | 2 | 6.3% |
| $100,000 to $149,999 | 9 | 28.1% |
| $150,000 to $199,999 | 0 | 0.0% |
| $200,000+ | 0 | 0.0% |
Family Income by Famaliy Size in North Buena Vista
2-person families (25 | 78.1%) account for the highest median family income in North Buena Vista with $41,875 per family, while 2-person families (25 | 78.1%) have the highest median income of $20,938 per family member.
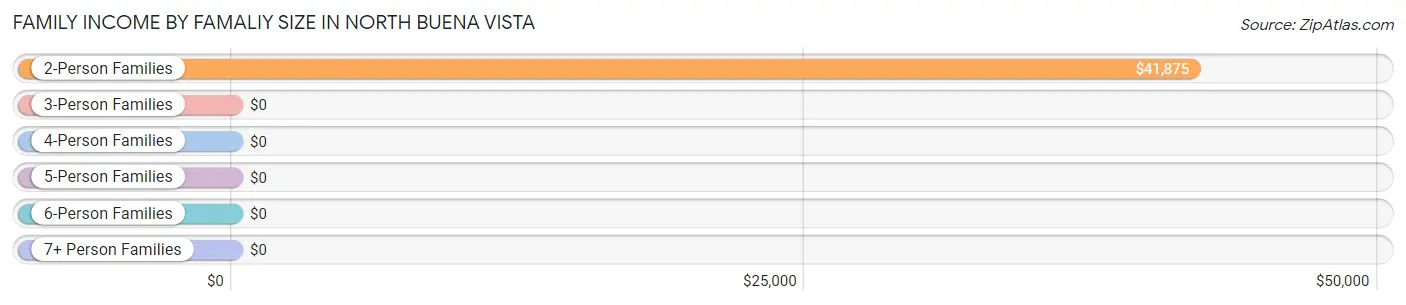
| Income Bracket | # Families | Median Income |
| 2-Person Families | 25 (78.1%) | $41,875 |
| 3-Person Families | 0 (0.0%) | $0 |
| 4-Person Families | 4 (12.5%) | $0 |
| 5-Person Families | 3 (9.4%) | $0 |
| 6-Person Families | 0 (0.0%) | $0 |
| 7+ Person Families | 0 (0.0%) | $0 |
| Total | 32 (100.0%) | $49,375 |
Family Income by Number of Earners in North Buena Vista
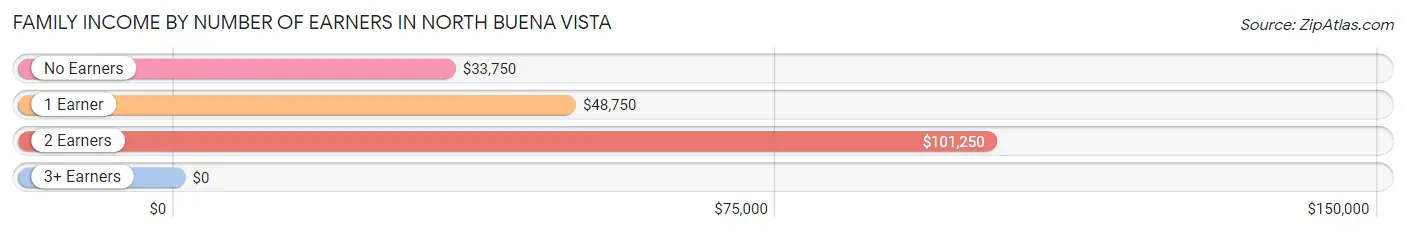
| Number of Earners | # Families | Median Income |
| No Earners | 13 (40.6%) | $33,750 |
| 1 Earner | 4 (12.5%) | $48,750 |
| 2 Earners | 13 (40.6%) | $101,250 |
| 3+ Earners | 2 (6.2%) | $0 |
| Total | 32 (100.0%) | $49,375 |
Household Income in North Buena Vista
Household Income Brackets in North Buena Vista
With 14 households falling in the category, the $35,000 to $49,999 income range is the most frequent in North Buena Vista, accounting for 27.5% of all households.
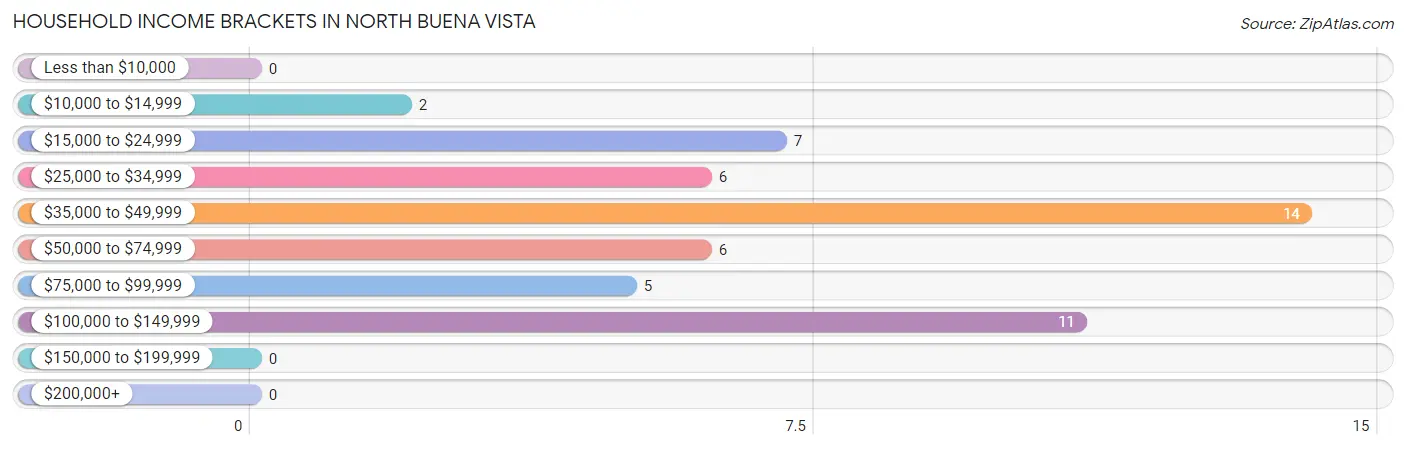
| Income Bracket | # Households | % Households |
| Less than $10,000 | 0 | 0.0% |
| $10,000 to $14,999 | 2 | 3.9% |
| $15,000 to $24,999 | 7 | 13.7% |
| $25,000 to $34,999 | 6 | 11.8% |
| $35,000 to $49,999 | 14 | 27.5% |
| $50,000 to $74,999 | 6 | 11.8% |
| $75,000 to $99,999 | 5 | 9.8% |
| $100,000 to $149,999 | 11 | 21.6% |
| $150,000 to $199,999 | 0 | 0.0% |
| $200,000+ | 0 | 0.0% |
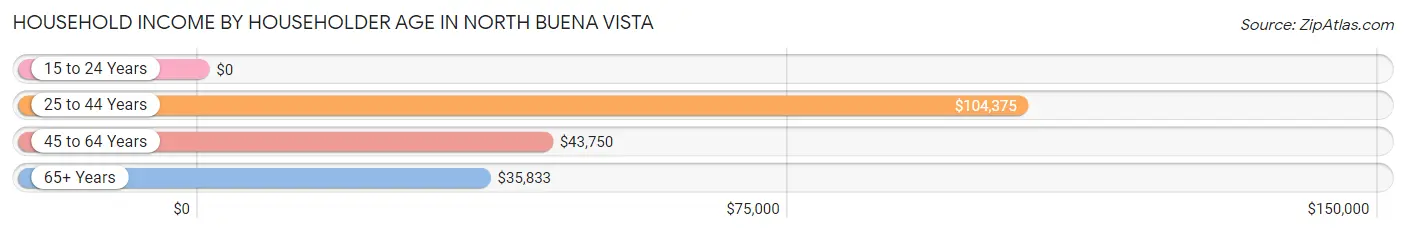
Household Income by Householder Age in North Buena Vista
The median household income in North Buena Vista is $47,813, with the highest median household income of $104,375 found in the 25 to 44 years age bracket for the primary householder. A total of 9 households (17.6%) fall into this category.
| Income Bracket | # Households | Median Income |
| 15 to 24 Years | 0 (0.0%) | $0 |
| 25 to 44 Years | 9 (17.6%) | $104,375 |
| 45 to 64 Years | 28 (54.9%) | $43,750 |
| 65+ Years | 14 (27.5%) | $35,833 |
| Total | 51 (100.0%) | $47,813 |
Poverty in North Buena Vista
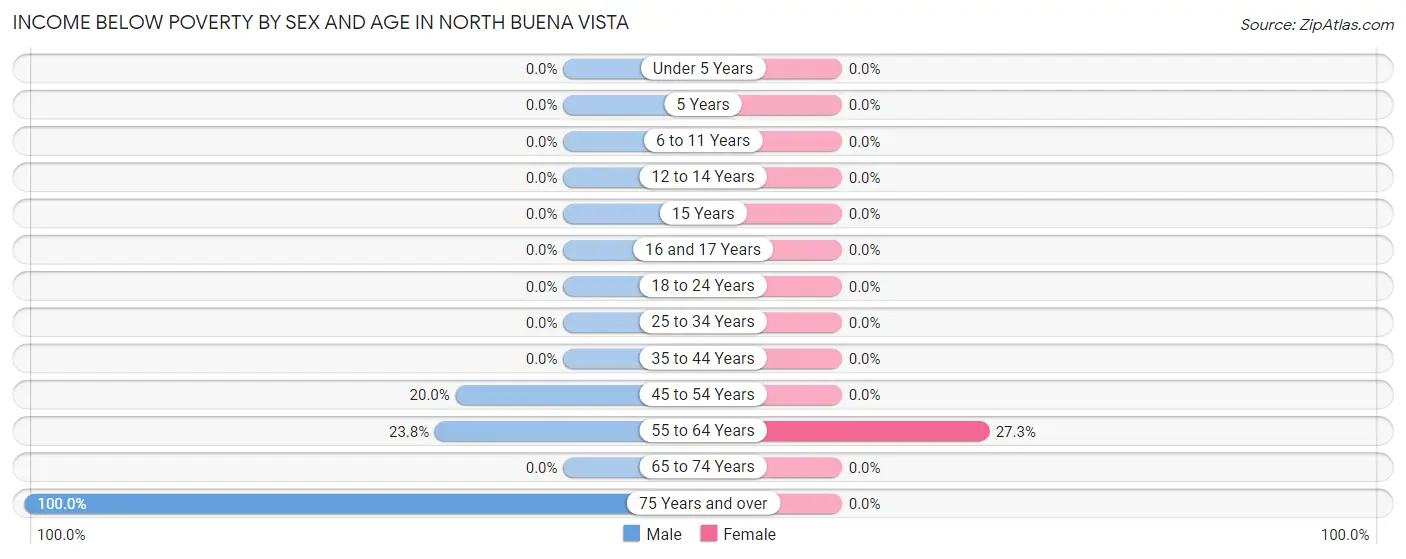
Income Below Poverty by Sex and Age in North Buena Vista
With 16.1% poverty level for males and 6.0% for females among the residents of North Buena Vista, 75 year old and over males and 55 to 64 year old females are the most vulnerable to poverty, with 2 males (100.0%) and 3 females (27.3%) in their respective age groups living below the poverty level.
| Age Bracket | Male | Female |
| Under 5 Years | 0 (0.0%) | 0 (0.0%) |
| 5 Years | 0 (0.0%) | 0 (0.0%) |
| 6 to 11 Years | 0 (0.0%) | 0 (0.0%) |
| 12 to 14 Years | 0 (0.0%) | 0 (0.0%) |
| 15 Years | 0 (0.0%) | 0 (0.0%) |
| 16 and 17 Years | 0 (0.0%) | 0 (0.0%) |
| 18 to 24 Years | 0 (0.0%) | 0 (0.0%) |
| 25 to 34 Years | 0 (0.0%) | 0 (0.0%) |
| 35 to 44 Years | 0 (0.0%) | 0 (0.0%) |
| 45 to 54 Years | 2 (20.0%) | 0 (0.0%) |
| 55 to 64 Years | 5 (23.8%) | 3 (27.3%) |
| 65 to 74 Years | 0 (0.0%) | 0 (0.0%) |
| 75 Years and over | 2 (100.0%) | 0 (0.0%) |
| Total | 9 (16.1%) | 3 (6.0%) |
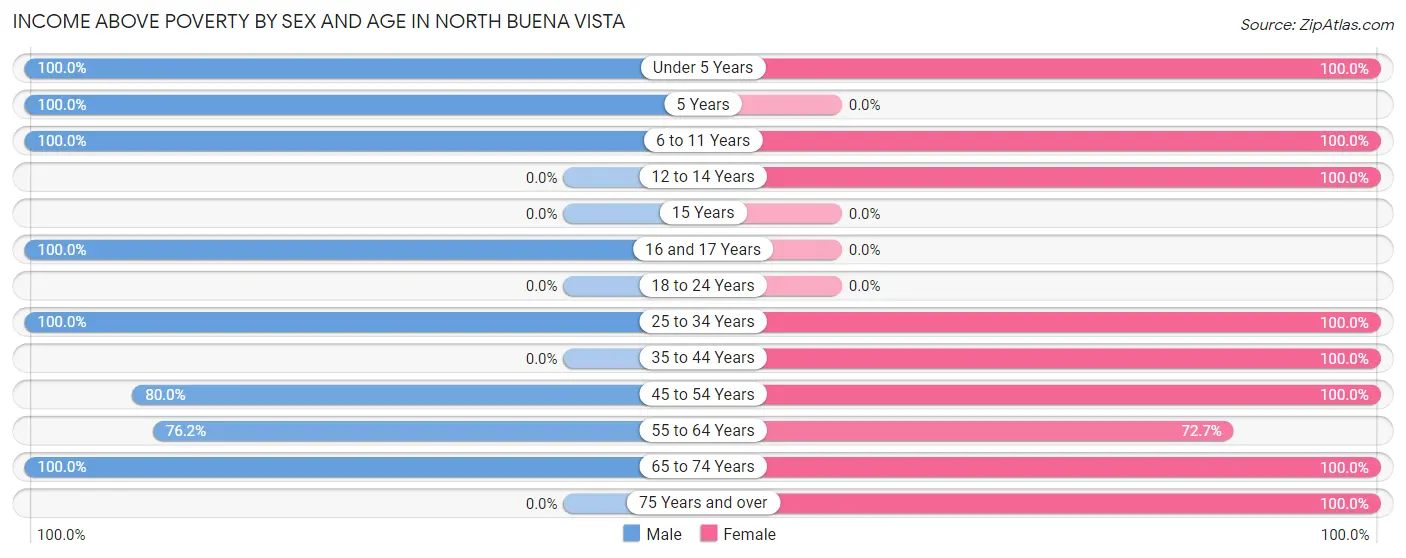
Income Above Poverty by Sex and Age in North Buena Vista
According to the poverty statistics in North Buena Vista, males aged under 5 years and females aged under 5 years are the age groups that are most secure financially, with 100.0% of males and 100.0% of females in these age groups living above the poverty line.
| Age Bracket | Male | Female |
| Under 5 Years | 3 (100.0%) | 5 (100.0%) |
| 5 Years | 2 (100.0%) | 0 (0.0%) |
| 6 to 11 Years | 2 (100.0%) | 1 (100.0%) |
| 12 to 14 Years | 0 (0.0%) | 2 (100.0%) |
| 15 Years | 0 (0.0%) | 0 (0.0%) |
| 16 and 17 Years | 4 (100.0%) | 0 (0.0%) |
| 18 to 24 Years | 0 (0.0%) | 0 (0.0%) |
| 25 to 34 Years | 7 (100.0%) | 5 (100.0%) |
| 35 to 44 Years | 0 (0.0%) | 8 (100.0%) |
| 45 to 54 Years | 8 (80.0%) | 5 (100.0%) |
| 55 to 64 Years | 16 (76.2%) | 8 (72.7%) |
| 65 to 74 Years | 5 (100.0%) | 10 (100.0%) |
| 75 Years and over | 0 (0.0%) | 3 (100.0%) |
| Total | 47 (83.9%) | 47 (94.0%) |
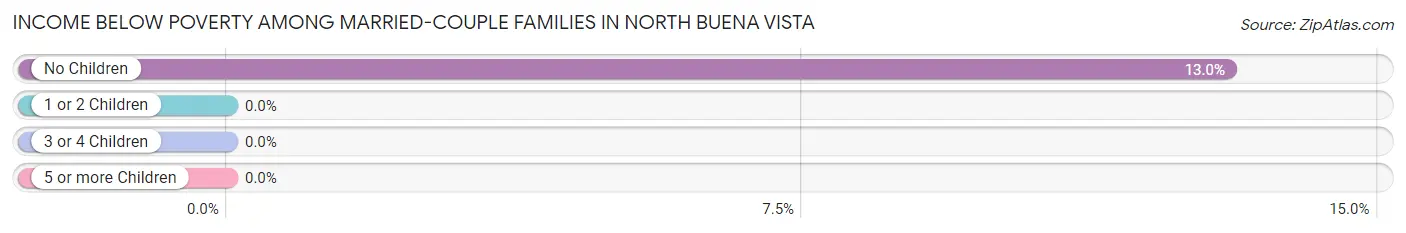
Income Below Poverty Among Married-Couple Families in North Buena Vista
The poverty statistics for married-couple families in North Buena Vista show that 10.0% or 3 of the total 30 families live below the poverty line. Families with no children have the highest poverty rate of 13.0%, comprising of 3 families. On the other hand, families with 1 or 2 children have the lowest poverty rate of 0.0%, which includes 0 families.
| Children | Above Poverty | Below Poverty |
| No Children | 20 (87.0%) | 3 (13.0%) |
| 1 or 2 Children | 4 (100.0%) | 0 (0.0%) |
| 3 or 4 Children | 3 (100.0%) | 0 (0.0%) |
| 5 or more Children | 0 (0.0%) | 0 (0.0%) |
| Total | 27 (90.0%) | 3 (10.0%) |
Income Below Poverty Among Single-Parent Households in North Buena Vista
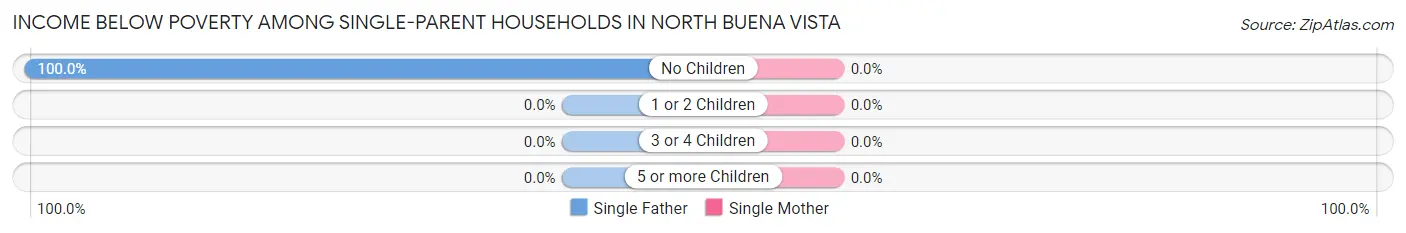
| Children | Single Father | Single Mother |
| No Children | 2 (100.0%) | 0 (0.0%) |
| 1 or 2 Children | 0 (0.0%) | 0 (0.0%) |
| 3 or 4 Children | 0 (0.0%) | 0 (0.0%) |
| 5 or more Children | 0 (0.0%) | 0 (0.0%) |
| Total | 2 (100.0%) | 0 (0.0%) |
Income Below Poverty Among Married-Couple vs Single-Parent Households in North Buena Vista
The poverty data for North Buena Vista shows that 3 of the married-couple family households (10.0%) and 2 of the single-parent households (100.0%) are living below the poverty level. Within the married-couple family households, those with no children have the highest poverty rate, with 3 households (13.0%) falling below the poverty line. Among the single-parent households, those with no children have the highest poverty rate, with 2 household (100.0%) living below poverty.
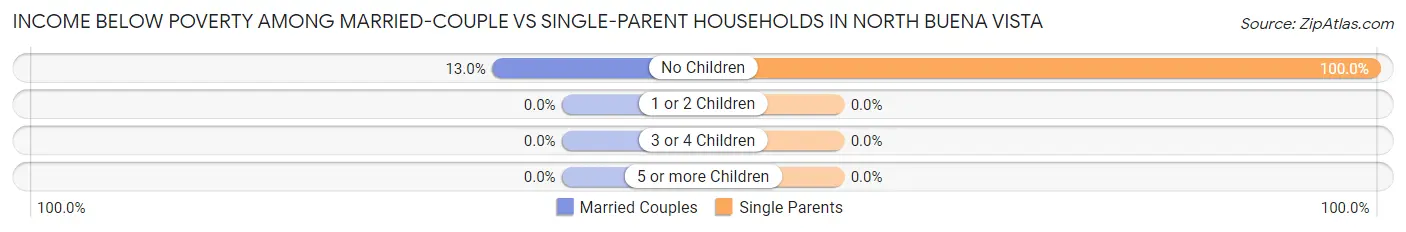
| Children | Married-Couple Families | Single-Parent Households |
| No Children | 3 (13.0%) | 2 (100.0%) |
| 1 or 2 Children | 0 (0.0%) | 0 (0.0%) |
| 3 or 4 Children | 0 (0.0%) | 0 (0.0%) |
| 5 or more Children | 0 (0.0%) | 0 (0.0%) |
| Total | 3 (10.0%) | 2 (100.0%) |
Race in North Buena Vista
The most populous races in North Buena Vista are , and White / Caucasian (106 | 100.0%).
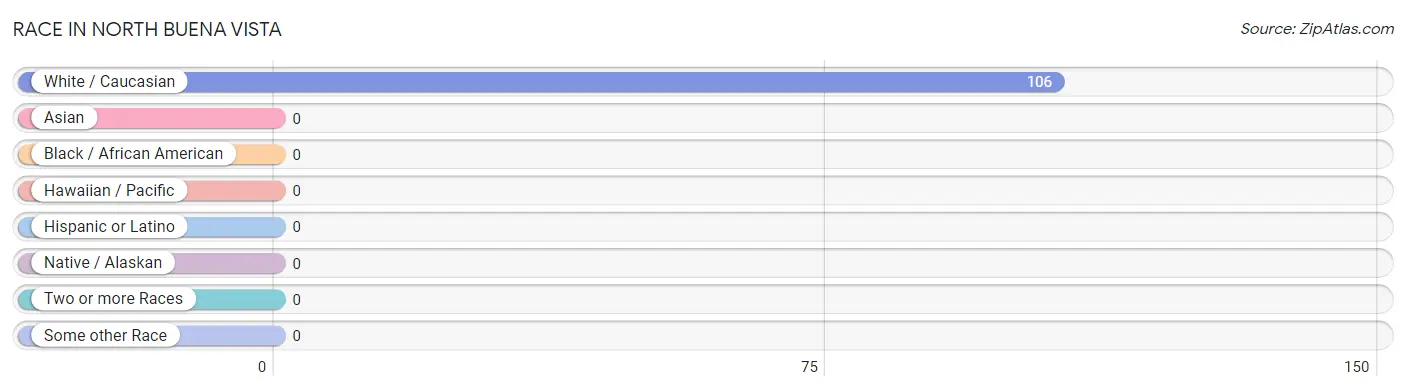
| Race | # Population | % Population |
| Asian | 0 | 0.0% |
| Black / African American | 0 | 0.0% |
| Hawaiian / Pacific | 0 | 0.0% |
| Hispanic or Latino | 0 | 0.0% |
| Native / Alaskan | 0 | 0.0% |
| White / Caucasian | 106 | 100.0% |
| Two or more Races | 0 | 0.0% |
| Some other Race | 0 | 0.0% |
| Total | 106 | 100.0% |
Ancestry in North Buena Vista
The most populous ancestries reported in North Buena Vista are German (53 | 50.0%), English (20 | 18.9%), American (3 | 2.8%), Austrian (3 | 2.8%), and Scottish (3 | 2.8%), together accounting for 77.4% of all North Buena Vista residents.
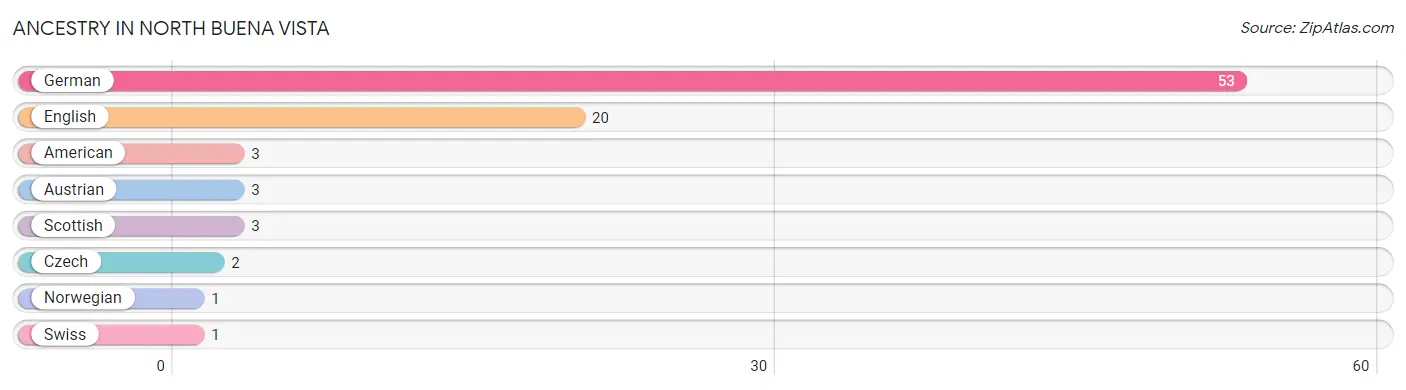
| Ancestry | # Population | % Population |
| American | 3 | 2.8% |
| Austrian | 3 | 2.8% |
| Czech | 2 | 1.9% |
| English | 20 | 18.9% |
| German | 53 | 50.0% |
| Norwegian | 1 | 0.9% |
| Scottish | 3 | 2.8% |
| Swiss | 1 | 0.9% | View All 8 Rows |
Immigrants in North Buena Vista

| Immigration Origin | # Population | % Population | View All 0 Rows |
Sex and Age in North Buena Vista
Sex and Age in North Buena Vista
The most populous age groups in North Buena Vista are 60 to 64 Years (17 | 30.4%) for men and 40 to 44 Years (8 | 16.0%) for women.
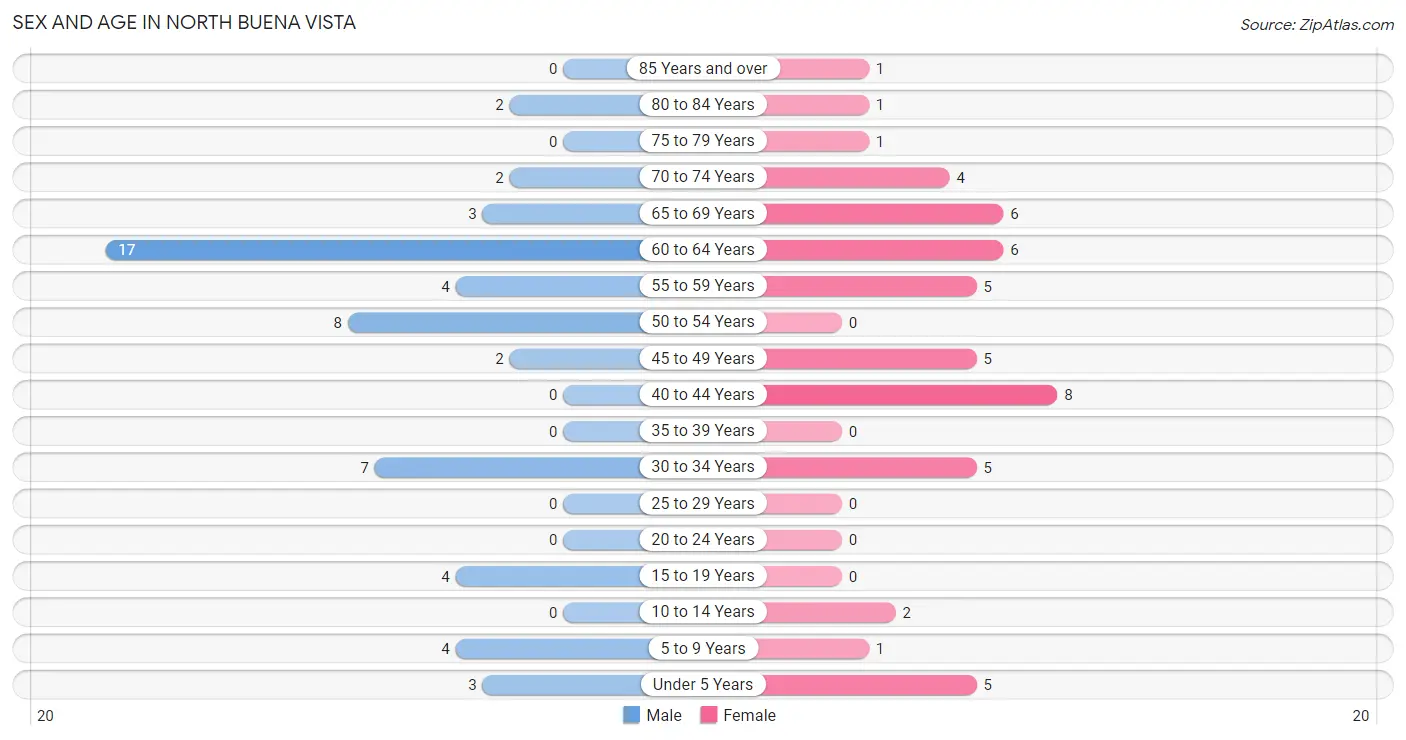
| Age Bracket | Male | Female |
| Under 5 Years | 3 (5.4%) | 5 (10.0%) |
| 5 to 9 Years | 4 (7.1%) | 1 (2.0%) |
| 10 to 14 Years | 0 (0.0%) | 2 (4.0%) |
| 15 to 19 Years | 4 (7.1%) | 0 (0.0%) |
| 20 to 24 Years | 0 (0.0%) | 0 (0.0%) |
| 25 to 29 Years | 0 (0.0%) | 0 (0.0%) |
| 30 to 34 Years | 7 (12.5%) | 5 (10.0%) |
| 35 to 39 Years | 0 (0.0%) | 0 (0.0%) |
| 40 to 44 Years | 0 (0.0%) | 8 (16.0%) |
| 45 to 49 Years | 2 (3.6%) | 5 (10.0%) |
| 50 to 54 Years | 8 (14.3%) | 0 (0.0%) |
| 55 to 59 Years | 4 (7.1%) | 5 (10.0%) |
| 60 to 64 Years | 17 (30.4%) | 6 (12.0%) |
| 65 to 69 Years | 3 (5.4%) | 6 (12.0%) |
| 70 to 74 Years | 2 (3.6%) | 4 (8.0%) |
| 75 to 79 Years | 0 (0.0%) | 1 (2.0%) |
| 80 to 84 Years | 2 (3.6%) | 1 (2.0%) |
| 85 Years and over | 0 (0.0%) | 1 (2.0%) |
| Total | 56 (100.0%) | 50 (100.0%) |
Families and Households in North Buena Vista
Median Family Size in North Buena Vista
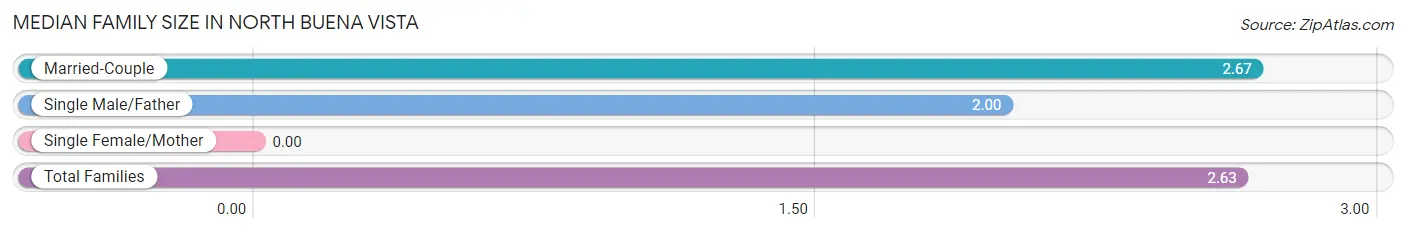
| Family Type | # Families | Family Size |
| Married-Couple | 30 (93.8%) | 2.67 |
| Single Male/Father | 2 (6.2%) | 2.00 |
| Single Female/Mother | 0 (0.0%) | - |
| Total Families | 32 (100.0%) | 2.63 |
Median Household Size in North Buena Vista
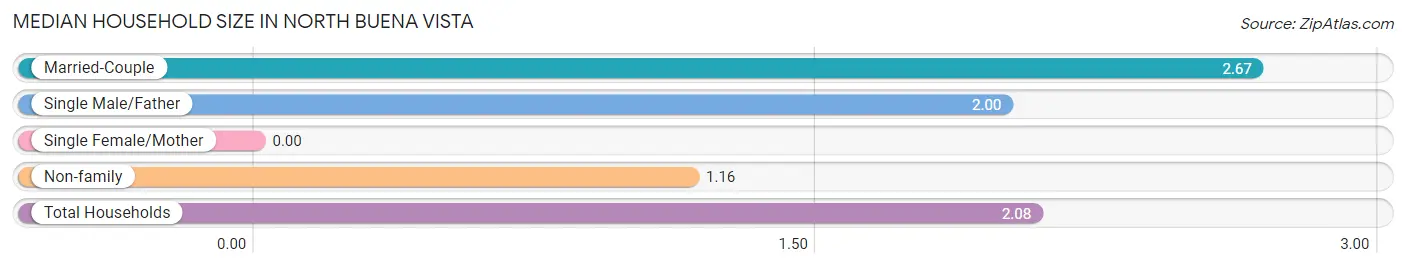
| Household Type | # Households | Household Size |
| Married-Couple | 30 (58.8%) | 2.67 |
| Single Male/Father | 2 (3.9%) | 2.00 |
| Single Female/Mother | 0 (0.0%) | - |
| Non-family | 19 (37.2%) | 1.16 |
| Total Households | 51 (100.0%) | 2.08 |
Household Size by Marriage Status in North Buena Vista
Out of a total of 51 households in North Buena Vista, 32 (62.7%) are family households, while 19 (37.2%) are nonfamily households. The most numerous type of family households are 2-person households, comprising 25, and the most common type of nonfamily households are 1-person households, comprising 15.
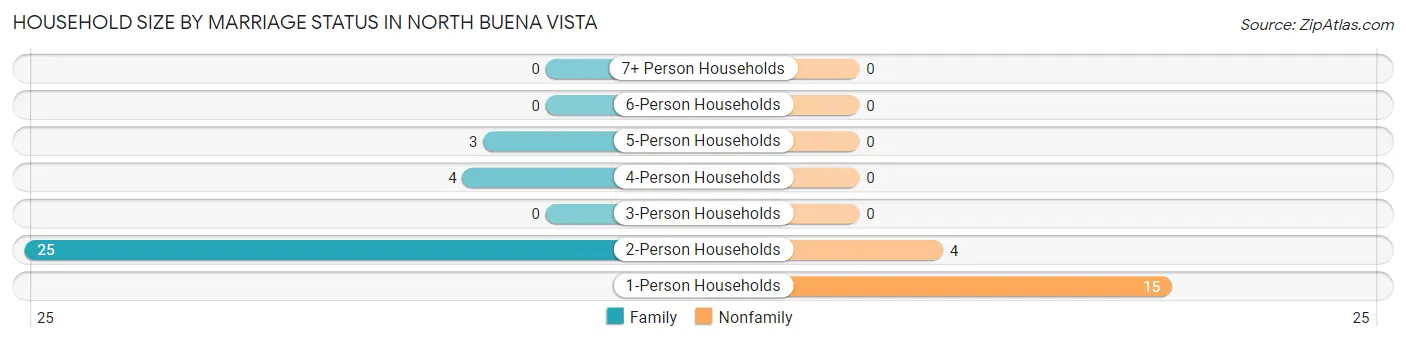
| Household Size | Family Households | Nonfamily Households |
| 1-Person Households | - | 15 (29.4%) |
| 2-Person Households | 25 (49.0%) | 4 (7.8%) |
| 3-Person Households | 0 (0.0%) | 0 (0.0%) |
| 4-Person Households | 4 (7.8%) | 0 (0.0%) |
| 5-Person Households | 3 (5.9%) | 0 (0.0%) |
| 6-Person Households | 0 (0.0%) | 0 (0.0%) |
| 7+ Person Households | 0 (0.0%) | 0 (0.0%) |
| Total | 32 (62.7%) | 19 (37.2%) |
Female Fertility in North Buena Vista
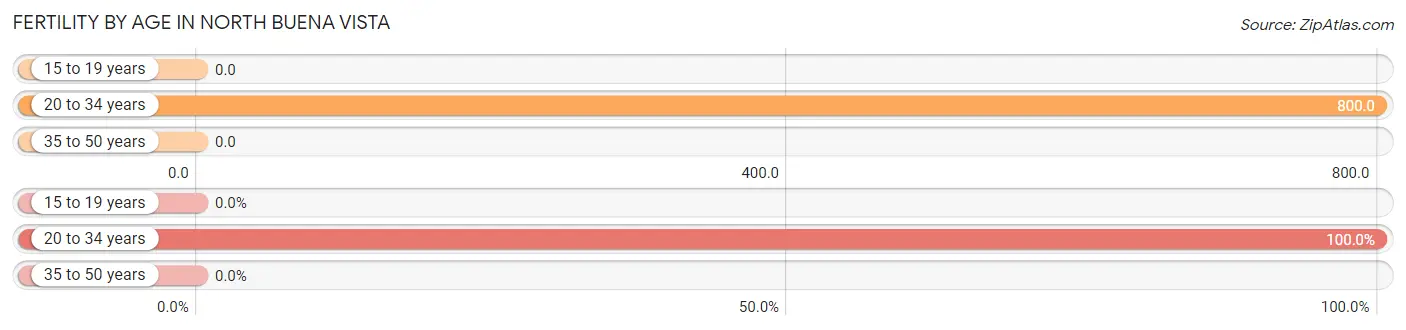
Fertility by Age in North Buena Vista
Average fertility rate in North Buena Vista is 222.0 births per 1,000 women. Women in the age bracket of 20 to 34 years have the highest fertility rate with 800.0 births per 1,000 women. Women in the age bracket of 20 to 34 years acount for 100.0% of all women with births.
| Age Bracket | Women with Births | Births / 1,000 Women |
| 15 to 19 years | 0 (0.0%) | 0.0 |
| 20 to 34 years | 4 (100.0%) | 800.0 |
| 35 to 50 years | 0 (0.0%) | 0.0 |
| Total | 4 (100.0%) | 222.0 |
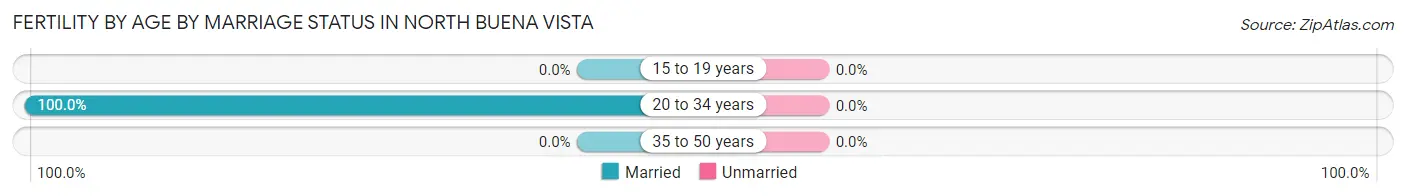
Fertility by Age by Marriage Status in North Buena Vista
| Age Bracket | Married | Unmarried |
| 15 to 19 years | 0 (0.0%) | 0 (0.0%) |
| 20 to 34 years | 4 (100.0%) | 0 (0.0%) |
| 35 to 50 years | 0 (0.0%) | 0 (0.0%) |
| Total | 4 (100.0%) | 0 (0.0%) |
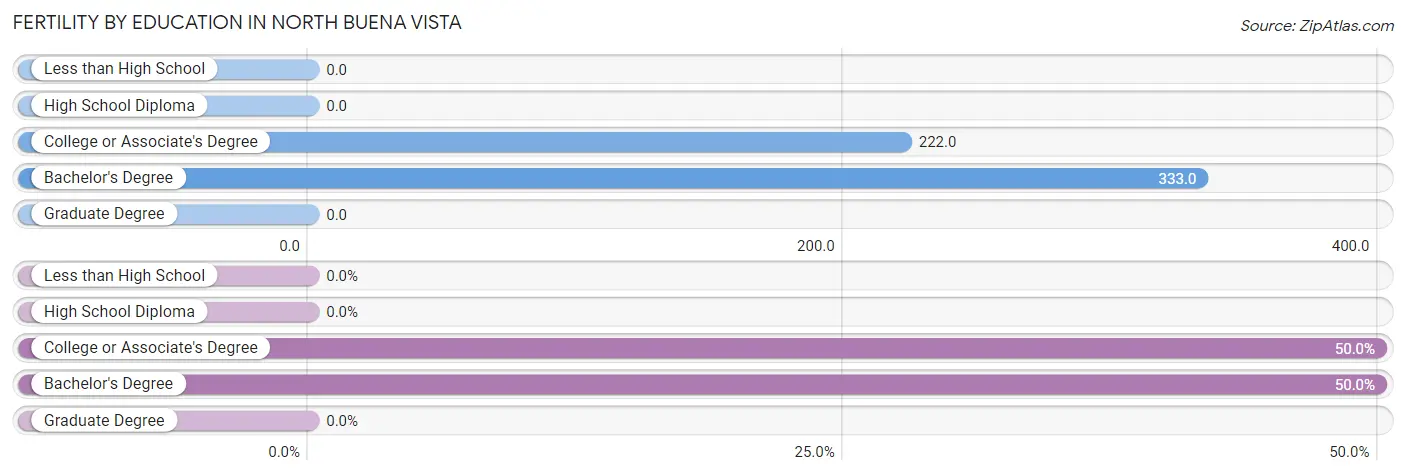
Fertility by Education in North Buena Vista
| Educational Attainment | Women with Births | Births / 1,000 Women |
| Less than High School | 0 (0.0%) | 0.0 |
| High School Diploma | 0 (0.0%) | 0.0 |
| College or Associate's Degree | 2 (50.0%) | 222.0 |
| Bachelor's Degree | 2 (50.0%) | 333.0 |
| Graduate Degree | 0 (0.0%) | 0.0 |
| Total | 4 (100.0%) | 222.0 |
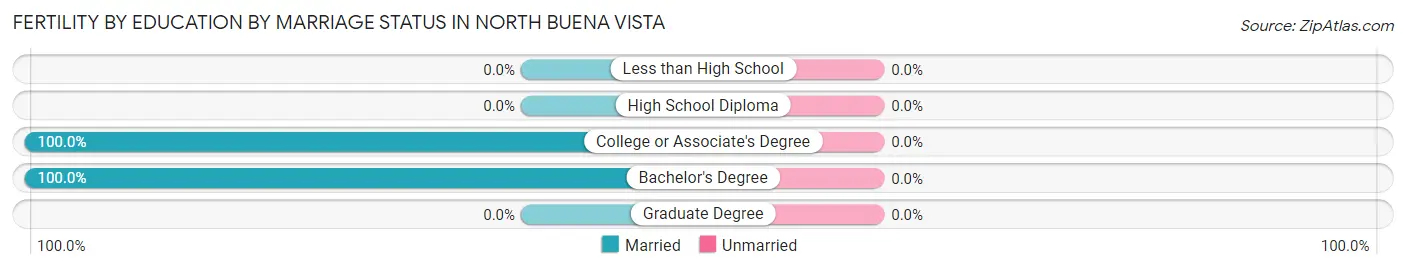
Fertility by Education by Marriage Status in North Buena Vista
| Educational Attainment | Married | Unmarried |
| Less than High School | 0 (0.0%) | 0 (0.0%) |
| High School Diploma | 0 (0.0%) | 0 (0.0%) |
| College or Associate's Degree | 2 (100.0%) | 0 (0.0%) |
| Bachelor's Degree | 2 (100.0%) | 0 (0.0%) |
| Graduate Degree | 0 (0.0%) | 0 (0.0%) |
| Total | 4 (100.0%) | 0 (0.0%) |
Employment Characteristics in North Buena Vista
Employment by Class of Employer in North Buena Vista
Among the 40 employed individuals in North Buena Vista, private company employees (24 | 60.0%), not-for-profit organizations (7 | 17.5%), and self-employed (not incorporated) (5 | 12.5%) make up the most common classes of employment.
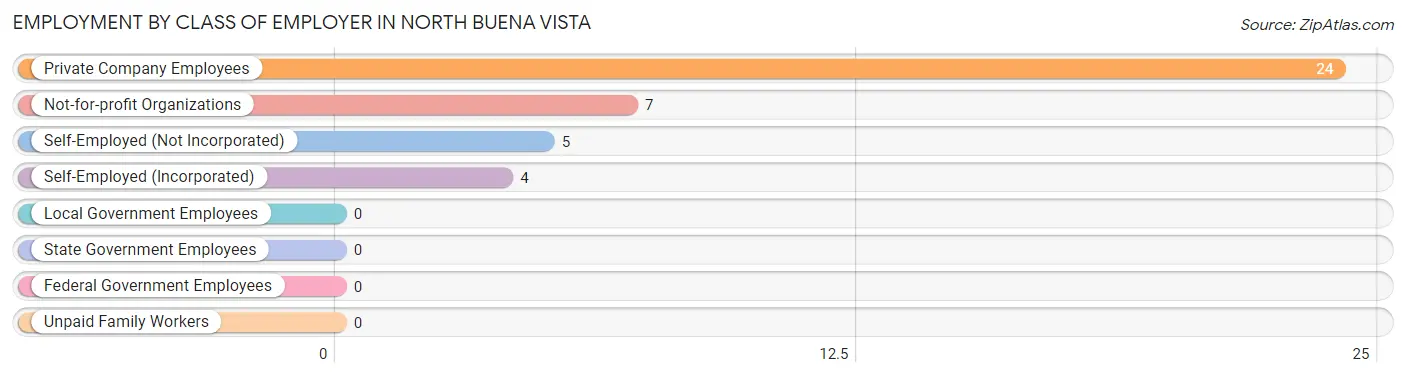
| Employer Class | # Employees | % Employees |
| Private Company Employees | 24 | 60.0% |
| Self-Employed (Incorporated) | 4 | 10.0% |
| Self-Employed (Not Incorporated) | 5 | 12.5% |
| Not-for-profit Organizations | 7 | 17.5% |
| Local Government Employees | 0 | 0.0% |
| State Government Employees | 0 | 0.0% |
| Federal Government Employees | 0 | 0.0% |
| Unpaid Family Workers | 0 | 0.0% |
| Total | 40 | 100.0% |
Employment Status by Age in North Buena Vista
According to the labor force statistics for North Buena Vista, out of the total population over 16 years of age (91), 48.4% or 44 individuals are in the labor force, with 9.1% or 4 of them unemployed. The age group with the highest labor force participation rate is 16 to 19 years, with 100.0% or 4 individuals in the labor force. Within the labor force, the 16 to 19 years age range has the highest percentage of unemployed individuals, with 100.0% or 4 of them being unemployed.
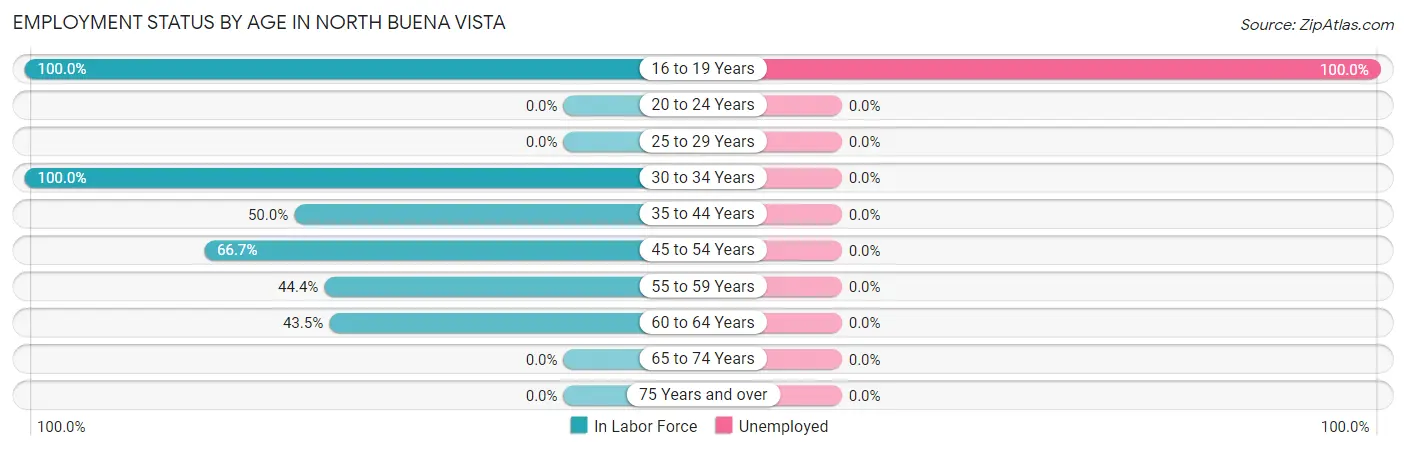
| Age Bracket | In Labor Force | Unemployed |
| 16 to 19 Years | 4 (100.0%) | 4 (100.0%) |
| 20 to 24 Years | 0 (0.0%) | 0 (0.0%) |
| 25 to 29 Years | 0 (0.0%) | 0 (0.0%) |
| 30 to 34 Years | 12 (100.0%) | 0 (0.0%) |
| 35 to 44 Years | 4 (50.0%) | 0 (0.0%) |
| 45 to 54 Years | 10 (66.7%) | 0 (0.0%) |
| 55 to 59 Years | 4 (44.4%) | 0 (0.0%) |
| 60 to 64 Years | 10 (43.5%) | 0 (0.0%) |
| 65 to 74 Years | 0 (0.0%) | 0 (0.0%) |
| 75 Years and over | 0 (0.0%) | 0 (0.0%) |
| Total | 44 (48.4%) | 4 (9.1%) |
Employment Status by Educational Attainment in North Buena Vista
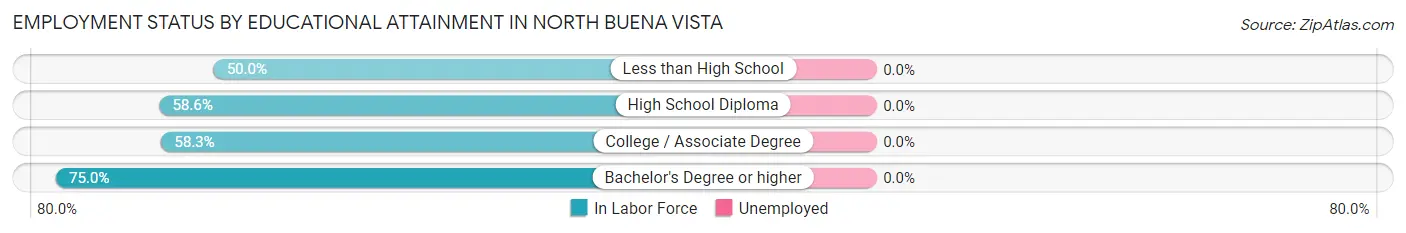
| Educational Attainment | In Labor Force | Unemployed |
| Less than High School | 3 (50.0%) | 0 (0.0%) |
| High School Diploma | 17 (58.6%) | 0 (0.0%) |
| College / Associate Degree | 14 (58.3%) | 0 (0.0%) |
| Bachelor's Degree or higher | 6 (75.0%) | 0 (0.0%) |
| Total | 40 (59.7%) | 0 (0.0%) |
Employment Occupations by Sex in North Buena Vista
Management, Business, Science and Arts Occupations
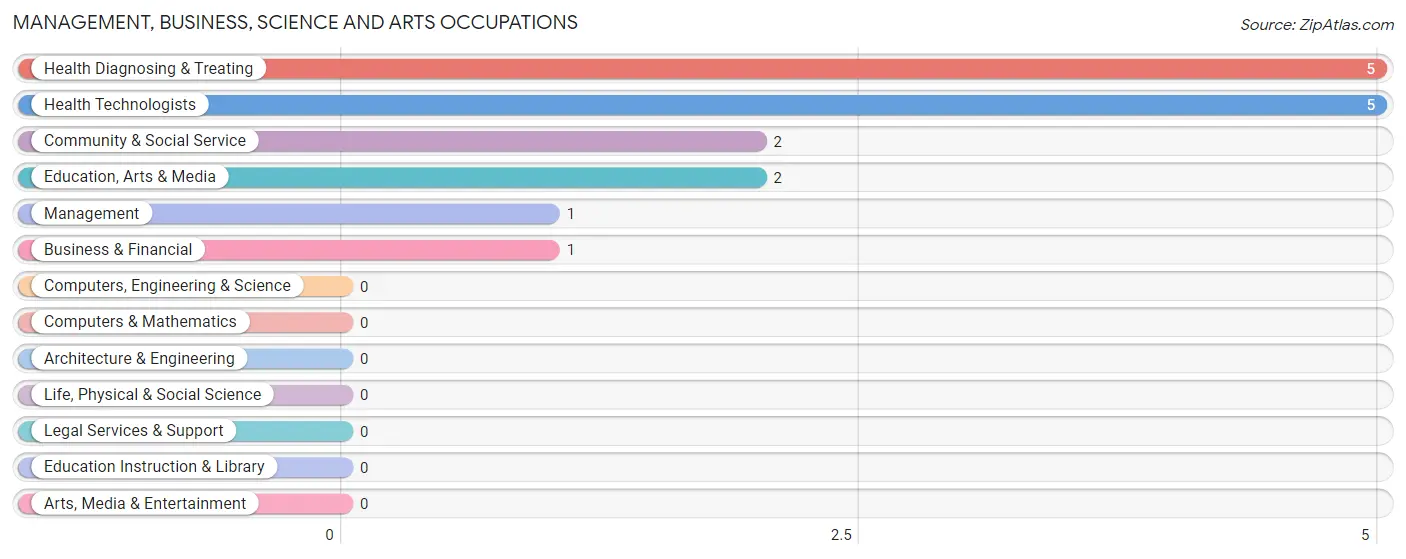
The most common Management, Business, Science and Arts occupations in North Buena Vista are Health Diagnosing & Treating (5 | 12.5%), Health Technologists (5 | 12.5%), Community & Social Service (2 | 5.0%), Education, Arts & Media (2 | 5.0%), and Management (1 | 2.5%).
Management, Business, Science and Arts Occupations by Sex
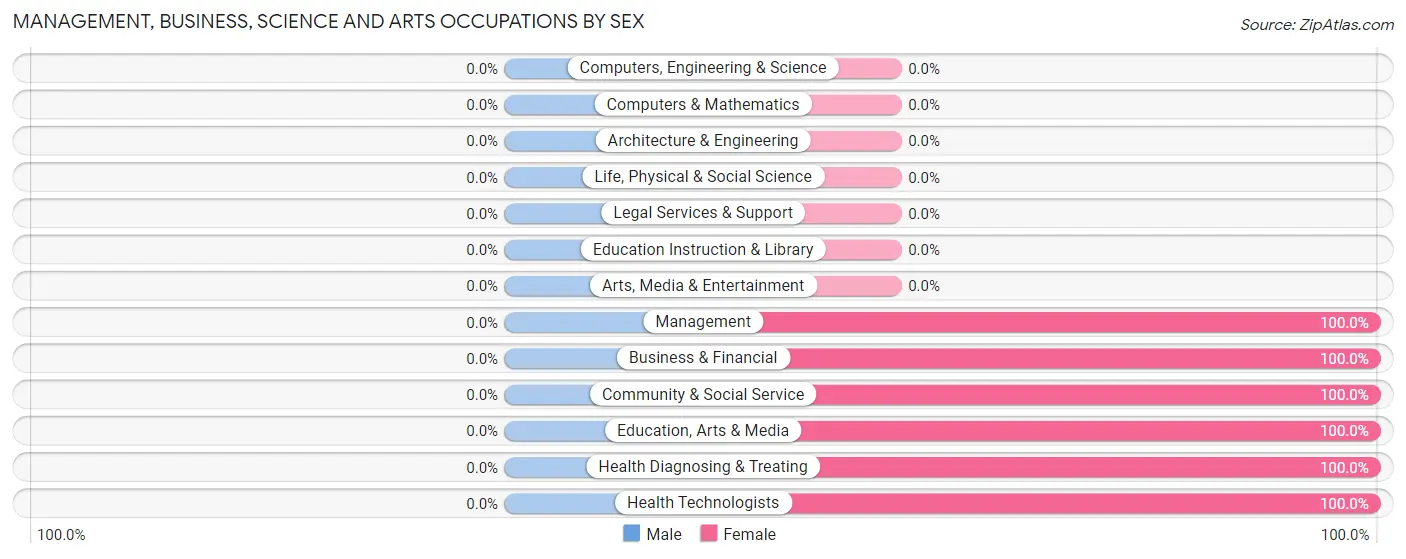
| Occupation | Male | Female |
| Management | 0 (0.0%) | 1 (100.0%) |
| Business & Financial | 0 (0.0%) | 1 (100.0%) |
| Computers, Engineering & Science | 0 (0.0%) | 0 (0.0%) |
| Computers & Mathematics | 0 (0.0%) | 0 (0.0%) |
| Architecture & Engineering | 0 (0.0%) | 0 (0.0%) |
| Life, Physical & Social Science | 0 (0.0%) | 0 (0.0%) |
| Community & Social Service | 0 (0.0%) | 2 (100.0%) |
| Education, Arts & Media | 0 (0.0%) | 2 (100.0%) |
| Legal Services & Support | 0 (0.0%) | 0 (0.0%) |
| Education Instruction & Library | 0 (0.0%) | 0 (0.0%) |
| Arts, Media & Entertainment | 0 (0.0%) | 0 (0.0%) |
| Health Diagnosing & Treating | 0 (0.0%) | 5 (100.0%) |
| Health Technologists | 0 (0.0%) | 5 (100.0%) |
| Total (Category) | 0 (0.0%) | 9 (100.0%) |
| Total (Overall) | 23 (57.5%) | 17 (42.5%) |
Services Occupations
The most common Services occupations in North Buena Vista are Personal Care & Service (2 | 5.0%), and Cleaning & Maintenance (1 | 2.5%).
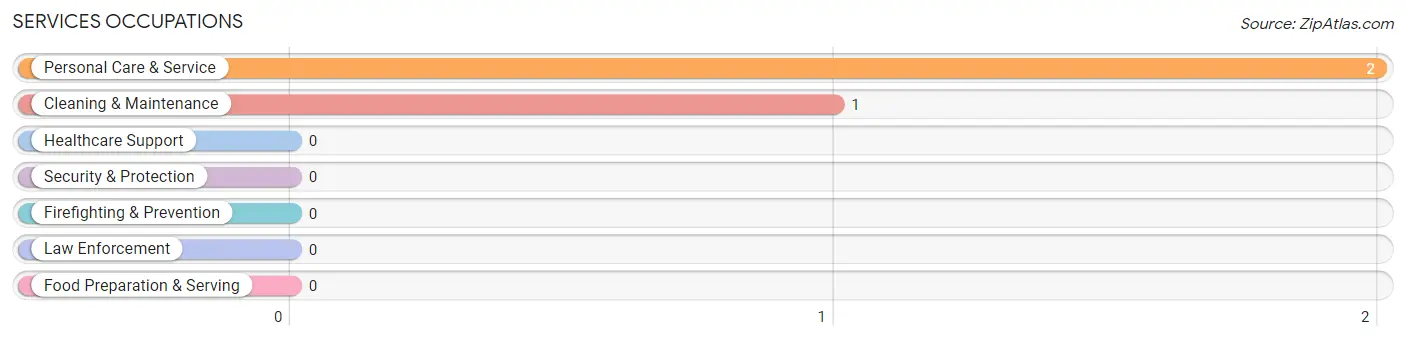
Services Occupations by Sex
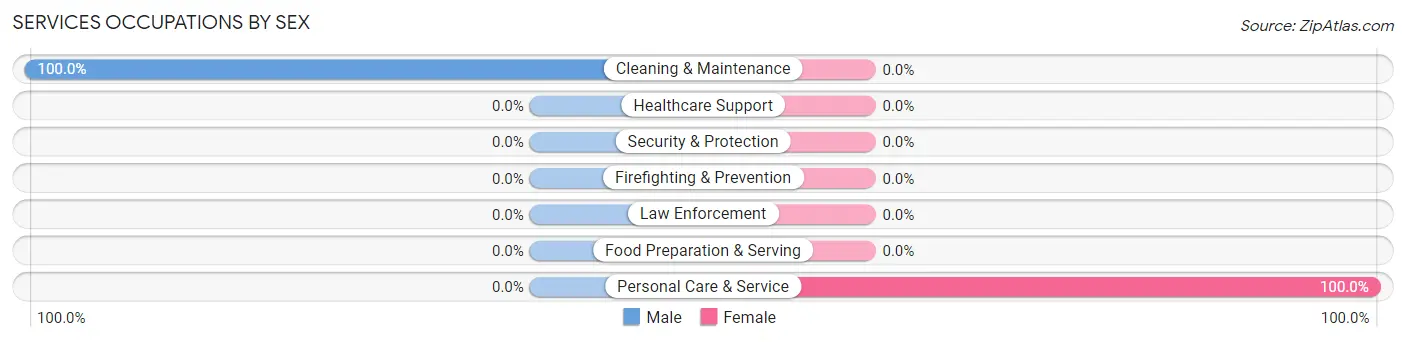
| Occupation | Male | Female |
| Healthcare Support | 0 (0.0%) | 0 (0.0%) |
| Security & Protection | 0 (0.0%) | 0 (0.0%) |
| Firefighting & Prevention | 0 (0.0%) | 0 (0.0%) |
| Law Enforcement | 0 (0.0%) | 0 (0.0%) |
| Food Preparation & Serving | 0 (0.0%) | 0 (0.0%) |
| Cleaning & Maintenance | 1 (100.0%) | 0 (0.0%) |
| Personal Care & Service | 0 (0.0%) | 2 (100.0%) |
| Total (Category) | 1 (33.3%) | 2 (66.7%) |
| Total (Overall) | 23 (57.5%) | 17 (42.5%) |
Sales and Office Occupations
The most common Sales and Office occupations in North Buena Vista are , and Office & Administration (4 | 10.0%).
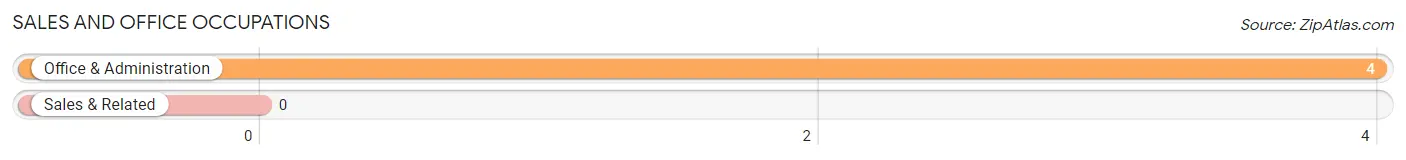
Sales and Office Occupations by Sex
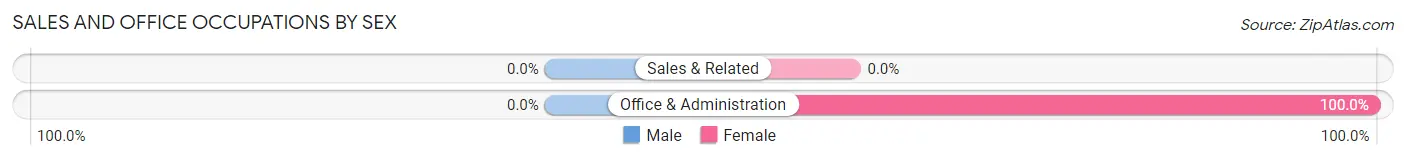
| Occupation | Male | Female |
| Sales & Related | 0 (0.0%) | 0 (0.0%) |
| Office & Administration | 0 (0.0%) | 4 (100.0%) |
| Total (Category) | 0 (0.0%) | 4 (100.0%) |
| Total (Overall) | 23 (57.5%) | 17 (42.5%) |
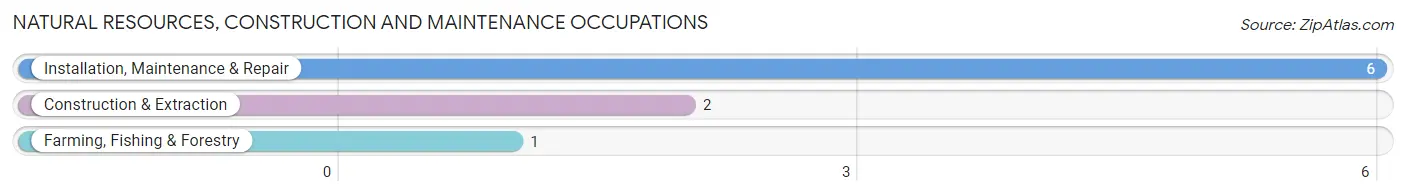
Natural Resources, Construction and Maintenance Occupations
The most common Natural Resources, Construction and Maintenance occupations in North Buena Vista are Installation, Maintenance & Repair (6 | 15.0%), Construction & Extraction (2 | 5.0%), and Farming, Fishing & Forestry (1 | 2.5%).
Natural Resources, Construction and Maintenance Occupations by Sex
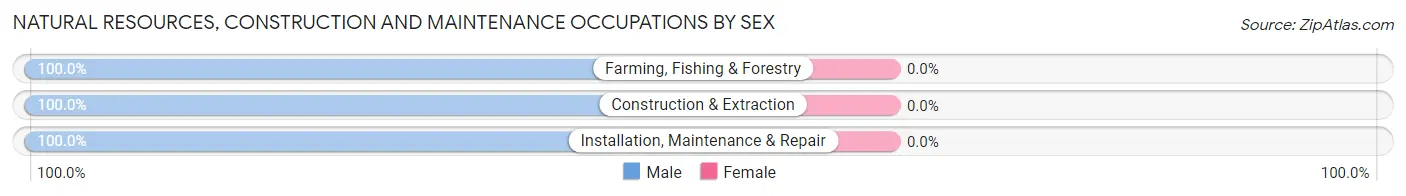
| Occupation | Male | Female |
| Farming, Fishing & Forestry | 1 (100.0%) | 0 (0.0%) |
| Construction & Extraction | 2 (100.0%) | 0 (0.0%) |
| Installation, Maintenance & Repair | 6 (100.0%) | 0 (0.0%) |
| Total (Category) | 9 (100.0%) | 0 (0.0%) |
| Total (Overall) | 23 (57.5%) | 17 (42.5%) |
Production, Transportation and Moving Occupations
The most common Production, Transportation and Moving occupations in North Buena Vista are Material Moving (7 | 17.5%), Production (6 | 15.0%), and Transportation (2 | 5.0%).
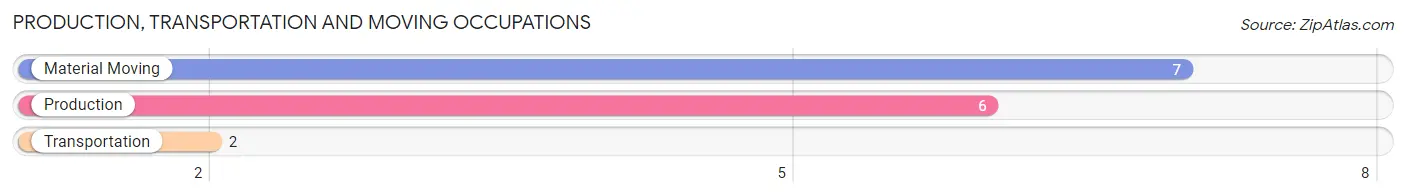
Production, Transportation and Moving Occupations by Sex
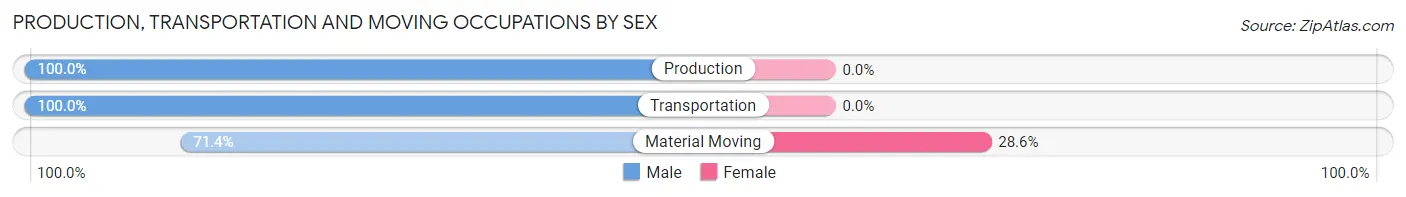
| Occupation | Male | Female |
| Production | 6 (100.0%) | 0 (0.0%) |
| Transportation | 2 (100.0%) | 0 (0.0%) |
| Material Moving | 5 (71.4%) | 2 (28.6%) |
| Total (Category) | 13 (86.7%) | 2 (13.3%) |
| Total (Overall) | 23 (57.5%) | 17 (42.5%) |
Employment Industries by Sex in North Buena Vista
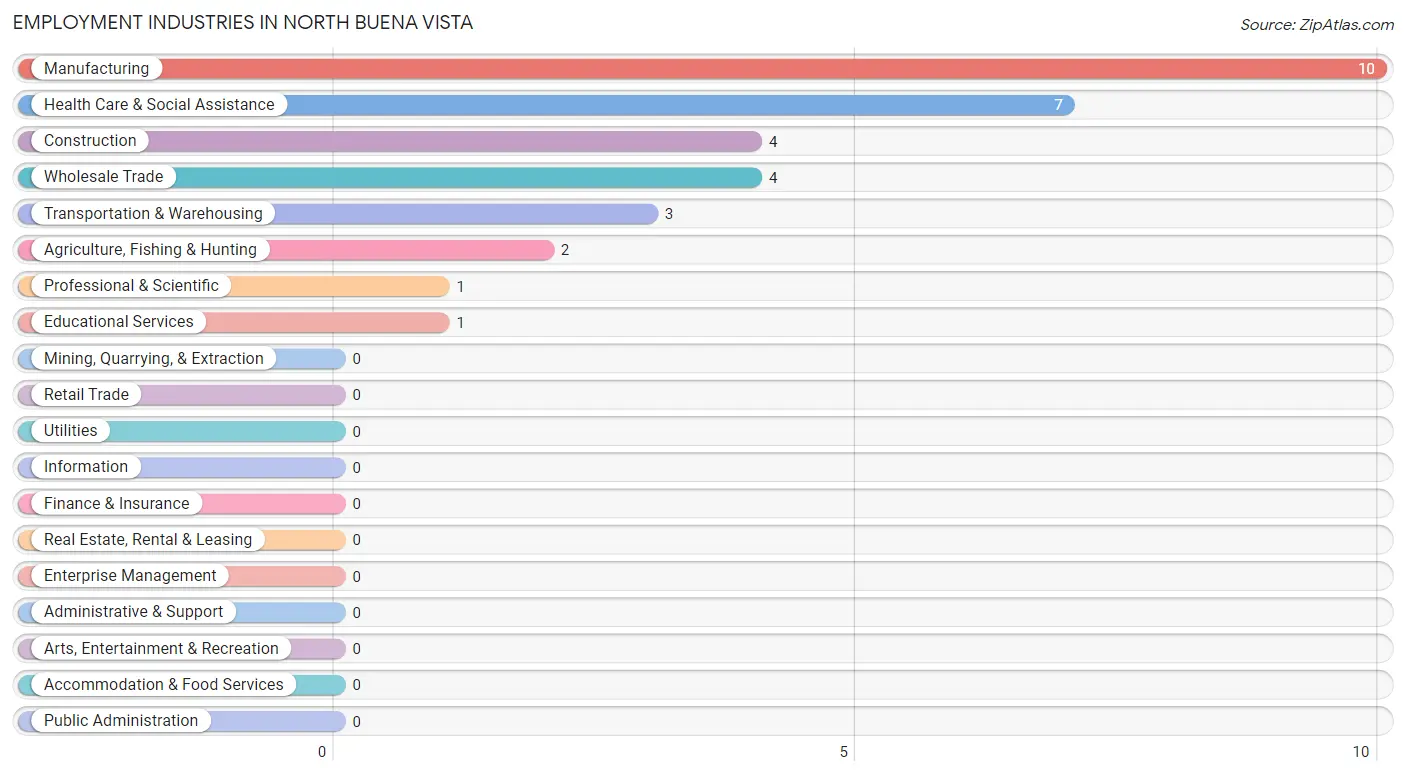
Employment Industries in North Buena Vista
The major employment industries in North Buena Vista include Manufacturing (10 | 25.0%), Health Care & Social Assistance (7 | 17.5%), Construction (4 | 10.0%), Wholesale Trade (4 | 10.0%), and Transportation & Warehousing (3 | 7.5%).
Employment Industries by Sex in North Buena Vista
The North Buena Vista industries that see more men than women are Construction (100.0%), Educational Services (100.0%), and Wholesale Trade (75.0%), whereas the industries that tend to have a higher number of women are Professional & Scientific (100.0%), Health Care & Social Assistance (100.0%), and Agriculture, Fishing & Hunting (50.0%).
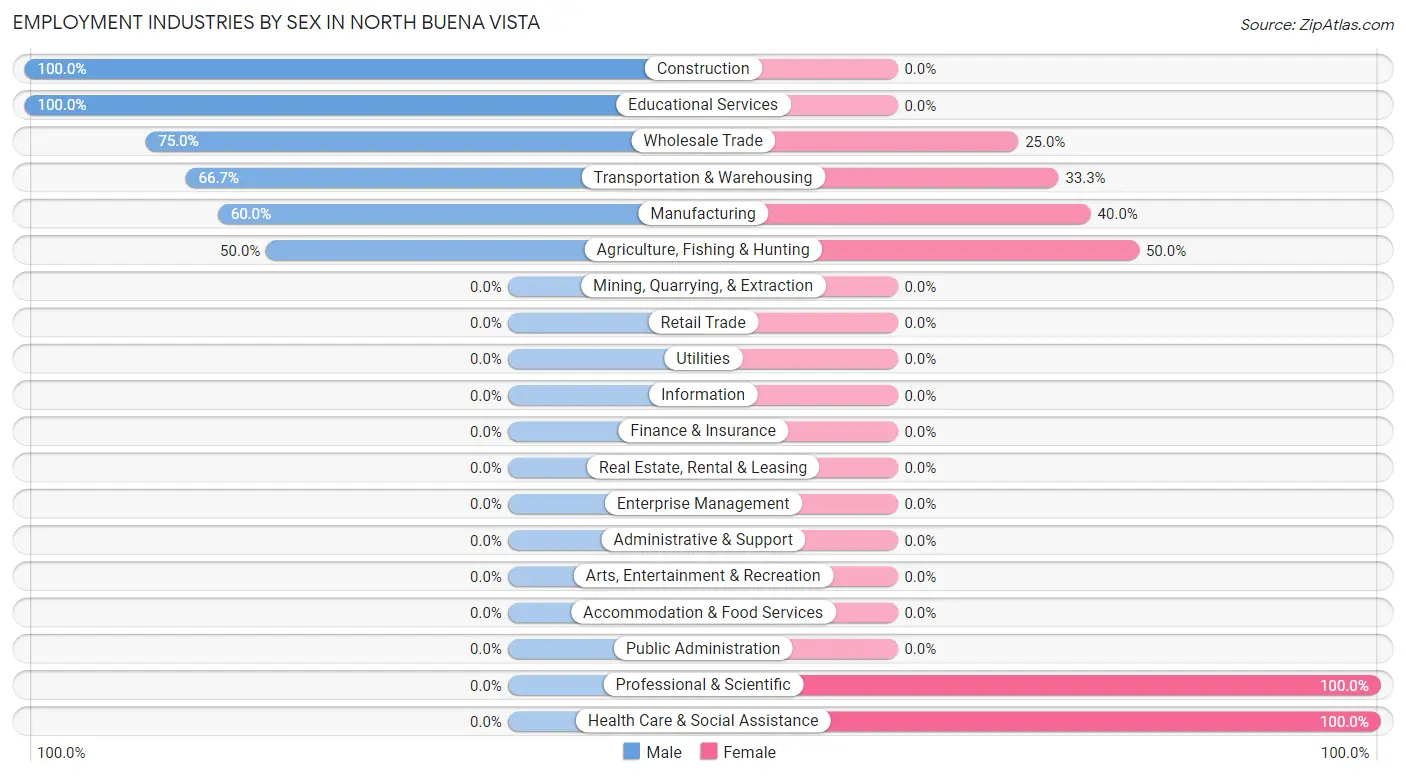
| Industry | Male | Female |
| Agriculture, Fishing & Hunting | 1 (50.0%) | 1 (50.0%) |
| Mining, Quarrying, & Extraction | 0 (0.0%) | 0 (0.0%) |
| Construction | 4 (100.0%) | 0 (0.0%) |
| Manufacturing | 6 (60.0%) | 4 (40.0%) |
| Wholesale Trade | 3 (75.0%) | 1 (25.0%) |
| Retail Trade | 0 (0.0%) | 0 (0.0%) |
| Transportation & Warehousing | 2 (66.7%) | 1 (33.3%) |
| Utilities | 0 (0.0%) | 0 (0.0%) |
| Information | 0 (0.0%) | 0 (0.0%) |
| Finance & Insurance | 0 (0.0%) | 0 (0.0%) |
| Real Estate, Rental & Leasing | 0 (0.0%) | 0 (0.0%) |
| Professional & Scientific | 0 (0.0%) | 1 (100.0%) |
| Enterprise Management | 0 (0.0%) | 0 (0.0%) |
| Administrative & Support | 0 (0.0%) | 0 (0.0%) |
| Educational Services | 1 (100.0%) | 0 (0.0%) |
| Health Care & Social Assistance | 0 (0.0%) | 7 (100.0%) |
| Arts, Entertainment & Recreation | 0 (0.0%) | 0 (0.0%) |
| Accommodation & Food Services | 0 (0.0%) | 0 (0.0%) |
| Public Administration | 0 (0.0%) | 0 (0.0%) |
| Total | 23 (57.5%) | 17 (42.5%) |
Education in North Buena Vista
School Enrollment in North Buena Vista
The most common levels of schooling among the 15 students in North Buena Vista are nursery / preschool (6 | 40.0%), high school (4 | 26.7%), and elementary school (3 | 20.0%).
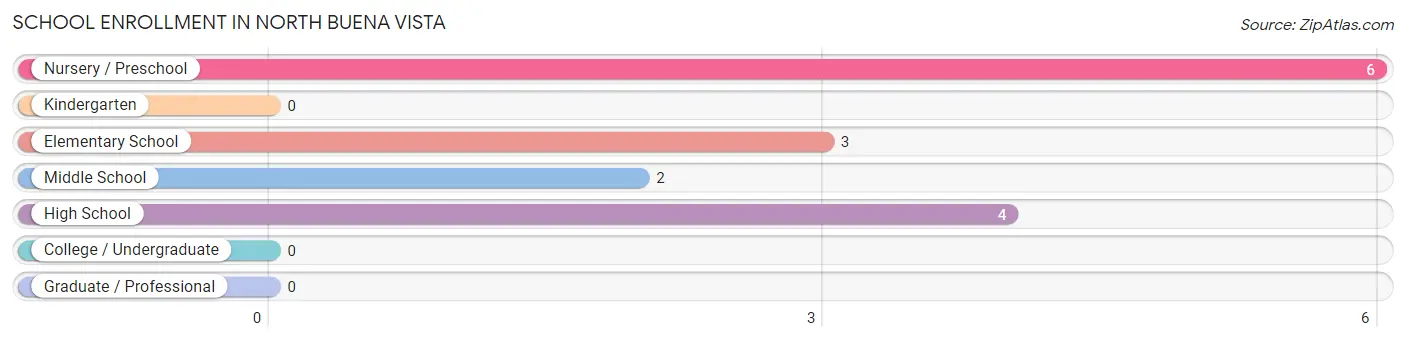
| School Level | # Students | % Students |
| Nursery / Preschool | 6 | 40.0% |
| Kindergarten | 0 | 0.0% |
| Elementary School | 3 | 20.0% |
| Middle School | 2 | 13.3% |
| High School | 4 | 26.7% |
| College / Undergraduate | 0 | 0.0% |
| Graduate / Professional | 0 | 0.0% |
| Total | 15 | 100.0% |
School Enrollment by Age by Funding Source in North Buena Vista
Out of a total of 15 students who are enrolled in schools in North Buena Vista, 4 (26.7%) attend a private institution, while the remaining 11 (73.3%) are enrolled in public schools. The age group of 5 to 9 year old has the highest likelihood of being enrolled in private schools, with 3 (60.0% in the age bracket) enrolled. Conversely, the age group of 10 to 14 year olds has the lowest likelihood of being enrolled in a private school, with 2 (100.0% in the age bracket) attending a public institution.
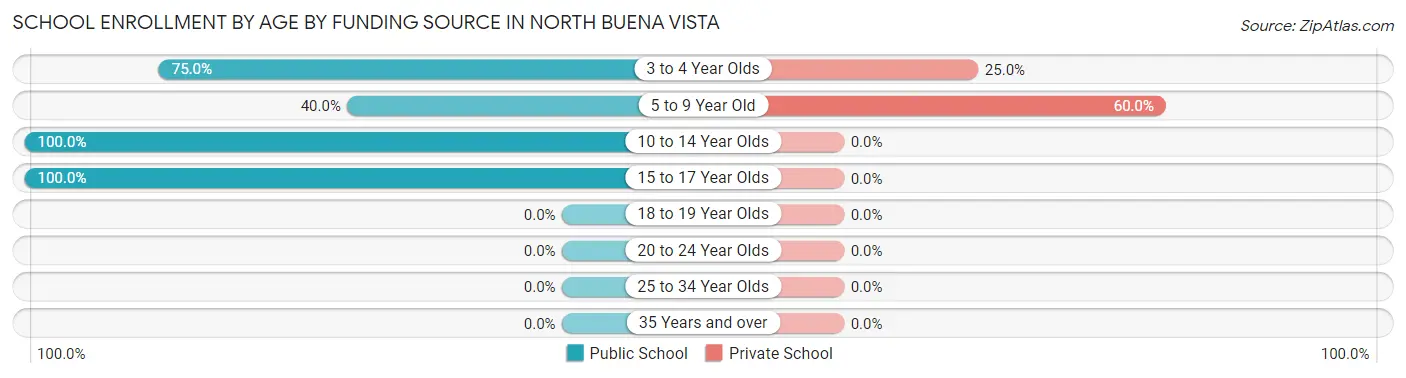
| Age Bracket | Public School | Private School |
| 3 to 4 Year Olds | 3 (75.0%) | 1 (25.0%) |
| 5 to 9 Year Old | 2 (40.0%) | 3 (60.0%) |
| 10 to 14 Year Olds | 2 (100.0%) | 0 (0.0%) |
| 15 to 17 Year Olds | 4 (100.0%) | 0 (0.0%) |
| 18 to 19 Year Olds | 0 (0.0%) | 0 (0.0%) |
| 20 to 24 Year Olds | 0 (0.0%) | 0 (0.0%) |
| 25 to 34 Year Olds | 0 (0.0%) | 0 (0.0%) |
| 35 Years and over | 0 (0.0%) | 0 (0.0%) |
| Total | 11 (73.3%) | 4 (26.7%) |
Educational Attainment by Field of Study in North Buena Vista
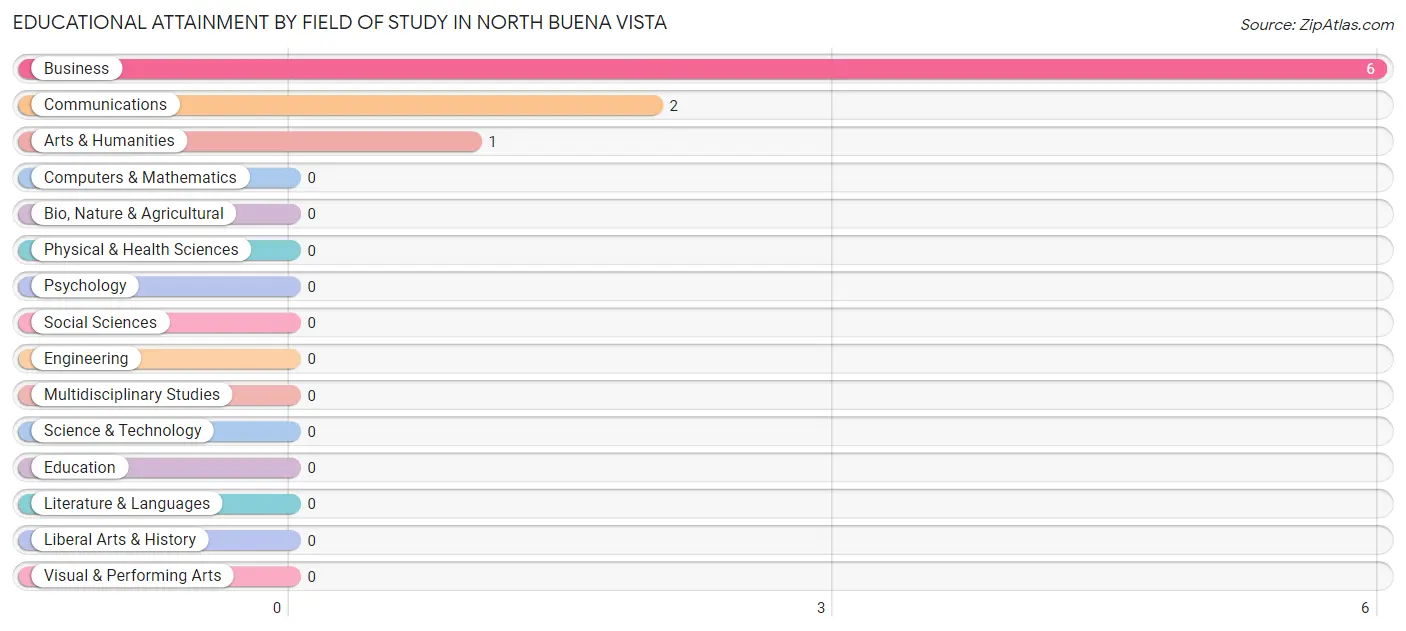
Business (6 | 66.7%), communications (2 | 22.2%), and arts & humanities (1 | 11.1%) are the most common fields of study among 9 individuals in North Buena Vista who have obtained a bachelor's degree or higher.
| Field of Study | # Graduates | % Graduates |
| Computers & Mathematics | 0 | 0.0% |
| Bio, Nature & Agricultural | 0 | 0.0% |
| Physical & Health Sciences | 0 | 0.0% |
| Psychology | 0 | 0.0% |
| Social Sciences | 0 | 0.0% |
| Engineering | 0 | 0.0% |
| Multidisciplinary Studies | 0 | 0.0% |
| Science & Technology | 0 | 0.0% |
| Business | 6 | 66.7% |
| Education | 0 | 0.0% |
| Literature & Languages | 0 | 0.0% |
| Liberal Arts & History | 0 | 0.0% |
| Visual & Performing Arts | 0 | 0.0% |
| Communications | 2 | 22.2% |
| Arts & Humanities | 1 | 11.1% |
| Total | 9 | 100.0% |
Transportation & Commute in North Buena Vista
Vehicle Availability by Sex in North Buena Vista
The most prevalent vehicle ownership categories in North Buena Vista are males with 2 vehicles (10, accounting for 43.5%) and females with 2 vehicles (6, making up 58.8%).
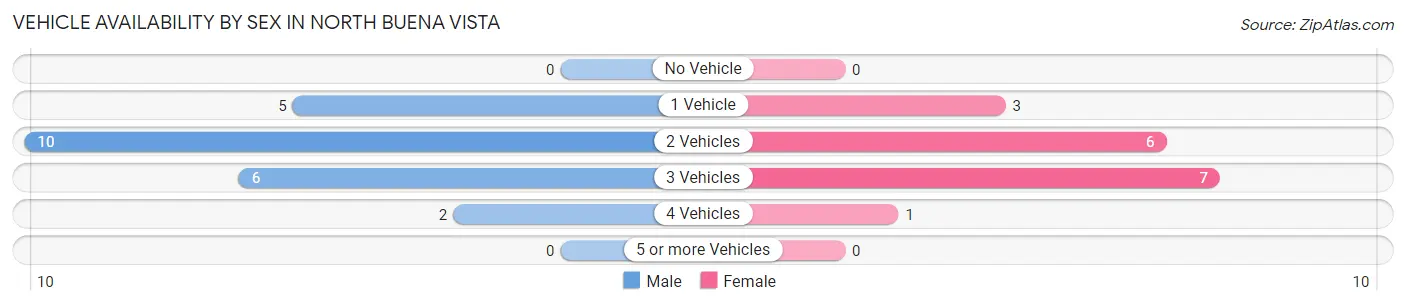
| Vehicles Available | Male | Female |
| No Vehicle | 0 (0.0%) | 0 (0.0%) |
| 1 Vehicle | 5 (21.7%) | 3 (17.6%) |
| 2 Vehicles | 10 (43.5%) | 6 (35.3%) |
| 3 Vehicles | 6 (26.1%) | 7 (41.2%) |
| 4 Vehicles | 2 (8.7%) | 1 (5.9%) |
| 5 or more Vehicles | 0 (0.0%) | 0 (0.0%) |
| Total | 23 (100.0%) | 17 (100.0%) |
Commute Time in North Buena Vista
The most frequently occuring commute durations in North Buena Vista are 30 to 34 minutes (11 commuters, 28.9%), 5 to 9 minutes (6 commuters, 15.8%), and 45 to 59 minutes (5 commuters, 13.2%).
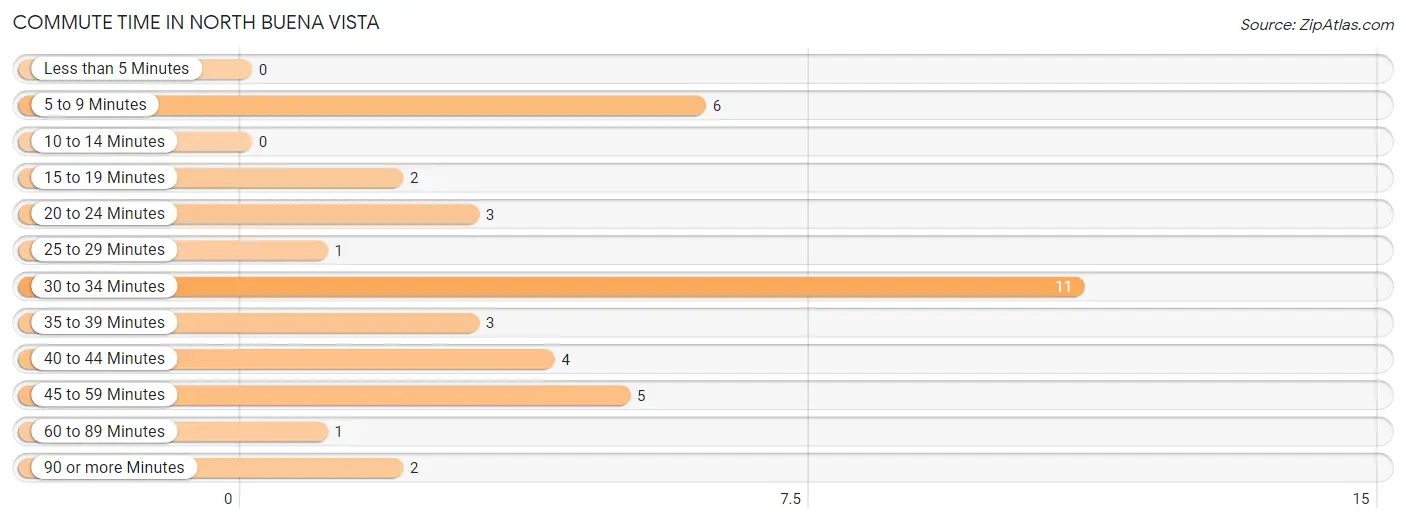
| Commute Time | # Commuters | % Commuters |
| Less than 5 Minutes | 0 | 0.0% |
| 5 to 9 Minutes | 6 | 15.8% |
| 10 to 14 Minutes | 0 | 0.0% |
| 15 to 19 Minutes | 2 | 5.3% |
| 20 to 24 Minutes | 3 | 7.9% |
| 25 to 29 Minutes | 1 | 2.6% |
| 30 to 34 Minutes | 11 | 28.9% |
| 35 to 39 Minutes | 3 | 7.9% |
| 40 to 44 Minutes | 4 | 10.5% |
| 45 to 59 Minutes | 5 | 13.2% |
| 60 to 89 Minutes | 1 | 2.6% |
| 90 or more Minutes | 2 | 5.3% |
Commute Time by Sex in North Buena Vista
The most common commute times in North Buena Vista are 5 to 9 minutes (6 commuters, 26.1%) for males and 30 to 34 minutes (6 commuters, 40.0%) for females.
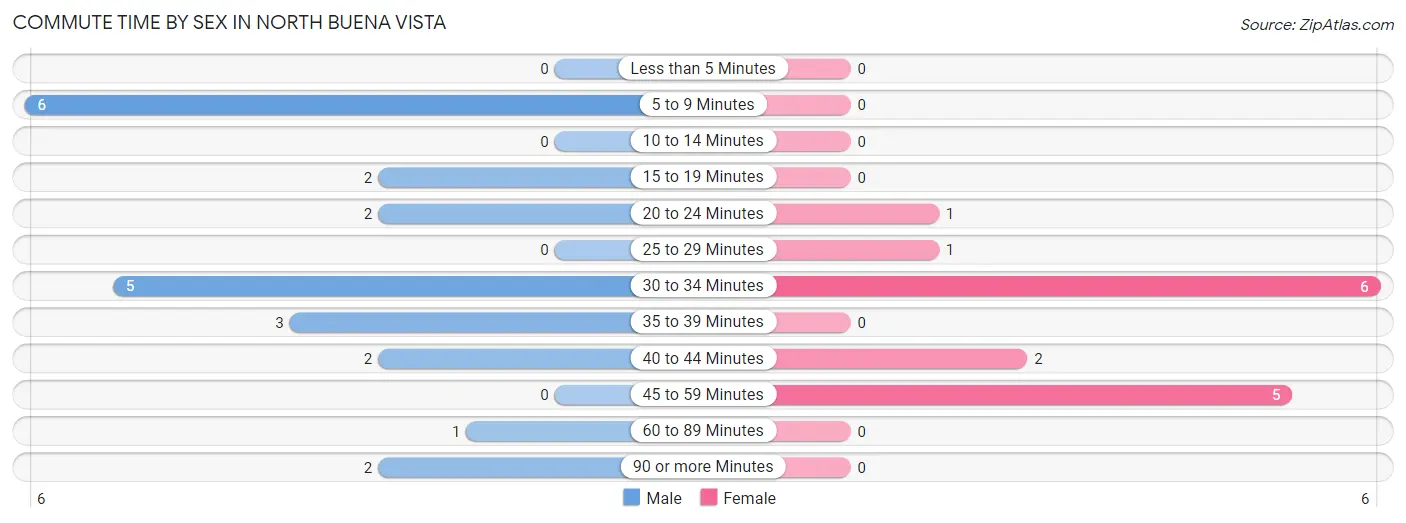
| Commute Time | Male | Female |
| Less than 5 Minutes | 0 (0.0%) | 0 (0.0%) |
| 5 to 9 Minutes | 6 (26.1%) | 0 (0.0%) |
| 10 to 14 Minutes | 0 (0.0%) | 0 (0.0%) |
| 15 to 19 Minutes | 2 (8.7%) | 0 (0.0%) |
| 20 to 24 Minutes | 2 (8.7%) | 1 (6.7%) |
| 25 to 29 Minutes | 0 (0.0%) | 1 (6.7%) |
| 30 to 34 Minutes | 5 (21.7%) | 6 (40.0%) |
| 35 to 39 Minutes | 3 (13.0%) | 0 (0.0%) |
| 40 to 44 Minutes | 2 (8.7%) | 2 (13.3%) |
| 45 to 59 Minutes | 0 (0.0%) | 5 (33.3%) |
| 60 to 89 Minutes | 1 (4.3%) | 0 (0.0%) |
| 90 or more Minutes | 2 (8.7%) | 0 (0.0%) |
Time of Departure to Work by Sex in North Buena Vista
The most frequent times of departure to work in North Buena Vista are 5:00 AM to 5:29 AM (6, 26.1%) for males and 5:00 AM to 5:29 AM (4, 26.7%) for females.
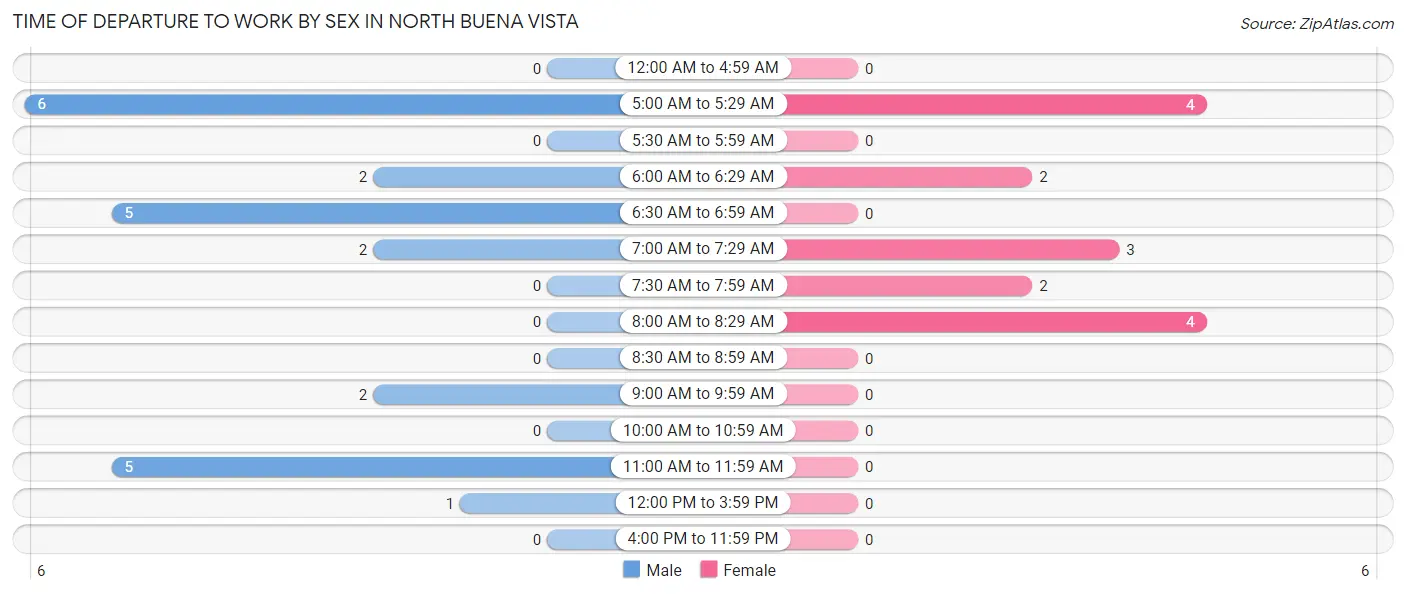
| Time of Departure | Male | Female |
| 12:00 AM to 4:59 AM | 0 (0.0%) | 0 (0.0%) |
| 5:00 AM to 5:29 AM | 6 (26.1%) | 4 (26.7%) |
| 5:30 AM to 5:59 AM | 0 (0.0%) | 0 (0.0%) |
| 6:00 AM to 6:29 AM | 2 (8.7%) | 2 (13.3%) |
| 6:30 AM to 6:59 AM | 5 (21.7%) | 0 (0.0%) |
| 7:00 AM to 7:29 AM | 2 (8.7%) | 3 (20.0%) |
| 7:30 AM to 7:59 AM | 0 (0.0%) | 2 (13.3%) |
| 8:00 AM to 8:29 AM | 0 (0.0%) | 4 (26.7%) |
| 8:30 AM to 8:59 AM | 0 (0.0%) | 0 (0.0%) |
| 9:00 AM to 9:59 AM | 2 (8.7%) | 0 (0.0%) |
| 10:00 AM to 10:59 AM | 0 (0.0%) | 0 (0.0%) |
| 11:00 AM to 11:59 AM | 5 (21.7%) | 0 (0.0%) |
| 12:00 PM to 3:59 PM | 1 (4.3%) | 0 (0.0%) |
| 4:00 PM to 11:59 PM | 0 (0.0%) | 0 (0.0%) |
| Total | 23 (100.0%) | 15 (100.0%) |
Housing Occupancy in North Buena Vista
Occupancy by Ownership in North Buena Vista
Of the total 51 dwellings in North Buena Vista, owner-occupied units account for 43 (84.3%), while renter-occupied units make up 8 (15.7%).
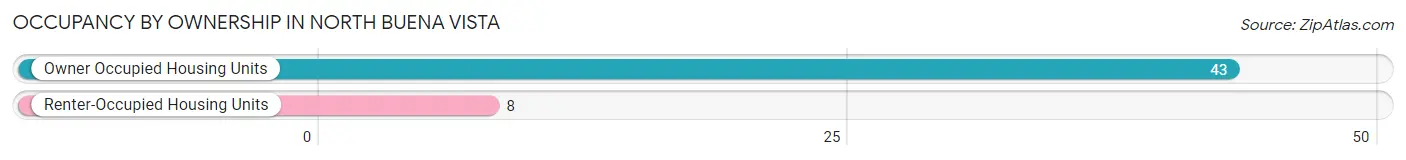
| Occupancy | # Housing Units | % Housing Units |
| Owner Occupied Housing Units | 43 | 84.3% |
| Renter-Occupied Housing Units | 8 | 15.7% |
| Total Occupied Housing Units | 51 | 100.0% |
Occupancy by Household Size in North Buena Vista
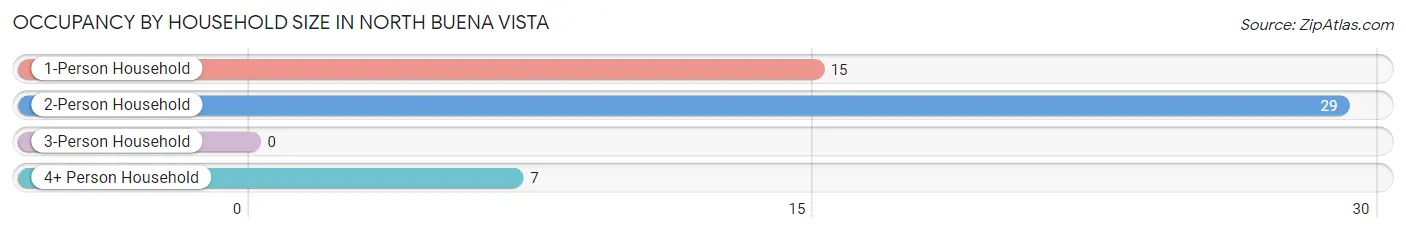
| Household Size | # Housing Units | % Housing Units |
| 1-Person Household | 15 | 29.4% |
| 2-Person Household | 29 | 56.9% |
| 3-Person Household | 0 | 0.0% |
| 4+ Person Household | 7 | 13.7% |
| Total Housing Units | 51 | 100.0% |
Occupancy by Ownership by Household Size in North Buena Vista
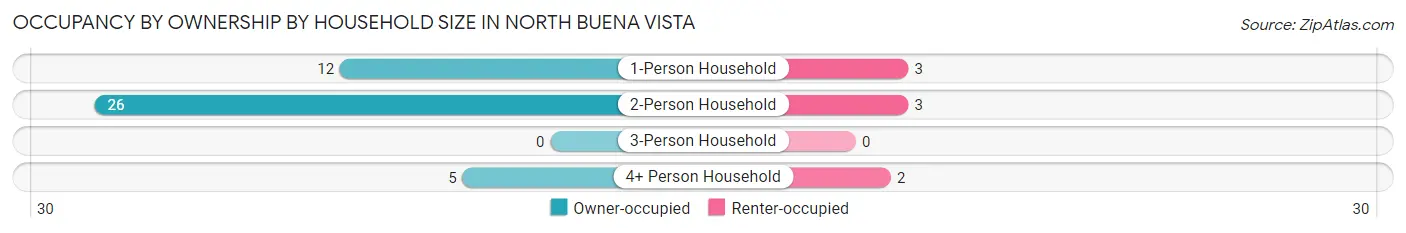
| Household Size | Owner-occupied | Renter-occupied |
| 1-Person Household | 12 (80.0%) | 3 (20.0%) |
| 2-Person Household | 26 (89.7%) | 3 (10.3%) |
| 3-Person Household | 0 (0.0%) | 0 (0.0%) |
| 4+ Person Household | 5 (71.4%) | 2 (28.6%) |
| Total Housing Units | 43 (84.3%) | 8 (15.7%) |
Occupancy by Educational Attainment in North Buena Vista
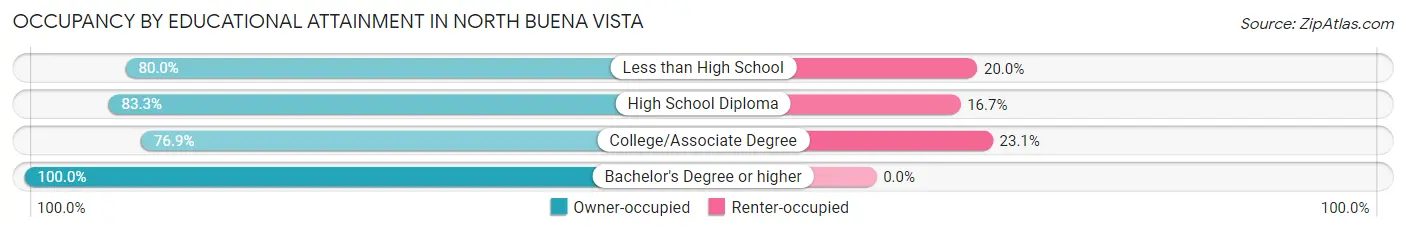
| Household Size | Owner-occupied | Renter-occupied |
| Less than High School | 4 (80.0%) | 1 (20.0%) |
| High School Diploma | 20 (83.3%) | 4 (16.7%) |
| College/Associate Degree | 10 (76.9%) | 3 (23.1%) |
| Bachelor's Degree or higher | 9 (100.0%) | 0 (0.0%) |
Occupancy by Age of Householder in North Buena Vista
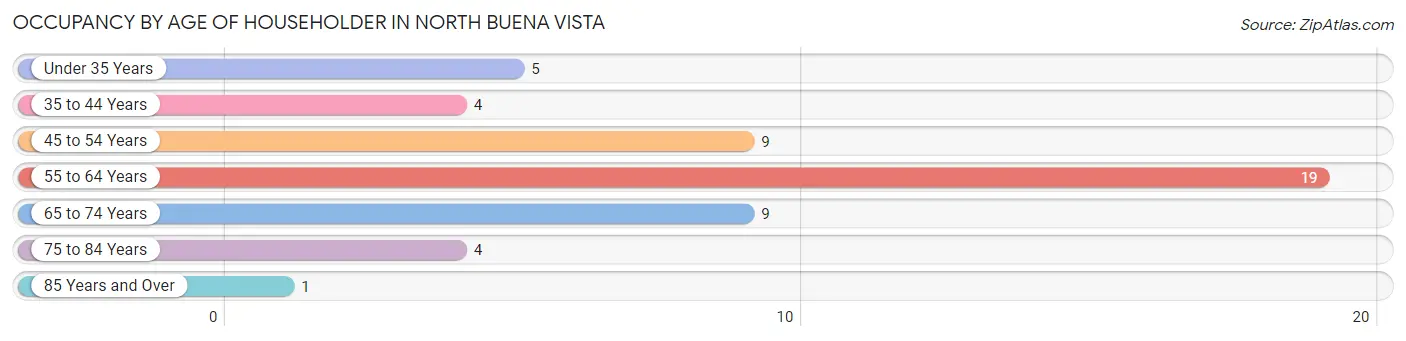
| Age Bracket | # Households | % Households |
| Under 35 Years | 5 | 9.8% |
| 35 to 44 Years | 4 | 7.8% |
| 45 to 54 Years | 9 | 17.6% |
| 55 to 64 Years | 19 | 37.2% |
| 65 to 74 Years | 9 | 17.6% |
| 75 to 84 Years | 4 | 7.8% |
| 85 Years and Over | 1 | 2.0% |
| Total | 51 | 100.0% |
Housing Finances in North Buena Vista
Median Income by Occupancy in North Buena Vista
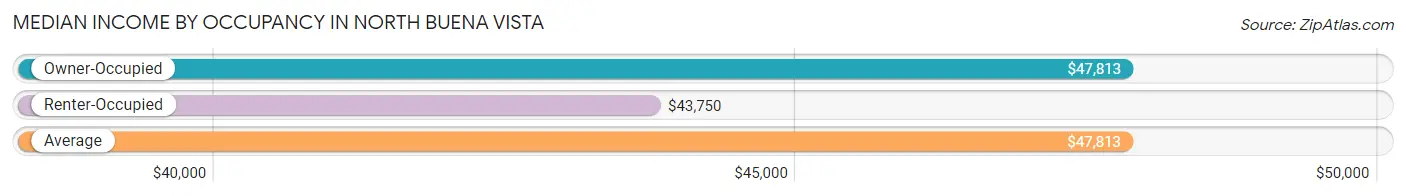
| Occupancy Type | # Households | Median Income |
| Owner-Occupied | 43 (84.3%) | $47,813 |
| Renter-Occupied | 8 (15.7%) | $43,750 |
| Average | 51 (100.0%) | $47,813 |
Occupancy by Householder Income Bracket in North Buena Vista
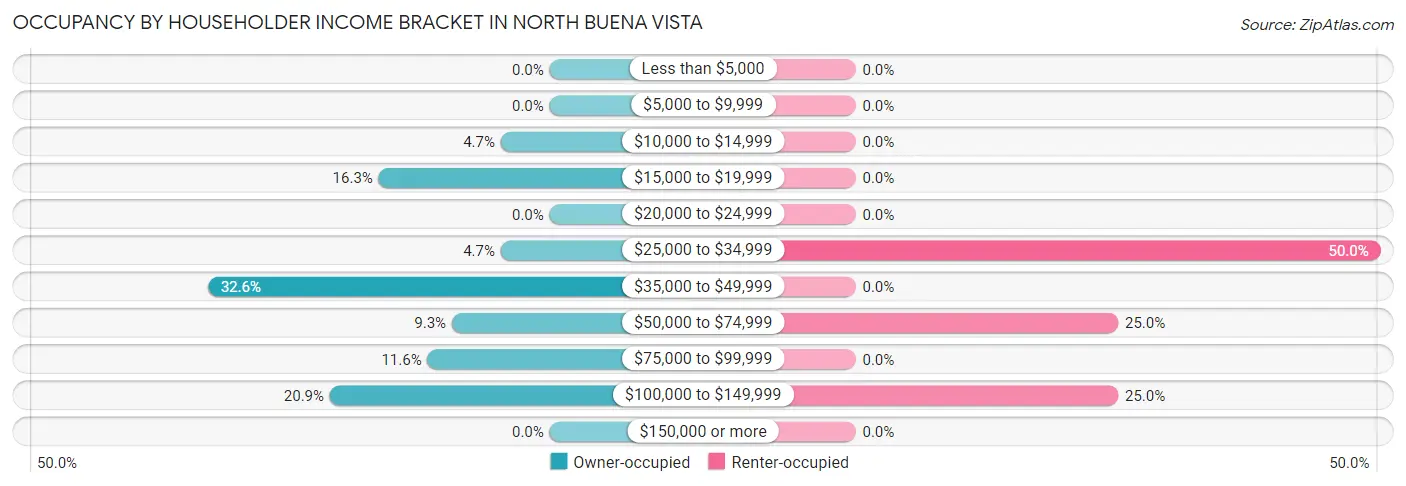
| Income Bracket | Owner-occupied | Renter-occupied |
| Less than $5,000 | 0 (0.0%) | 0 (0.0%) |
| $5,000 to $9,999 | 0 (0.0%) | 0 (0.0%) |
| $10,000 to $14,999 | 2 (4.6%) | 0 (0.0%) |
| $15,000 to $19,999 | 7 (16.3%) | 0 (0.0%) |
| $20,000 to $24,999 | 0 (0.0%) | 0 (0.0%) |
| $25,000 to $34,999 | 2 (4.6%) | 4 (50.0%) |
| $35,000 to $49,999 | 14 (32.6%) | 0 (0.0%) |
| $50,000 to $74,999 | 4 (9.3%) | 2 (25.0%) |
| $75,000 to $99,999 | 5 (11.6%) | 0 (0.0%) |
| $100,000 to $149,999 | 9 (20.9%) | 2 (25.0%) |
| $150,000 or more | 0 (0.0%) | 0 (0.0%) |
| Total | 43 (100.0%) | 8 (100.0%) |
Monthly Housing Cost Tiers in North Buena Vista
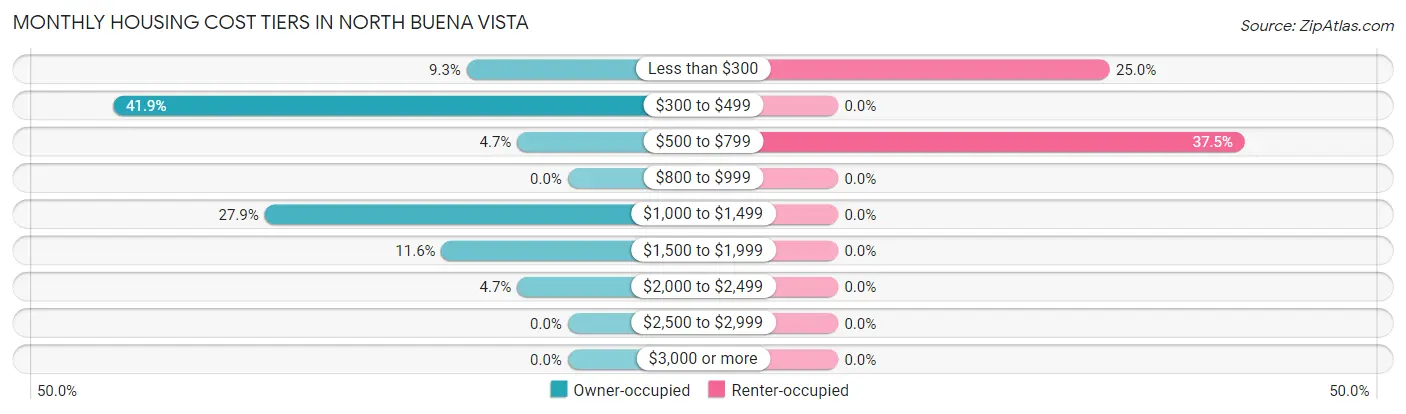
| Monthly Cost | Owner-occupied | Renter-occupied |
| Less than $300 | 4 (9.3%) | 2 (25.0%) |
| $300 to $499 | 18 (41.9%) | 0 (0.0%) |
| $500 to $799 | 2 (4.6%) | 3 (37.5%) |
| $800 to $999 | 0 (0.0%) | 0 (0.0%) |
| $1,000 to $1,499 | 12 (27.9%) | 0 (0.0%) |
| $1,500 to $1,999 | 5 (11.6%) | 0 (0.0%) |
| $2,000 to $2,499 | 2 (4.6%) | 0 (0.0%) |
| $2,500 to $2,999 | 0 (0.0%) | 0 (0.0%) |
| $3,000 or more | 0 (0.0%) | 0 (0.0%) |
| Total | 43 (100.0%) | 8 (100.0%) |
Physical Housing Characteristics in North Buena Vista
Housing Structures in North Buena Vista
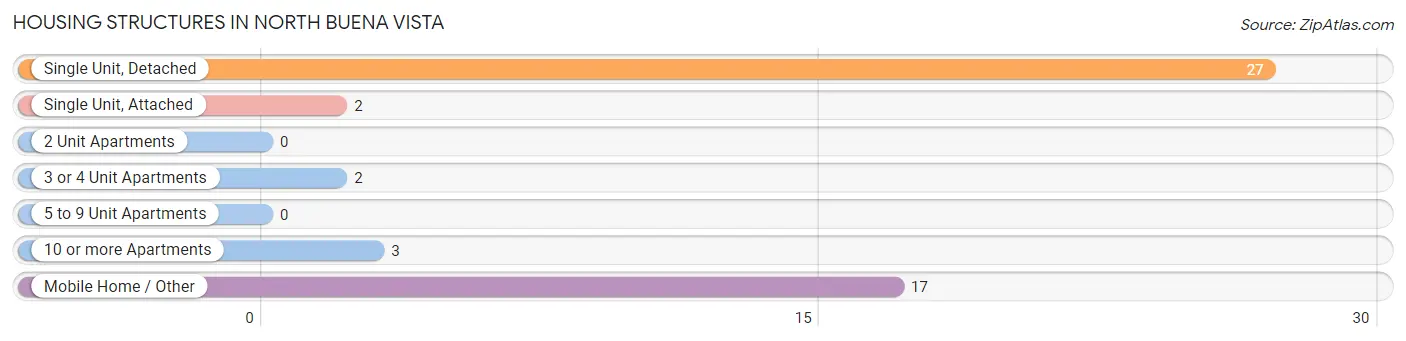
| Structure Type | # Housing Units | % Housing Units |
| Single Unit, Detached | 27 | 52.9% |
| Single Unit, Attached | 2 | 3.9% |
| 2 Unit Apartments | 0 | 0.0% |
| 3 or 4 Unit Apartments | 2 | 3.9% |
| 5 to 9 Unit Apartments | 0 | 0.0% |
| 10 or more Apartments | 3 | 5.9% |
| Mobile Home / Other | 17 | 33.3% |
| Total | 51 | 100.0% |
Housing Structures by Occupancy in North Buena Vista
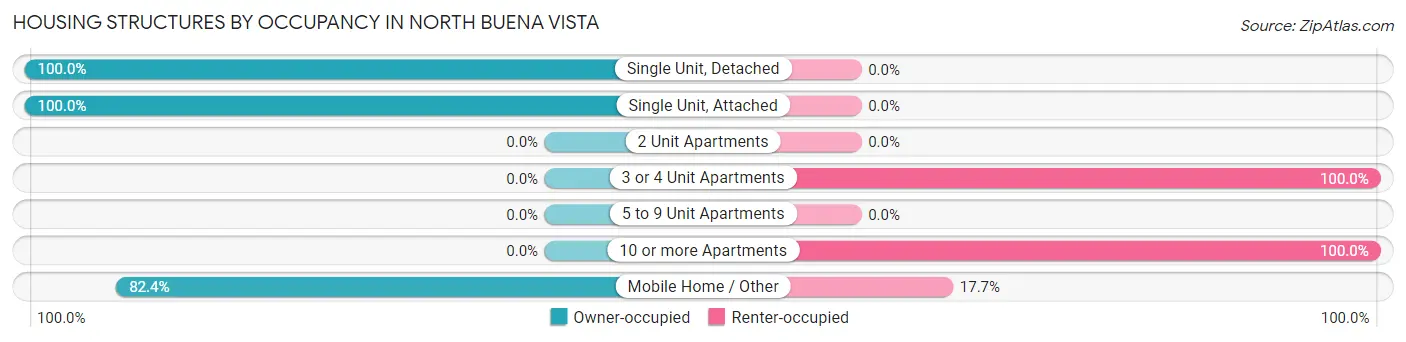
| Structure Type | Owner-occupied | Renter-occupied |
| Single Unit, Detached | 27 (100.0%) | 0 (0.0%) |
| Single Unit, Attached | 2 (100.0%) | 0 (0.0%) |
| 2 Unit Apartments | 0 (0.0%) | 0 (0.0%) |
| 3 or 4 Unit Apartments | 0 (0.0%) | 2 (100.0%) |
| 5 to 9 Unit Apartments | 0 (0.0%) | 0 (0.0%) |
| 10 or more Apartments | 0 (0.0%) | 3 (100.0%) |
| Mobile Home / Other | 14 (82.4%) | 3 (17.6%) |
| Total | 43 (84.3%) | 8 (15.7%) |
Housing Structures by Number of Rooms in North Buena Vista
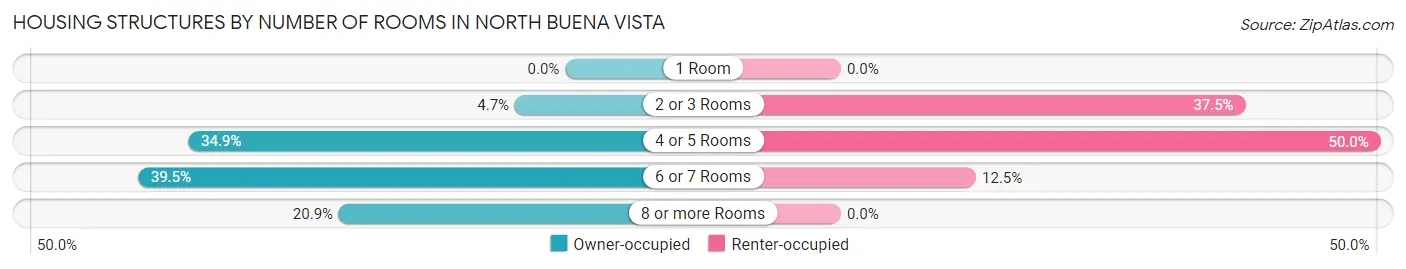
| Number of Rooms | Owner-occupied | Renter-occupied |
| 1 Room | 0 (0.0%) | 0 (0.0%) |
| 2 or 3 Rooms | 2 (4.6%) | 3 (37.5%) |
| 4 or 5 Rooms | 15 (34.9%) | 4 (50.0%) |
| 6 or 7 Rooms | 17 (39.5%) | 1 (12.5%) |
| 8 or more Rooms | 9 (20.9%) | 0 (0.0%) |
| Total | 43 (100.0%) | 8 (100.0%) |
Housing Structure by Heating Type in North Buena Vista
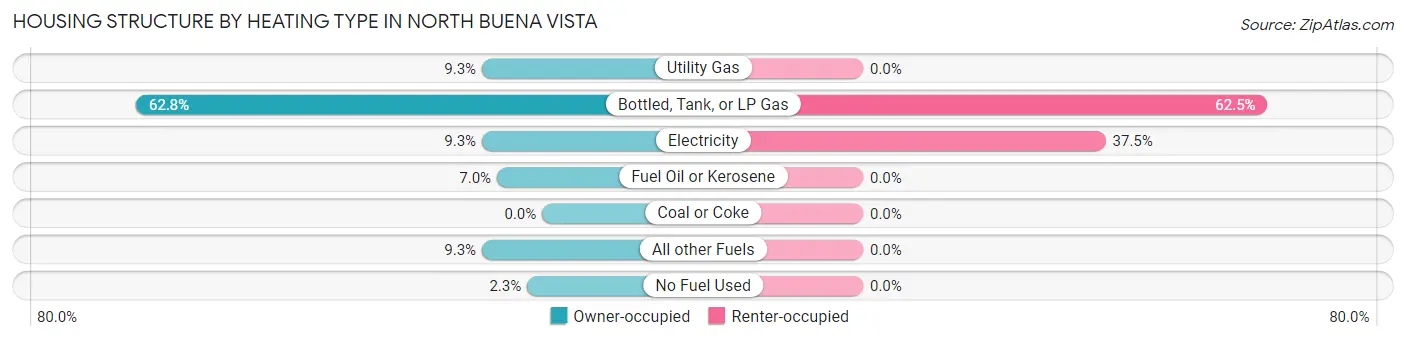
| Heating Type | Owner-occupied | Renter-occupied |
| Utility Gas | 4 (9.3%) | 0 (0.0%) |
| Bottled, Tank, or LP Gas | 27 (62.8%) | 5 (62.5%) |
| Electricity | 4 (9.3%) | 3 (37.5%) |
| Fuel Oil or Kerosene | 3 (7.0%) | 0 (0.0%) |
| Coal or Coke | 0 (0.0%) | 0 (0.0%) |
| All other Fuels | 4 (9.3%) | 0 (0.0%) |
| No Fuel Used | 1 (2.3%) | 0 (0.0%) |
| Total | 43 (100.0%) | 8 (100.0%) |
Household Vehicle Usage in North Buena Vista
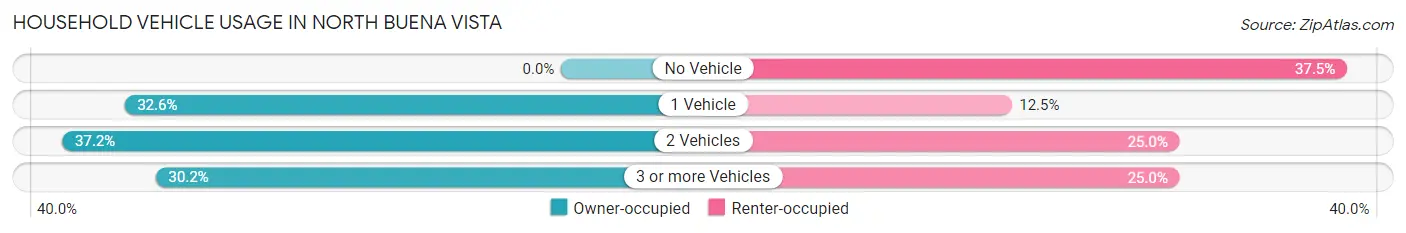
| Vehicles per Household | Owner-occupied | Renter-occupied |
| No Vehicle | 0 (0.0%) | 3 (37.5%) |
| 1 Vehicle | 14 (32.6%) | 1 (12.5%) |
| 2 Vehicles | 16 (37.2%) | 2 (25.0%) |
| 3 or more Vehicles | 13 (30.2%) | 2 (25.0%) |
| Total | 43 (100.0%) | 8 (100.0%) |
Real Estate & Mortgages in North Buena Vista
Real Estate and Mortgage Overview in North Buena Vista
| Characteristic | Without Mortgage | With Mortgage |
| Housing Units | 20 | 23 |
| Median Property Value | $95,000 | $77,500 |
| Median Household Income | $35,500 | $0 |
| Monthly Housing Costs | $338 | $0 |
| Real Estate Taxes | $850 | $0 |
Property Value by Mortgage Status in North Buena Vista
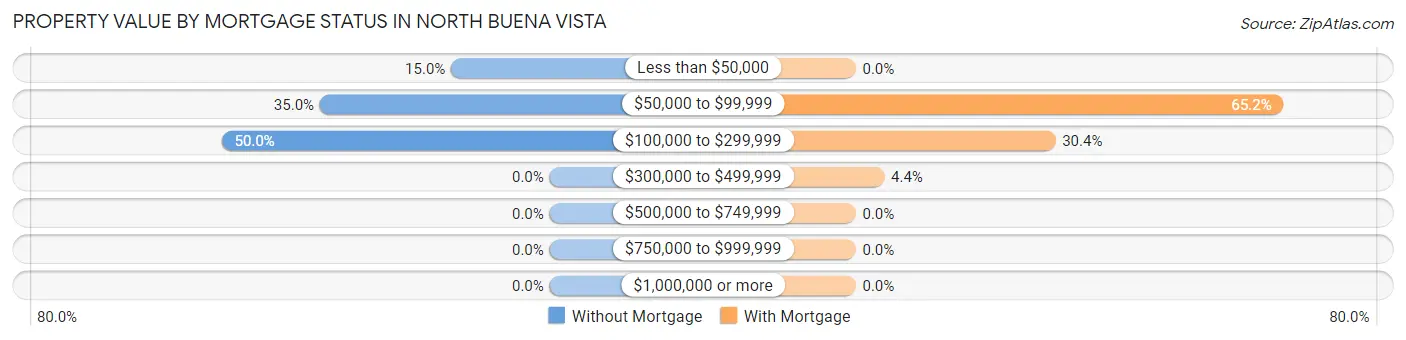
| Property Value | Without Mortgage | With Mortgage |
| Less than $50,000 | 3 (15.0%) | 0 (0.0%) |
| $50,000 to $99,999 | 7 (35.0%) | 15 (65.2%) |
| $100,000 to $299,999 | 10 (50.0%) | 7 (30.4%) |
| $300,000 to $499,999 | 0 (0.0%) | 1 (4.3%) |
| $500,000 to $749,999 | 0 (0.0%) | 0 (0.0%) |
| $750,000 to $999,999 | 0 (0.0%) | 0 (0.0%) |
| $1,000,000 or more | 0 (0.0%) | 0 (0.0%) |
| Total | 20 (100.0%) | 23 (100.0%) |
Household Income by Mortgage Status in North Buena Vista
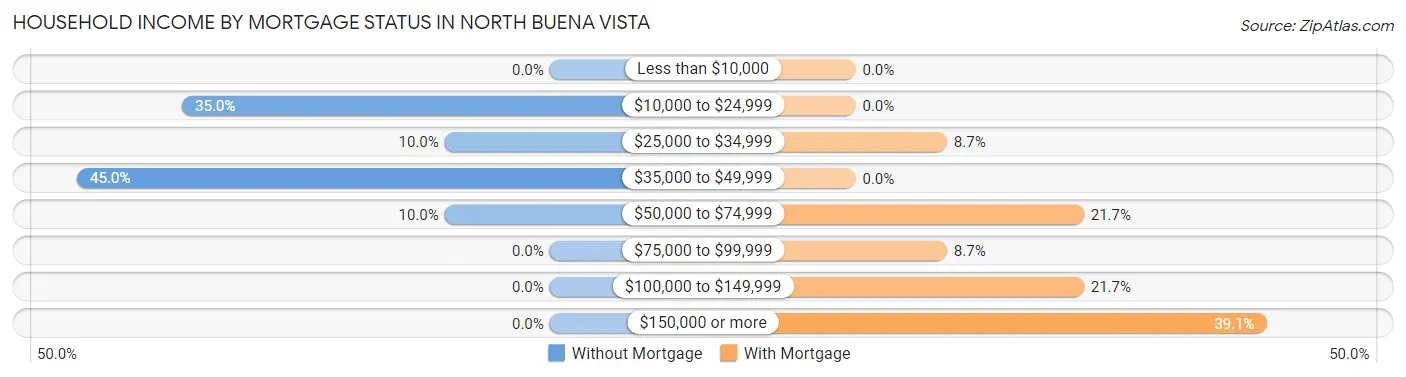
| Household Income | Without Mortgage | With Mortgage |
| Less than $10,000 | 0 (0.0%) | 0 (0.0%) |
| $10,000 to $24,999 | 7 (35.0%) | 0 (0.0%) |
| $25,000 to $34,999 | 2 (10.0%) | 2 (8.7%) |
| $35,000 to $49,999 | 9 (45.0%) | 0 (0.0%) |
| $50,000 to $74,999 | 2 (10.0%) | 5 (21.7%) |
| $75,000 to $99,999 | 0 (0.0%) | 2 (8.7%) |
| $100,000 to $149,999 | 0 (0.0%) | 5 (21.7%) |
| $150,000 or more | 0 (0.0%) | 9 (39.1%) |
| Total | 20 (100.0%) | 23 (100.0%) |
Property Value to Household Income Ratio in North Buena Vista
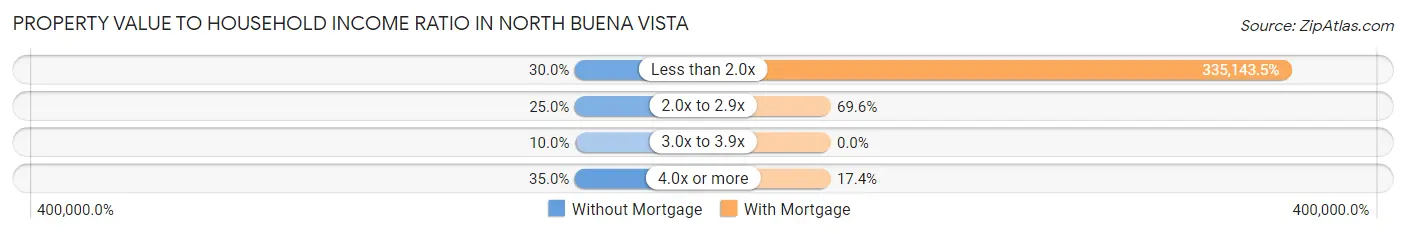
| Value-to-Income Ratio | Without Mortgage | With Mortgage |
| Less than 2.0x | 6 (30.0%) | 77,083 (335,143.5%) |
| 2.0x to 2.9x | 5 (25.0%) | 16 (69.6%) |
| 3.0x to 3.9x | 2 (10.0%) | 0 (0.0%) |
| 4.0x or more | 7 (35.0%) | 4 (17.4%) |
| Total | 20 (100.0%) | 23 (100.0%) |
Real Estate Taxes by Mortgage Status in North Buena Vista
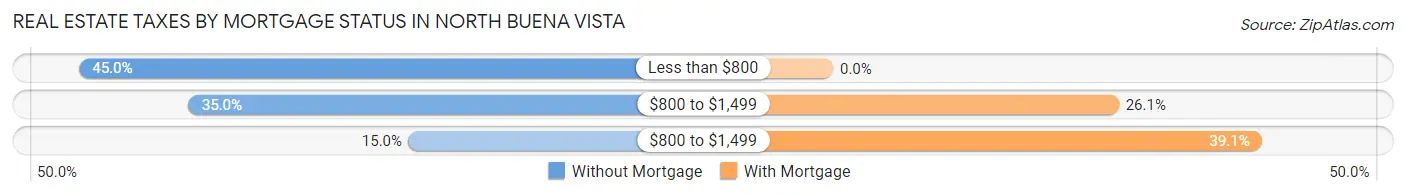
| Property Taxes | Without Mortgage | With Mortgage |
| Less than $800 | 9 (45.0%) | 0 (0.0%) |
| $800 to $1,499 | 7 (35.0%) | 6 (26.1%) |
| $800 to $1,499 | 3 (15.0%) | 9 (39.1%) |
| Total | 20 (100.0%) | 23 (100.0%) |
Health & Disability in North Buena Vista
Health Insurance Coverage by Age in North Buena Vista
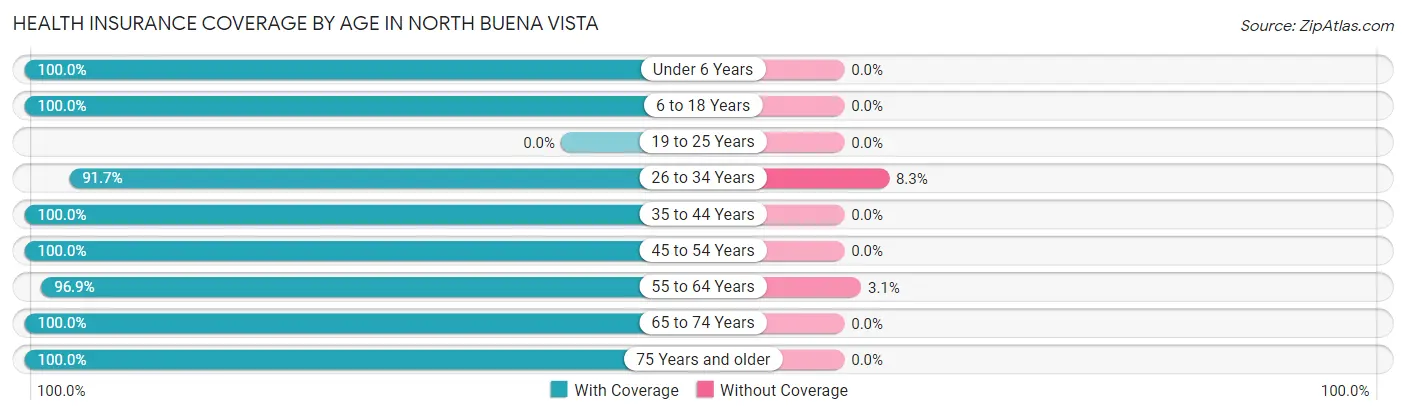
| Age Bracket | With Coverage | Without Coverage |
| Under 6 Years | 10 (100.0%) | 0 (0.0%) |
| 6 to 18 Years | 9 (100.0%) | 0 (0.0%) |
| 19 to 25 Years | 0 (0.0%) | 0 (0.0%) |
| 26 to 34 Years | 11 (91.7%) | 1 (8.3%) |
| 35 to 44 Years | 8 (100.0%) | 0 (0.0%) |
| 45 to 54 Years | 15 (100.0%) | 0 (0.0%) |
| 55 to 64 Years | 31 (96.9%) | 1 (3.1%) |
| 65 to 74 Years | 15 (100.0%) | 0 (0.0%) |
| 75 Years and older | 5 (100.0%) | 0 (0.0%) |
| Total | 104 (98.1%) | 2 (1.9%) |
Health Insurance Coverage by Citizenship Status in North Buena Vista
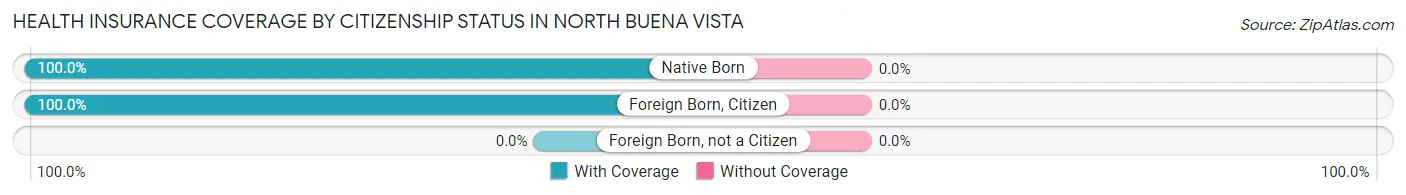
| Citizenship Status | With Coverage | Without Coverage |
| Native Born | 10 (100.0%) | 0 (0.0%) |
| Foreign Born, Citizen | 9 (100.0%) | 0 (0.0%) |
| Foreign Born, not a Citizen | 0 (0.0%) | 0 (0.0%) |
Health Insurance Coverage by Household Income in North Buena Vista
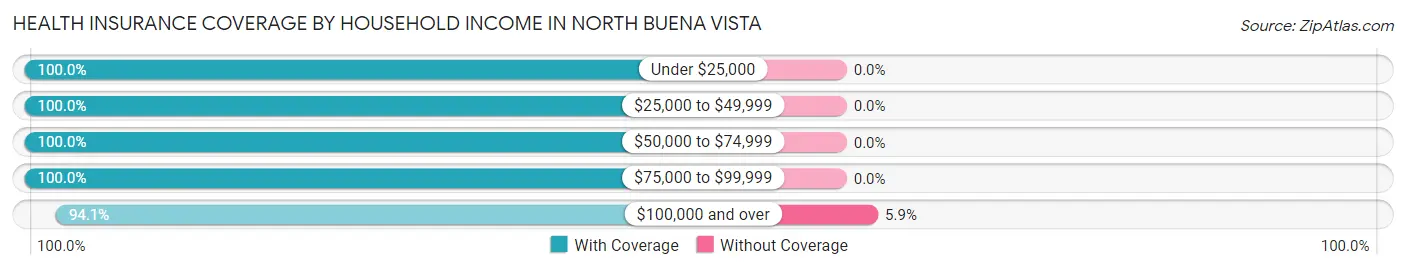
| Household Income | With Coverage | Without Coverage |
| Under $25,000 | 14 (100.0%) | 0 (0.0%) |
| $25,000 to $49,999 | 41 (100.0%) | 0 (0.0%) |
| $50,000 to $74,999 | 11 (100.0%) | 0 (0.0%) |
| $75,000 to $99,999 | 6 (100.0%) | 0 (0.0%) |
| $100,000 and over | 32 (94.1%) | 2 (5.9%) |
Public vs Private Health Insurance Coverage by Age in North Buena Vista
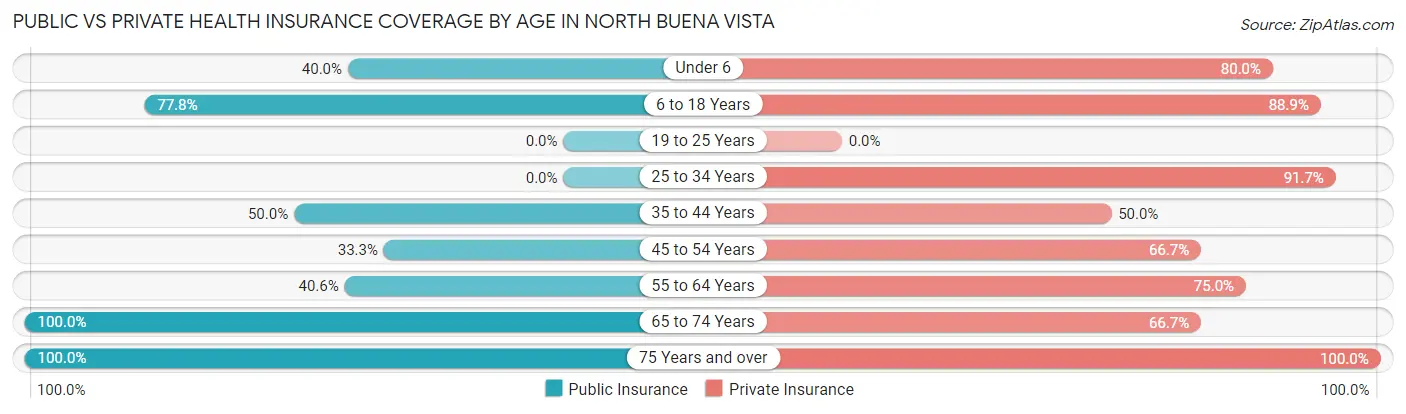
| Age Bracket | Public Insurance | Private Insurance |
| Under 6 | 4 (40.0%) | 8 (80.0%) |
| 6 to 18 Years | 7 (77.8%) | 8 (88.9%) |
| 19 to 25 Years | 0 (0.0%) | 0 (0.0%) |
| 25 to 34 Years | 0 (0.0%) | 11 (91.7%) |
| 35 to 44 Years | 4 (50.0%) | 4 (50.0%) |
| 45 to 54 Years | 5 (33.3%) | 10 (66.7%) |
| 55 to 64 Years | 13 (40.6%) | 24 (75.0%) |
| 65 to 74 Years | 15 (100.0%) | 10 (66.7%) |
| 75 Years and over | 5 (100.0%) | 5 (100.0%) |
| Total | 53 (50.0%) | 80 (75.5%) |
Disability Status by Sex by Age in North Buena Vista
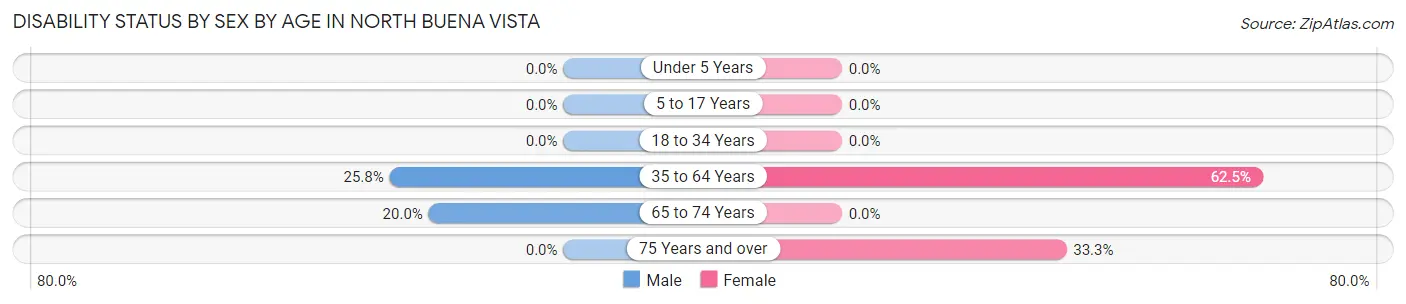
| Age Bracket | Male | Female |
| Under 5 Years | 0 (0.0%) | 0 (0.0%) |
| 5 to 17 Years | 0 (0.0%) | 0 (0.0%) |
| 18 to 34 Years | 0 (0.0%) | 0 (0.0%) |
| 35 to 64 Years | 8 (25.8%) | 15 (62.5%) |
| 65 to 74 Years | 1 (20.0%) | 0 (0.0%) |
| 75 Years and over | 0 (0.0%) | 1 (33.3%) |
Disability Class by Sex by Age in North Buena Vista
Disability Class: Hearing Difficulty
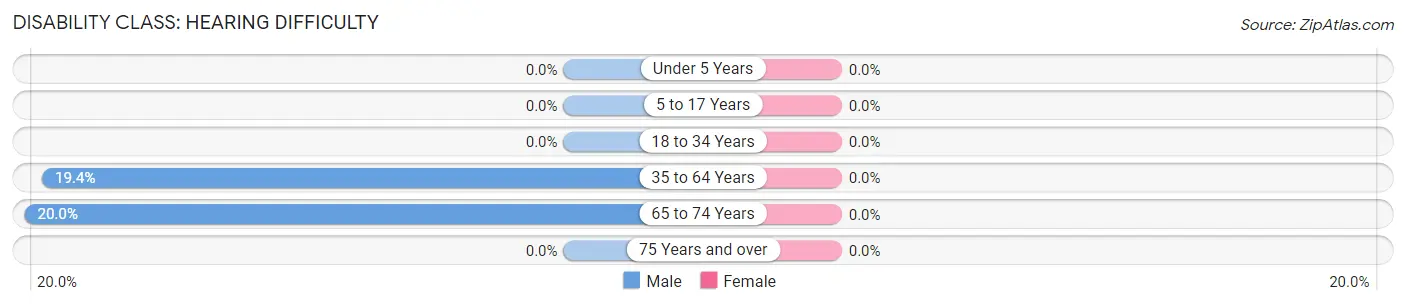
| Age Bracket | Male | Female |
| Under 5 Years | 0 (0.0%) | 0 (0.0%) |
| 5 to 17 Years | 0 (0.0%) | 0 (0.0%) |
| 18 to 34 Years | 0 (0.0%) | 0 (0.0%) |
| 35 to 64 Years | 6 (19.4%) | 0 (0.0%) |
| 65 to 74 Years | 1 (20.0%) | 0 (0.0%) |
| 75 Years and over | 0 (0.0%) | 0 (0.0%) |
Disability Class: Vision Difficulty
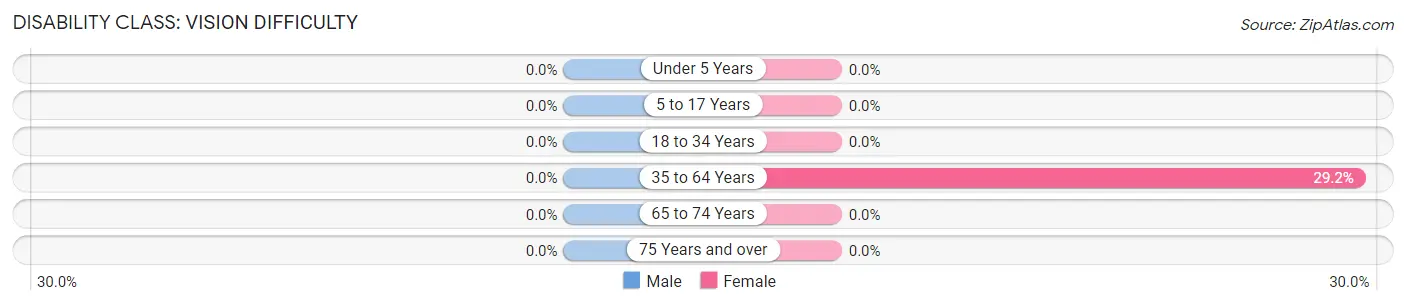
| Age Bracket | Male | Female |
| Under 5 Years | 0 (0.0%) | 0 (0.0%) |
| 5 to 17 Years | 0 (0.0%) | 0 (0.0%) |
| 18 to 34 Years | 0 (0.0%) | 0 (0.0%) |
| 35 to 64 Years | 0 (0.0%) | 7 (29.2%) |
| 65 to 74 Years | 0 (0.0%) | 0 (0.0%) |
| 75 Years and over | 0 (0.0%) | 0 (0.0%) |
Disability Class: Cognitive Difficulty
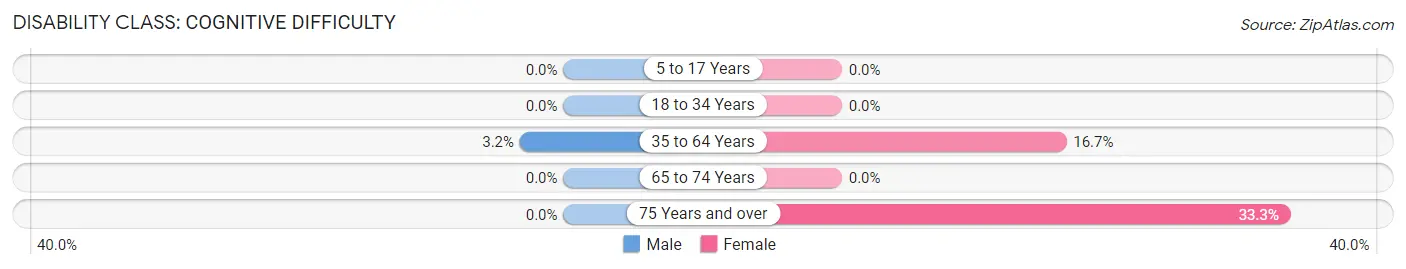
| Age Bracket | Male | Female |
| 5 to 17 Years | 0 (0.0%) | 0 (0.0%) |
| 18 to 34 Years | 0 (0.0%) | 0 (0.0%) |
| 35 to 64 Years | 1 (3.2%) | 4 (16.7%) |
| 65 to 74 Years | 0 (0.0%) | 0 (0.0%) |
| 75 Years and over | 0 (0.0%) | 1 (33.3%) |
Disability Class: Ambulatory Difficulty
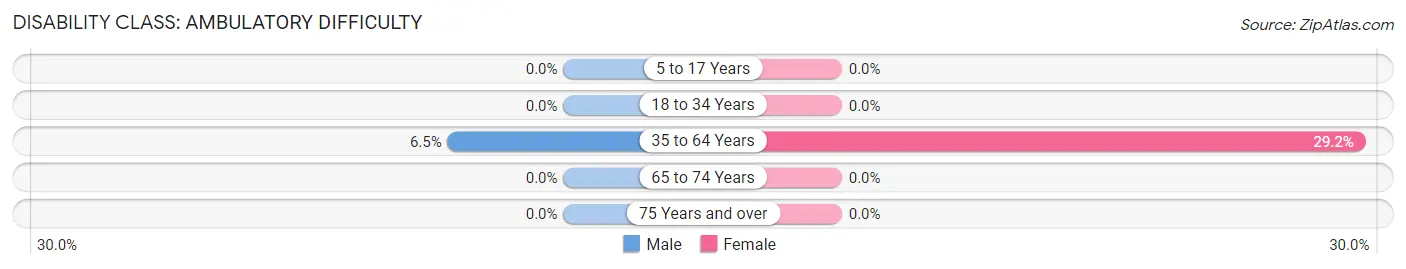
| Age Bracket | Male | Female |
| 5 to 17 Years | 0 (0.0%) | 0 (0.0%) |
| 18 to 34 Years | 0 (0.0%) | 0 (0.0%) |
| 35 to 64 Years | 2 (6.5%) | 7 (29.2%) |
| 65 to 74 Years | 0 (0.0%) | 0 (0.0%) |
| 75 Years and over | 0 (0.0%) | 0 (0.0%) |
Disability Class: Self-Care Difficulty
| Age Bracket | Male | Female |
| 5 to 17 Years | 0 (0.0%) | 0 (0.0%) |
| 18 to 34 Years | 0 (0.0%) | 0 (0.0%) |
| 35 to 64 Years | 0 (0.0%) | 0 (0.0%) |
| 65 to 74 Years | 0 (0.0%) | 0 (0.0%) |
| 75 Years and over | 0 (0.0%) | 0 (0.0%) |
Technology Access in North Buena Vista
Computing Device Access in North Buena Vista
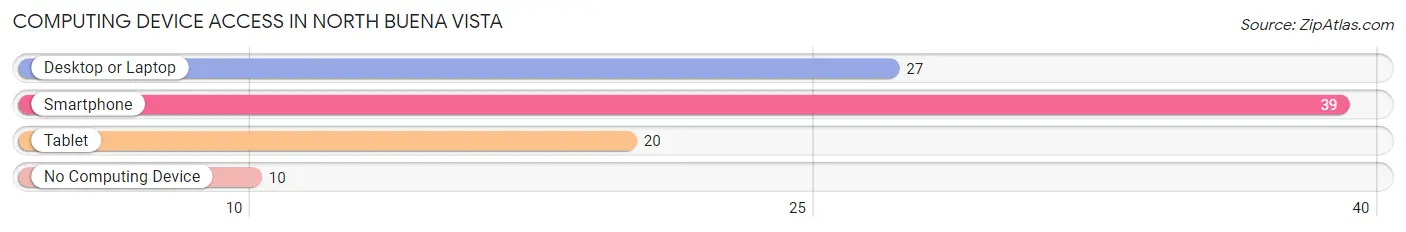
| Device Type | # Households | % Households |
| Desktop or Laptop | 27 | 52.9% |
| Smartphone | 39 | 76.5% |
| Tablet | 20 | 39.2% |
| No Computing Device | 10 | 19.6% |
| Total | 51 | 100.0% |
Internet Access in North Buena Vista
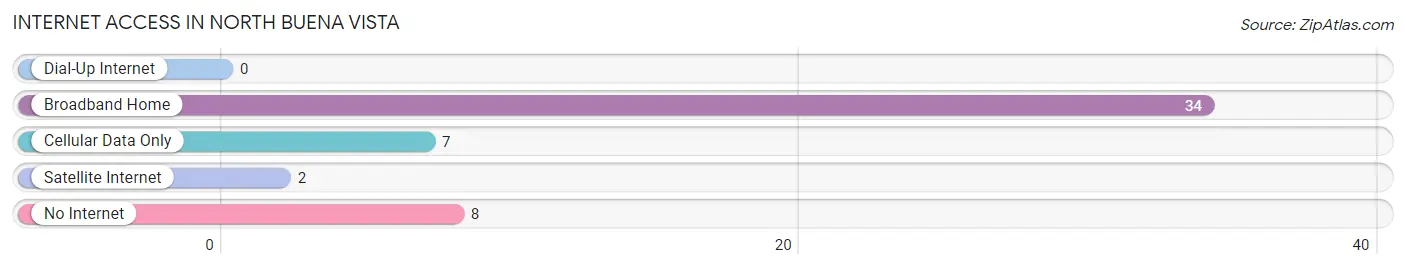
| Internet Type | # Households | % Households |
| Dial-Up Internet | 0 | 0.0% |
| Broadband Home | 34 | 66.7% |
| Cellular Data Only | 7 | 13.7% |
| Satellite Internet | 2 | 3.9% |
| No Internet | 8 | 15.7% |
| Total | 51 | 100.0% |
North Buena Vista Summary
Buena Vista is a small city located in the state of Iowa, United States. It is situated in the northwest corner of the state, in the county of Buena Vista. The city is located on the banks of the Des Moines River, and is part of the Storm Lake Metropolitan Statistical Area. The population of Buena Vista was estimated to be 2,845 in 2019.
History
The area that is now Buena Vista was first settled in 1856 by a group of settlers from Ohio. The town was originally known as “New Ohio”, but was later renamed Buena Vista in 1858. The name was chosen in honor of the Battle of Buena Vista, which was fought in Mexico during the Mexican-American War.
The city was officially incorporated in 1876, and the first mayor was elected in 1877. The city grew rapidly in the late 19th century, and by 1900, the population had grown to 1,845.
Geography
Buena Vista is located in the northwest corner of Iowa, in the county of Buena Vista. The city is situated on the banks of the Des Moines River, and is part of the Storm Lake Metropolitan Statistical Area. The city has a total area of 2.2 square miles, all of which is land.
The city is located in a region of rolling hills and prairies, and is surrounded by farmland. The climate in Buena Vista is humid continental, with hot summers and cold winters.
Economy
The economy of Buena Vista is largely based on agriculture and manufacturing. The city is home to several large agricultural companies, including Cargill, Tyson Foods, and Land O’Lakes. The city is also home to several manufacturing companies, including John Deere, Case IH, and Caterpillar.
The city is also home to several small businesses, including restaurants, retail stores, and service providers. The city is also home to a number of educational institutions, including Buena Vista University and Iowa Central Community College.
Demographics
As of the 2019 census, the population of Buena Vista was estimated to be 2,845. The racial makeup of the city was 94.2% White, 1.2% African American, 0.7% Native American, 0.7% Asian, 0.1% Pacific Islander, and 2.1% from other races. The median household income in Buena Vista was $45,945, and the median family income was $54,945. The per capita income in Buena Vista was $21,945.
Conclusion
Buena Vista is a small city located in the northwest corner of Iowa, in the county of Buena Vista. The city is situated on the banks of the Des Moines River, and is part of the Storm Lake Metropolitan Statistical Area. The city has a population of 2,845, and the economy is largely based on agriculture and manufacturing. The racial makeup of the city is 94.2% White, 1.2% African American, 0.7% Native American, 0.7% Asian, 0.1% Pacific Islander, and 2.1% from other races. The median household income in Buena Vista was $45,945, and the median family income was $54,945. The per capita income in Buena Vista was $21,945.
Common Questions
What is Per Capita Income in North Buena Vista?
Per Capita income in North Buena Vista is $27,424.
What is the Median Family Income in North Buena Vista?
Median Family Income in North Buena Vista is $49,375.
What is the Median Household income in North Buena Vista?
Median Household Income in North Buena Vista is $47,813.
What is Income or Wage Gap in North Buena Vista?
Income or Wage Gap in North Buena Vista is 2.7%.
Women in North Buena Vista earn 97.3 cents for every dollar earned by a man.
What is Inequality or Gini Index in North Buena Vista?
Inequality or Gini Index in North Buena Vista is 0.35.
What is the Total Population of North Buena Vista?
Total Population of North Buena Vista is 106.
What is the Total Male Population of North Buena Vista?
Total Male Population of North Buena Vista is 56.
What is the Total Female Population of North Buena Vista?
Total Female Population of North Buena Vista is 50.
What is the Ratio of Males per 100 Females in North Buena Vista?
There are 112.00 Males per 100 Females in North Buena Vista.
What is the Ratio of Females per 100 Males in North Buena Vista?
There are 89.29 Females per 100 Males in North Buena Vista.
What is the Median Population Age in North Buena Vista?
Median Population Age in North Buena Vista is 54.8 Years.
What is the Average Family Size in North Buena Vista
Average Family Size in North Buena Vista is 2.6 People.
What is the Average Household Size in North Buena Vista
Average Household Size in North Buena Vista is 2.1 People.
How Large is the Labor Force in North Buena Vista?
There are 44 People in the Labor Forcein in North Buena Vista.
What is the Percentage of People in the Labor Force in North Buena Vista?
48.4% of People are in the Labor Force in North Buena Vista.
What is the Unemployment Rate in North Buena Vista?
Unemployment Rate in North Buena Vista is 9.1%.