Laotian vs Alaskan Athabascan Male Disability
COMPARE
Laotian
Alaskan Athabascan
Male Disability
Male Disability Comparison
Laotians
Alaskan Athabascans
10.6%
MALE DISABILITY
98.6/ 100
METRIC RATING
77th/ 347
METRIC RANK
14.9%
MALE DISABILITY
0.0/ 100
METRIC RATING
336th/ 347
METRIC RANK
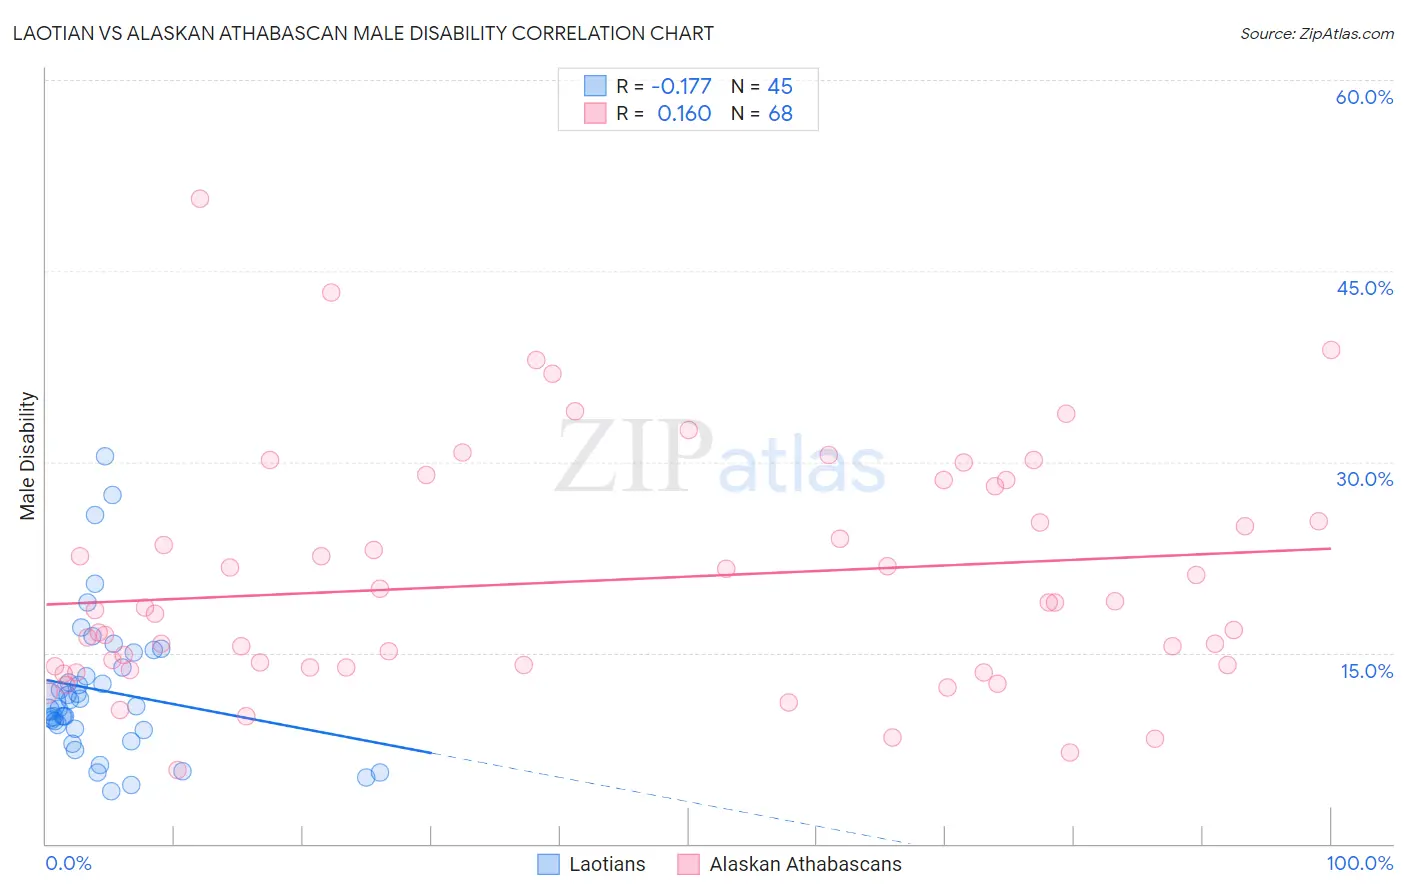
Laotian vs Alaskan Athabascan Male Disability Correlation Chart
The statistical analysis conducted on geographies consisting of 224,854,560 people shows a poor negative correlation between the proportion of Laotians and percentage of males with a disability in the United States with a correlation coefficient (R) of -0.177 and weighted average of 10.6%. Similarly, the statistical analysis conducted on geographies consisting of 45,820,726 people shows a poor positive correlation between the proportion of Alaskan Athabascans and percentage of males with a disability in the United States with a correlation coefficient (R) of 0.160 and weighted average of 14.9%, a difference of 41.3%.
Male Disability Correlation Summary
| Measurement | Laotian | Alaskan Athabascan |
| Minimum | 4.1% | 5.8% |
| Maximum | 30.4% | 50.7% |
| Range | 26.3% | 44.9% |
| Mean | 12.0% | 20.7% |
| Median | 10.8% | 18.5% |
| Interquartile 25% (IQ1) | 9.0% | 13.9% |
| Interquartile 75% (IQ3) | 14.4% | 26.7% |
| Interquartile Range (IQR) | 5.4% | 12.8% |
| Standard Deviation (Sample) | 5.7% | 9.2% |
| Standard Deviation (Population) | 5.6% | 9.1% |
Similar Demographics by Male Disability
Demographics Similar to Laotians by Male Disability
In terms of male disability, the demographic groups most similar to Laotians are Immigrants from Russia (10.6%, a difference of 0.020%), Immigrants from Sierra Leone (10.5%, a difference of 0.060%), Sierra Leonean (10.5%, a difference of 0.10%), Immigrants from Lebanon (10.5%, a difference of 0.21%), and Zimbabwean (10.6%, a difference of 0.25%).
| Demographics | Rating | Rank | Male Disability |
| Immigrants | Bulgaria | 99.1 /100 | #70 | Exceptional 10.5% |
| Immigrants | Cameroon | 99.0 /100 | #71 | Exceptional 10.5% |
| Immigrants | Serbia | 99.0 /100 | #72 | Exceptional 10.5% |
| Immigrants | Lithuania | 98.9 /100 | #73 | Exceptional 10.5% |
| Immigrants | Lebanon | 98.8 /100 | #74 | Exceptional 10.5% |
| Sierra Leoneans | 98.7 /100 | #75 | Exceptional 10.5% |
| Immigrants | Sierra Leone | 98.7 /100 | #76 | Exceptional 10.5% |
| Laotians | 98.6 /100 | #77 | Exceptional 10.6% |
| Immigrants | Russia | 98.6 /100 | #78 | Exceptional 10.6% |
| Zimbabweans | 98.4 /100 | #79 | Exceptional 10.6% |
| Immigrants | Jordan | 98.4 /100 | #80 | Exceptional 10.6% |
| Immigrants | Chile | 98.3 /100 | #81 | Exceptional 10.6% |
| Immigrants | Guyana | 98.2 /100 | #82 | Exceptional 10.6% |
| Immigrants | Poland | 98.1 /100 | #83 | Exceptional 10.6% |
| Bulgarians | 98.1 /100 | #84 | Exceptional 10.6% |
Demographics Similar to Alaskan Athabascans by Male Disability
In terms of male disability, the demographic groups most similar to Alaskan Athabascans are Dutch West Indian (14.8%, a difference of 0.46%), Cherokee (14.8%, a difference of 0.49%), Menominee (15.0%, a difference of 0.51%), Pueblo (15.0%, a difference of 0.62%), and Yuman (14.7%, a difference of 1.2%).
| Demographics | Rating | Rank | Male Disability |
| Cajuns | 0.0 /100 | #329 | Tragic 14.4% |
| Navajo | 0.0 /100 | #330 | Tragic 14.4% |
| Tohono O'odham | 0.0 /100 | #331 | Tragic 14.6% |
| Seminole | 0.0 /100 | #332 | Tragic 14.7% |
| Yuman | 0.0 /100 | #333 | Tragic 14.7% |
| Cherokee | 0.0 /100 | #334 | Tragic 14.8% |
| Dutch West Indians | 0.0 /100 | #335 | Tragic 14.8% |
| Alaskan Athabascans | 0.0 /100 | #336 | Tragic 14.9% |
| Menominee | 0.0 /100 | #337 | Tragic 15.0% |
| Pueblo | 0.0 /100 | #338 | Tragic 15.0% |
| Chickasaw | 0.0 /100 | #339 | Tragic 15.1% |
| Lumbee | 0.0 /100 | #340 | Tragic 15.2% |
| Choctaw | 0.0 /100 | #341 | Tragic 15.4% |
| Kiowa | 0.0 /100 | #342 | Tragic 15.4% |
| Creek | 0.0 /100 | #343 | Tragic 15.5% |