Costa Rican vs Immigrants from Bangladesh Male Disability

COMPARE

Costa Rican
Race
Ancestry
AfghanAfricanAlaska NativeAlaskan AthabascanAlbanianAleutAlsatianAmericanApacheArabArapahoArgentineanArmenianAssyrian/Chaldean/SyriacAustralianAustrianBahamianBangladeshiBarbadianBasqueBelgianBelizeanBermudanBhutaneseBlackfeetBolivianBrazilianBritishBritish West IndianBulgarianBurmeseCajunCambodianCanadianCape VerdeanCarpatho RusynCelticCentral AmericanCentral American IndianCherokeeCheyenneChickasawChileanChineseChippewaChoctawColombianColvilleComancheCosta RicanCreeCreekCroatianCrowCubanCypriotCzechCzechoslovakianDanishDelawareDominicanDutchDutch West IndianEastern EuropeanEcuadorianEgyptianEnglishEstonianEthiopianEuropeanFijianFilipinoFinnishFrenchFrench American IndianFrench CanadianGermanGerman RussianGhanaianGreekGuamanian/ChamorroGuatemalanGuyaneseHaitianHmongHonduranHopiHoumaHungarianIcelanderIndian (Asian)IndonesianInupiatIranianIraqiIrishIroquoisIsraeliItalianJamaicanJapaneseJordanianKenyanKiowaKoreanLaotianLatvianLebaneseLiberianLithuanianLumbeeLuxembourgerMacedonianMalaysianMalteseMarshalleseMenomineeMexicanMexican American IndianMongolianMoroccanNative HawaiianNavajoNepaleseNew ZealanderNicaraguanNigerianNorthern EuropeanNorwegianOkinawanOsageOttawaPaiutePakistaniPalestinianPanamanianParaguayanPennsylvania GermanPeruvianPimaPolishPortuguesePotawatomiPuebloPuerto RicanPuget Sound SalishRomanianRussianSalvadoranSamoanScandinavianScotch-IrishScottishSeminoleSenegaleseSerbianShoshoneSierra LeoneanSiouxSlavicSlovakSloveneSomaliSouth AfricanSouth AmericanSouth American IndianSoviet UnionSpaniardSpanishSpanish AmericanSpanish American IndianSri LankanSubsaharan AfricanSudaneseSwedishSwissSyrianTaiwaneseThaiTlingit-HaidaTohono O'OdhamTonganTrinidadian and TobagonianTsimshianTurkishU.S. Virgin IslanderUgandanUkrainianUruguayanUteVenezuelanVietnameseWelshWest IndianYakamaYaquiYugoslavianYumanYup'ikZimbabwean
Immigration
NonimmigrantsImmigrantsAfghanistanAfricaAlbaniaArgentinaArmeniaAsiaAustraliaAustriaBahamasBarbadosBelarusBelgiumBelizeBoliviaBosnia and HerzegovinaBrazilBulgariaBurma/MyanmarCabo VerdeCambodiaCameroonCanadaCaribbeanCentral AmericaChileChinaColombiaCongoCosta RicaCroatiaCubaCzechoslovakiaDenmarkDominicaDominican RepublicEastern AfricaEastern AsiaEastern EuropeEcuadorEgyptEl SalvadorEnglandEritreaEthiopiaEuropeFijiFranceGermanyGhanaGreeceGrenadaGuatemalaGuyanaHaitiHondurasHong KongHungaryIndiaIndonesiaIranIraqIrelandIsraelItalyJamaicaJapanJordanKazakhstanKenyaKoreaKuwaitLaosLatin AmericaLatviaLebanonLiberiaLithuaniaMalaysiaMexicoMicronesiaMiddle AfricaMoldovaMoroccoNepalNetherlandsNicaraguaNigeriaNorth AmericaNorth MacedoniaNorthern AfricaNorthern EuropeNorwayOceaniaPakistanPanamaPeruPhilippinesPolandPortugalRomaniaRussiaSaudi ArabiaScotlandSenegalSerbiaSierra LeoneSingaporeSomaliaSouth AfricaSouth AmericaSouth Central AsiaSouth Eastern AsiaSouthern EuropeSpainSri LankaSt. Vincent and the GrenadinesSudanSwedenSwitzerlandSyriaTaiwanThailandTrinidad and TobagoTurkeyUgandaUkraineUruguayUzbekistanVenezuelaVietnamWest IndiesWestern AfricaWestern AsiaWestern EuropeYemenZaireZimbabweAzores
Immigrants from Bangladesh
Race
Ancestry
AfghanAfricanAlaska NativeAlaskan AthabascanAlbanianAleutAlsatianAmericanApacheArabArapahoArgentineanArmenianAssyrian/Chaldean/SyriacAustralianAustrianBahamianBangladeshiBarbadianBasqueBelgianBelizeanBermudanBhutaneseBlackfeetBolivianBrazilianBritishBritish West IndianBulgarianBurmeseCajunCambodianCanadianCape VerdeanCarpatho RusynCelticCentral AmericanCentral American IndianCherokeeCheyenneChickasawChileanChineseChippewaChoctawColombianColvilleComancheCreeCreekCroatianCrowCubanCypriotCzechCzechoslovakianDanishDelawareDominicanDutchDutch West IndianEastern EuropeanEcuadorianEgyptianEnglishEstonianEthiopianEuropeanFijianFilipinoFinnishFrenchFrench American IndianFrench CanadianGermanGerman RussianGhanaianGreekGuamanian/ChamorroGuatemalanGuyaneseHaitianHmongHonduranHopiHoumaHungarianIcelanderIndian (Asian)IndonesianInupiatIranianIraqiIrishIroquoisIsraeliItalianJamaicanJapaneseJordanianKenyanKiowaKoreanLaotianLatvianLebaneseLiberianLithuanianLumbeeLuxembourgerMacedonianMalaysianMalteseMarshalleseMenomineeMexicanMexican American IndianMongolianMoroccanNative HawaiianNavajoNepaleseNew ZealanderNicaraguanNigerianNorthern EuropeanNorwegianOkinawanOsageOttawaPaiutePakistaniPalestinianPanamanianParaguayanPennsylvania GermanPeruvianPimaPolishPortuguesePotawatomiPuebloPuerto RicanPuget Sound SalishRomanianRussianSalvadoranSamoanScandinavianScotch-IrishScottishSeminoleSenegaleseSerbianShoshoneSierra LeoneanSiouxSlavicSlovakSloveneSomaliSouth AfricanSouth AmericanSouth American IndianSoviet UnionSpaniardSpanishSpanish AmericanSpanish American IndianSri LankanSubsaharan AfricanSudaneseSwedishSwissSyrianTaiwaneseThaiTlingit-HaidaTohono O'OdhamTonganTrinidadian and TobagonianTsimshianTurkishU.S. Virgin IslanderUgandanUkrainianUruguayanUteVenezuelanVietnameseWelshWest IndianYakamaYaquiYugoslavianYumanYup'ikZimbabwean
Immigration
NonimmigrantsImmigrantsAfghanistanAfricaAlbaniaArgentinaArmeniaAsiaAustraliaAustriaBahamasBangladeshBarbadosBelarusBelgiumBelizeBoliviaBosnia and HerzegovinaBrazilBulgariaBurma/MyanmarCabo VerdeCambodiaCameroonCanadaCaribbeanCentral AmericaChileChinaColombiaCongoCosta RicaCroatiaCubaCzechoslovakiaDenmarkDominicaDominican RepublicEastern AfricaEastern AsiaEastern EuropeEcuadorEgyptEl SalvadorEnglandEritreaEthiopiaEuropeFijiFranceGermanyGhanaGreeceGrenadaGuatemalaGuyanaHaitiHondurasHong KongHungaryIndiaIndonesiaIranIraqIrelandIsraelItalyJamaicaJapanJordanKazakhstanKenyaKoreaKuwaitLaosLatin AmericaLatviaLebanonLiberiaLithuaniaMalaysiaMexicoMicronesiaMiddle AfricaMoldovaMoroccoNepalNetherlandsNicaraguaNigeriaNorth AmericaNorth MacedoniaNorthern AfricaNorthern EuropeNorwayOceaniaPakistanPanamaPeruPhilippinesPolandPortugalRomaniaRussiaSaudi ArabiaScotlandSenegalSerbiaSierra LeoneSingaporeSomaliaSouth AfricaSouth AmericaSouth Central AsiaSouth Eastern AsiaSouthern EuropeSpainSri LankaSt. Vincent and the GrenadinesSudanSwedenSwitzerlandSyriaTaiwanThailandTrinidad and TobagoTurkeyUgandaUkraineUruguayUzbekistanVenezuelaVietnamWest IndiesWestern AfricaWestern AsiaWestern EuropeYemenZaireZimbabweAzores
Male Disability
Income
Poverty
Unemployment
Labor Participation
Family Structure
Vehicle Availability
Education Level
Disability

Male Disability Comparison

Costa Ricans

Immigrants from Bangladesh

Good
Exceptional
11.0%
MALE DISABILITY
78.0/ 100
METRIC RATING
145th/ 347
METRIC RANK
10.3%
MALE DISABILITY
99.7/ 100
METRIC RATING
43rd/ 347
METRIC RANK

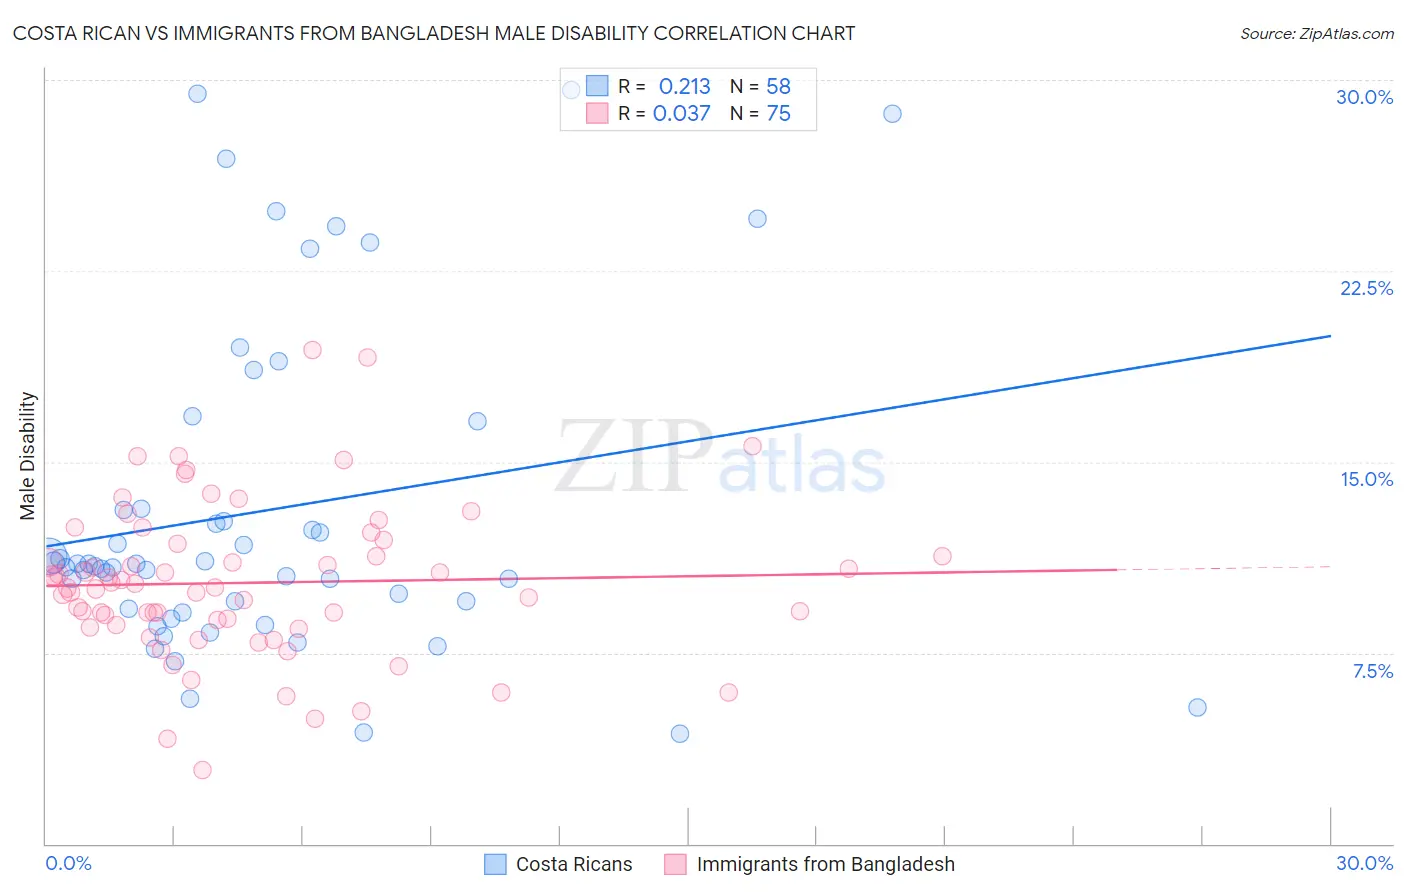
Costa Rican vs Immigrants from Bangladesh Male Disability Correlation Chart

The statistical analysis conducted on geographies consisting of 253,572,614 people shows a weak positive correlation between the proportion of Costa Ricans and percentage of males with a disability in the United States with a correlation coefficient (R) of 0.213 and weighted average of 11.0%. Similarly, the statistical analysis conducted on geographies consisting of 203,673,842 people shows no correlation between the proportion of Immigrants from Bangladesh and percentage of males with a disability in the United States with a correlation coefficient (R) of 0.037 and weighted average of 10.3%, a difference of 7.0%.
Costa Rican vs Immigrants from Bangladesh Male Disability

Male Disability Correlation Summary

MeasurementCosta RicanImmigrants from Bangladesh
Minimum4.3%2.9%
Maximum29.6%19.4%
Range25.3%16.5%
Mean13.1%10.3%
Median11.0%10.1%
Interquartile 25% (IQ1)9.2%8.6%
Interquartile 75% (IQ3)13.1%11.8%
Interquartile Range (IQR)3.9%3.2%
Standard Deviation (Sample)6.5%3.0%
Standard Deviation (Population)6.4%3.0%

Similar Demographics by Male Disability

Demographics Similar to Costa Ricans by Male Disability

In terms of male disability, the demographic groups most similar to Costa Ricans are Kenyan (11.0%, a difference of 0.010%), Korean (11.0%, a difference of 0.040%), Immigrants from Croatia (11.0%, a difference of 0.060%), Sudanese (11.0%, a difference of 0.070%), and Immigrants from Denmark (11.0%, a difference of 0.13%).
DemographicsRating | RankMale Disability
Nigerians
81.9
/100
|
#138
Excellent
11.0%
South Africans
81.7
/100
|
#139
Excellent
11.0%
Immigrants | Italy
81.5
/100
|
#140
Excellent
11.0%
Arabs
81.5
/100
|
#141
Excellent
11.0%
Immigrants | Sudan
81.5
/100
|
#142
Excellent
11.0%
Moroccans
80.7
/100
|
#143
Excellent
11.0%
Kenyans
78.1
/100
|
#144
Good
11.0%
Costa Ricans
78.0
/100
|
#145
Good
11.0%
Koreans
77.5
/100
|
#146
Good
11.0%
Immigrants | Croatia
77.3
/100
|
#147
Good
11.0%
Sudanese
77.1
/100
|
#148
Good
11.0%
Immigrants | Denmark
76.4
/100
|
#149
Good
11.0%
Immigrants | Guatemala
75.1
/100
|
#150
Good
11.0%
Cubans
74.9
/100
|
#151
Good
11.0%
Immigrants | Albania
74.4
/100
|
#152
Good
11.0%

Demographics Similar to Immigrants from Bangladesh by Male Disability

In terms of male disability, the demographic groups most similar to Immigrants from Bangladesh are Mongolian (10.3%, a difference of 0.020%), Immigrants from El Salvador (10.3%, a difference of 0.070%), Turkish (10.3%, a difference of 0.080%), Cambodian (10.3%, a difference of 0.16%), and Immigrants from Peru (10.3%, a difference of 0.19%).
DemographicsRating | RankMale Disability
Ethiopians
99.8
/100
|
#36
Exceptional
10.2%
Immigrants | Indonesia
99.8
/100
|
#37
Exceptional
10.2%
Immigrants | Kuwait
99.8
/100
|
#38
Exceptional
10.2%
Afghans
99.8
/100
|
#39
Exceptional
10.2%
Immigrants | Nepal
99.8
/100
|
#40
Exceptional
10.3%
Taiwanese
99.8
/100
|
#41
Exceptional
10.3%
Mongolians
99.7
/100
|
#42
Exceptional
10.3%
Immigrants | Bangladesh
99.7
/100
|
#43
Exceptional
10.3%
Immigrants | El Salvador
99.7
/100
|
#44
Exceptional
10.3%
Turks
99.7
/100
|
#45
Exceptional
10.3%
Cambodians
99.7
/100
|
#46
Exceptional
10.3%
Immigrants | Peru
99.7
/100
|
#47
Exceptional
10.3%
Israelis
99.7
/100
|
#48
Exceptional
10.3%
Immigrants | Spain
99.7
/100
|
#49
Exceptional
10.3%
South Americans
99.6
/100
|
#50
Exceptional
10.3%