Zip Codes with the Highest Percentage of Population Employed in Arts, Media & Entertainment in San Jose, CA
RELATED REPORTS & OPTIONS
Arts, Media & Entertainment
San Jose
Compare Zip Codes
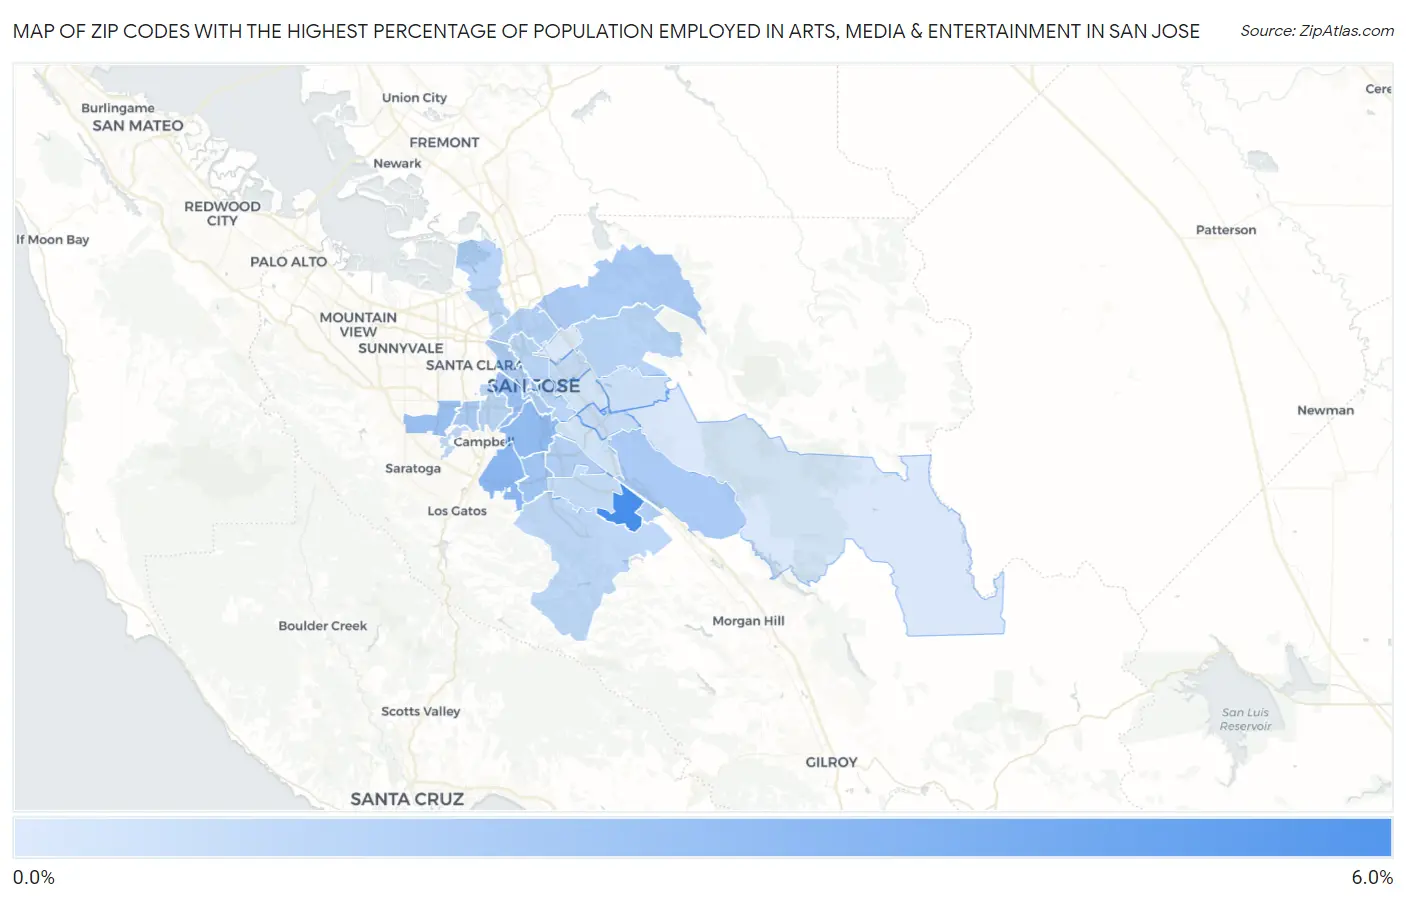
Map of Zip Codes with the Highest Percentage of Population Employed in Arts, Media & Entertainment in San Jose
0.82%
5.2%
Zip Codes with the Highest Percentage of Population Employed in Arts, Media & Entertainment in San Jose, CA
| Zip Code | % Employed | vs State | vs National | |
| 1. | 95119 | 5.2% | 3.0%(+2.26)#229 | 2.1%(+3.16)#1,387 |
| 2. | 95124 | 3.1% | 3.0%(+0.182)#457 | 2.1%(+1.09)#3,737 |
| 3. | 95125 | 3.0% | 3.0%(+0.029)#489 | 2.1%(+0.934)#4,090 |
| 4. | 95113 | 2.9% | 3.0%(-0.104)#513 | 2.1%(+0.800)#4,447 |
| 5. | 95129 | 2.8% | 3.0%(-0.178)#532 | 2.1%(+0.727)#4,652 |
| 6. | 95126 | 2.8% | 3.0%(-0.201)#539 | 2.1%(+0.703)#4,717 |
| 7. | 95118 | 2.5% | 3.0%(-0.452)#599 | 2.1%(+0.452)#5,512 |
| 8. | 95138 | 2.3% | 3.0%(-0.686)#661 | 2.1%(+0.218)#6,462 |
| 9. | 95132 | 2.3% | 3.0%(-0.713)#668 | 2.1%(+0.192)#6,594 |
| 10. | 95117 | 2.2% | 3.0%(-0.725)#670 | 2.1%(+0.179)#6,647 |
| 11. | 95110 | 2.2% | 3.0%(-0.780)#691 | 2.1%(+0.124)#6,897 |
| 12. | 95139 | 2.0% | 3.0%(-0.948)#758 | 2.1%(-0.043)#7,718 |
| 13. | 95131 | 2.0% | 3.0%(-1.01)#775 | 2.1%(-0.107)#8,063 |
| 14. | 95136 | 2.0% | 3.0%(-1.01)#776 | 2.1%(-0.109)#8,075 |
| 15. | 95134 | 1.8% | 3.0%(-1.13)#814 | 2.1%(-0.229)#8,781 |
| 16. | 95128 | 1.8% | 3.0%(-1.14)#815 | 2.1%(-0.232)#8,800 |
| 17. | 95127 | 1.8% | 3.0%(-1.15)#819 | 2.1%(-0.241)#8,861 |
| 18. | 95112 | 1.8% | 3.0%(-1.17)#833 | 2.1%(-0.270)#9,027 |
| 19. | 95120 | 1.7% | 3.0%(-1.26)#864 | 2.1%(-0.359)#9,609 |
| 20. | 95130 | 1.6% | 3.0%(-1.33)#894 | 2.1%(-0.421)#10,067 |
| 21. | 95123 | 1.5% | 3.0%(-1.50)#966 | 2.1%(-0.593)#11,203 |
| 22. | 95116 | 1.4% | 3.0%(-1.56)#1,000 | 2.1%(-0.660)#11,711 |
| 23. | 95121 | 1.4% | 3.0%(-1.59)#1,010 | 2.1%(-0.684)#11,873 |
| 24. | 95148 | 1.3% | 3.0%(-1.71)#1,054 | 2.1%(-0.810)#12,843 |
| 25. | 95111 | 1.1% | 3.0%(-1.91)#1,118 | 2.1%(-1.00)#14,328 |
| 26. | 95122 | 1.0% | 3.0%(-1.94)#1,128 | 2.1%(-1.03)#14,583 |
| 27. | 95135 | 0.89% | 3.0%(-2.08)#1,178 | 2.1%(-1.17)#15,753 |
| 28. | 95133 | 0.82% | 3.0%(-2.15)#1,206 | 2.1%(-1.24)#16,258 |
1
Common Questions
What are the Top 10 Zip Codes with the Highest Percentage of Population Employed in Arts, Media & Entertainment in San Jose, CA?
Top 10 Zip Codes with the Highest Percentage of Population Employed in Arts, Media & Entertainment in San Jose, CA are:
What zip code has the Highest Percentage of Population Employed in Arts, Media & Entertainment in San Jose, CA?
95119 has the Highest Percentage of Population Employed in Arts, Media & Entertainment in San Jose, CA with 5.2%.
What is the Percentage of Population Employed in Arts, Media & Entertainment in San Jose, CA?
Percentage of Population Employed in Arts, Media & Entertainment in San Jose is 1.9%.
What is the Percentage of Population Employed in Arts, Media & Entertainment in California?
Percentage of Population Employed in Arts, Media & Entertainment in California is 3.0%.
What is the Percentage of Population Employed in Arts, Media & Entertainment in the United States?
Percentage of Population Employed in Arts, Media & Entertainment in the United States is 2.1%.