Zip Codes with the Highest Percentage of Population Employed in Firefighting & Prevention in San Jose, CA
RELATED REPORTS & OPTIONS
Firefighting & Prevention
San Jose
Compare Zip Codes
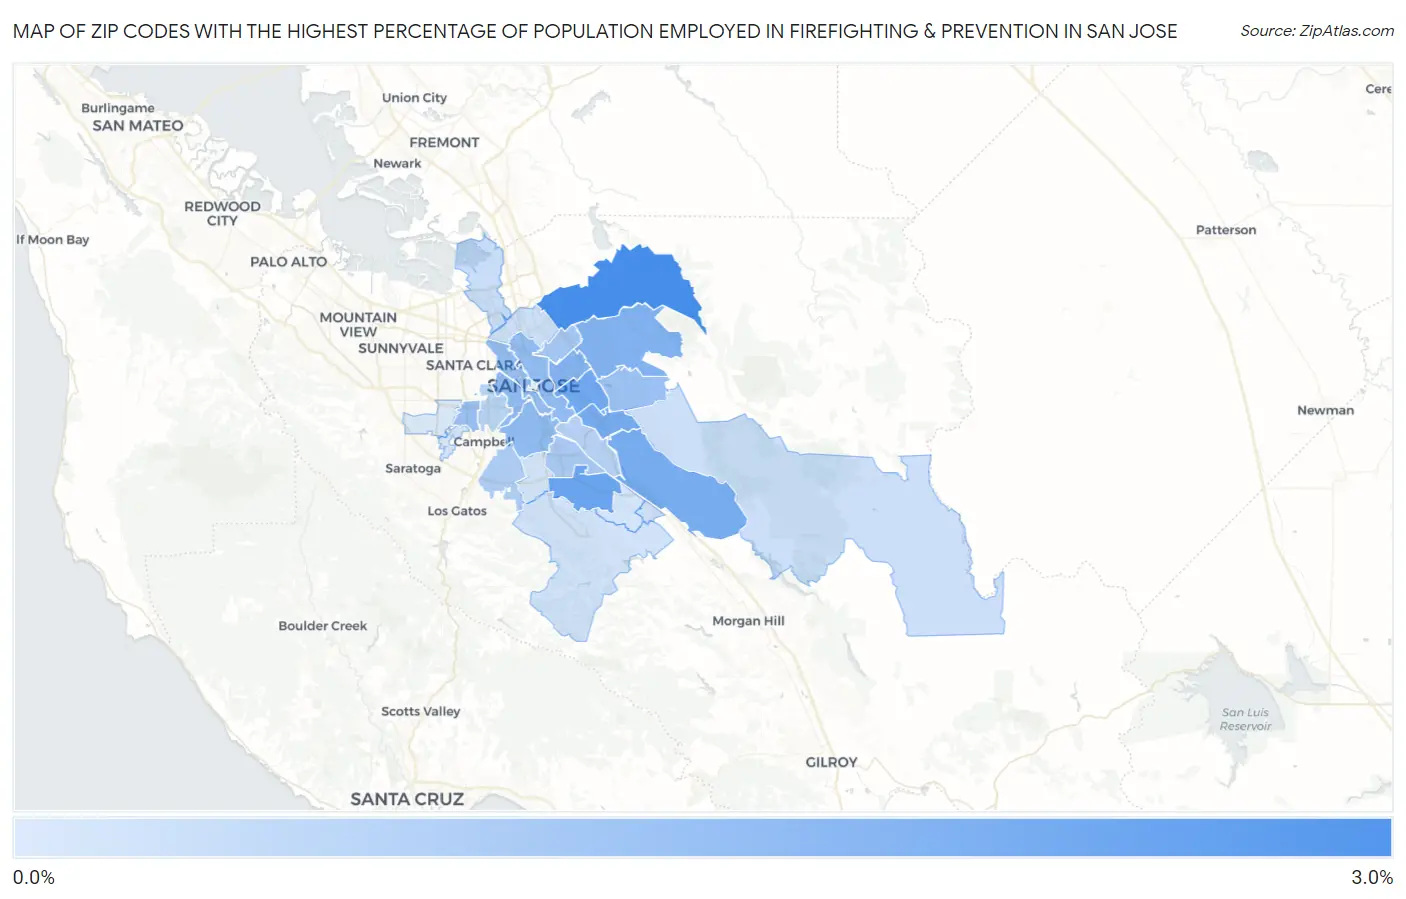
Map of Zip Codes with the Highest Percentage of Population Employed in Firefighting & Prevention in San Jose
0.19%
2.8%
Zip Codes with the Highest Percentage of Population Employed in Firefighting & Prevention in San Jose, CA
| Zip Code | % Employed | vs State | vs National | |
| 1. | 95132 | 2.8% | 1.3%(+1.50)#162 | 1.2%(+1.59)#2,612 |
| 2. | 95123 | 2.1% | 1.3%(+0.840)#260 | 1.2%(+0.930)#4,113 |
| 3. | 95122 | 2.0% | 1.3%(+0.737)#291 | 1.2%(+0.827)#4,470 |
| 4. | 95138 | 1.9% | 1.3%(+0.671)#311 | 1.2%(+0.761)#4,716 |
| 5. | 95121 | 1.9% | 1.3%(+0.668)#312 | 1.2%(+0.758)#4,724 |
| 6. | 95127 | 1.7% | 1.3%(+0.466)#394 | 1.2%(+0.556)#5,619 |
| 7. | 95116 | 1.7% | 1.3%(+0.430)#409 | 1.2%(+0.520)#5,812 |
| 8. | 95125 | 1.5% | 1.3%(+0.218)#507 | 1.2%(+0.308)#7,013 |
| 9. | 95126 | 1.5% | 1.3%(+0.208)#511 | 1.2%(+0.297)#7,090 |
| 10. | 95112 | 1.4% | 1.3%(+0.162)#531 | 1.2%(+0.252)#7,386 |
| 11. | 95110 | 1.4% | 1.3%(+0.113)#561 | 1.2%(+0.203)#7,714 |
| 12. | 95117 | 1.3% | 1.3%(+0.043)#599 | 1.2%(+0.132)#8,211 |
| 13. | 95148 | 1.3% | 1.3%(+0.024)#615 | 1.2%(+0.113)#8,358 |
| 14. | 95133 | 1.1% | 1.3%(-0.151)#738 | 1.2%(-0.061)#9,868 |
| 15. | 95136 | 1.1% | 1.3%(-0.223)#784 | 1.2%(-0.133)#10,571 |
| 16. | 95124 | 0.99% | 1.3%(-0.287)#839 | 1.2%(-0.197)#11,209 |
| 17. | 95111 | 0.82% | 1.3%(-0.453)#955 | 1.2%(-0.363)#12,939 |
| 18. | 95128 | 0.76% | 1.3%(-0.511)#997 | 1.2%(-0.421)#13,610 |
| 19. | 95134 | 0.52% | 1.3%(-0.751)#1,152 | 1.2%(-0.661)#16,265 |
| 20. | 95131 | 0.46% | 1.3%(-0.812)#1,176 | 1.2%(-0.722)#16,957 |
| 21. | 95135 | 0.45% | 1.3%(-0.827)#1,184 | 1.2%(-0.737)#17,108 |
| 22. | 95139 | 0.44% | 1.3%(-0.837)#1,189 | 1.2%(-0.747)#17,225 |
| 23. | 95120 | 0.41% | 1.3%(-0.870)#1,211 | 1.2%(-0.780)#17,582 |
| 24. | 95118 | 0.36% | 1.3%(-0.911)#1,229 | 1.2%(-0.822)#18,072 |
| 25. | 95119 | 0.33% | 1.3%(-0.942)#1,254 | 1.2%(-0.852)#18,418 |
| 26. | 95130 | 0.28% | 1.3%(-0.997)#1,276 | 1.2%(-0.908)#18,977 |
| 27. | 95129 | 0.19% | 1.3%(-1.09)#1,299 | 1.2%(-0.995)#19,750 |
1
Common Questions
What are the Top 10 Zip Codes with the Highest Percentage of Population Employed in Firefighting & Prevention in San Jose, CA?
Top 10 Zip Codes with the Highest Percentage of Population Employed in Firefighting & Prevention in San Jose, CA are:
What zip code has the Highest Percentage of Population Employed in Firefighting & Prevention in San Jose, CA?
95132 has the Highest Percentage of Population Employed in Firefighting & Prevention in San Jose, CA with 2.8%.
What is the Percentage of Population Employed in Firefighting & Prevention in San Jose, CA?
Percentage of Population Employed in Firefighting & Prevention in San Jose is 1.3%.
What is the Percentage of Population Employed in Firefighting & Prevention in California?
Percentage of Population Employed in Firefighting & Prevention in California is 1.3%.
What is the Percentage of Population Employed in Firefighting & Prevention in the United States?
Percentage of Population Employed in Firefighting & Prevention in the United States is 1.2%.