Zip Codes with the Highest Percentage of Population Employed in Cleaning & Maintenance in San Jose, CA
RELATED REPORTS & OPTIONS
Cleaning & Maintenance
San Jose
Compare Zip Codes
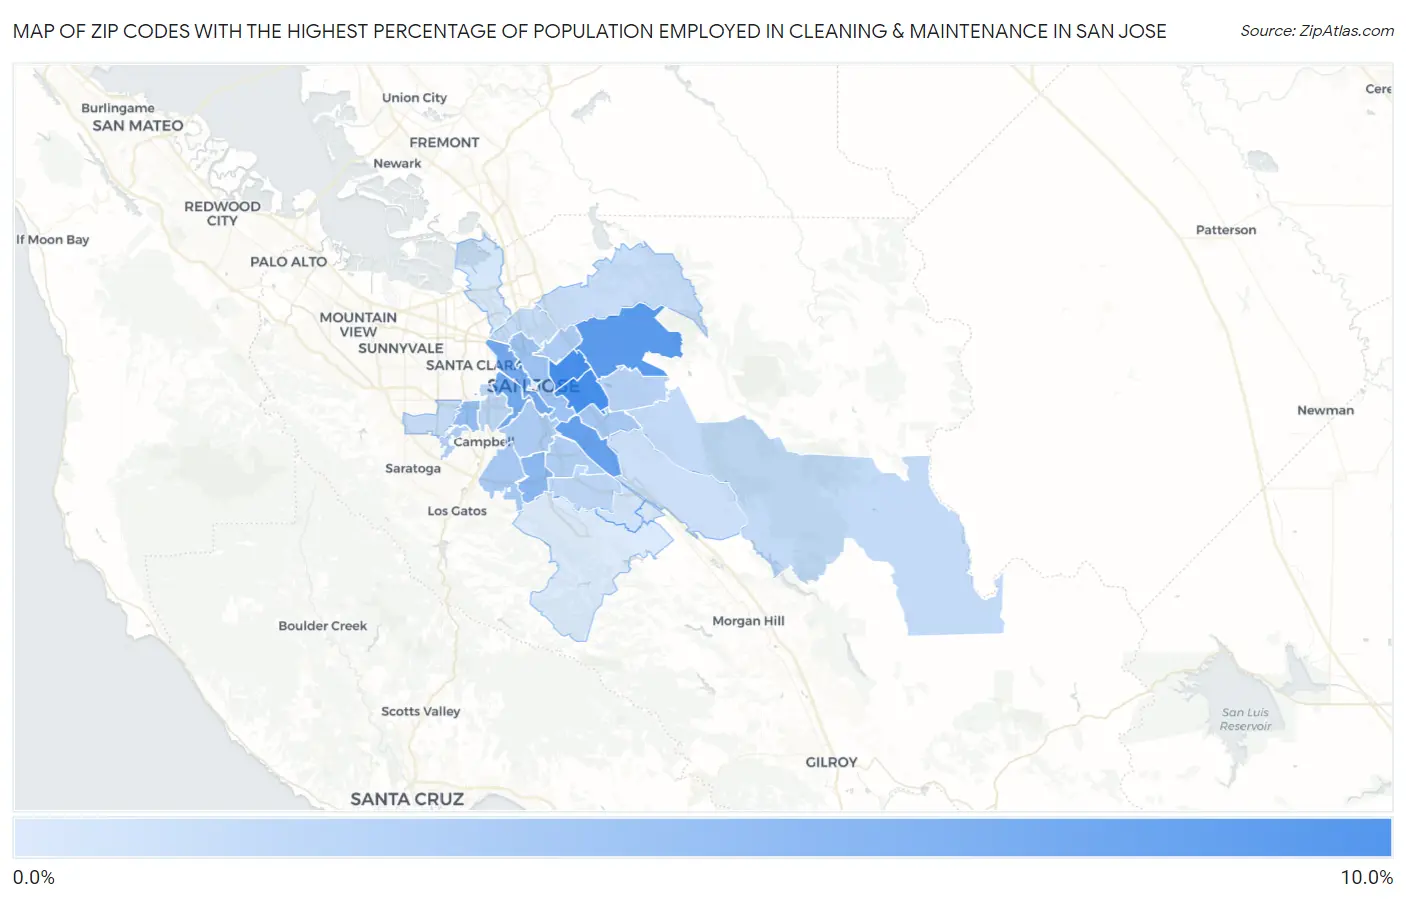
Map of Zip Codes with the Highest Percentage of Population Employed in Cleaning & Maintenance in San Jose
0.51%
8.3%
Zip Codes with the Highest Percentage of Population Employed in Cleaning & Maintenance in San Jose, CA
| Zip Code | % Employed | vs State | vs National | |
| 1. | 95122 | 8.3% | 3.7%(+4.57)#162 | 3.5%(+4.81)#2,783 |
| 2. | 95116 | 8.2% | 3.7%(+4.52)#167 | 3.5%(+4.76)#2,832 |
| 3. | 95127 | 7.2% | 3.7%(+3.52)#242 | 3.5%(+3.76)#3,809 |
| 4. | 95111 | 6.5% | 3.7%(+2.80)#301 | 3.5%(+3.04)#4,737 |
| 5. | 95126 | 5.9% | 3.7%(+2.17)#373 | 3.5%(+2.41)#5,857 |
| 6. | 95110 | 5.8% | 3.7%(+2.04)#393 | 3.5%(+2.28)#6,140 |
| 7. | 95118 | 4.5% | 3.7%(+0.795)#569 | 3.5%(+1.03)#9,459 |
| 8. | 95117 | 4.1% | 3.7%(+0.393)#629 | 3.5%(+0.628)#10,905 |
| 9. | 95112 | 3.6% | 3.7%(-0.096)#722 | 3.5%(+0.139)#12,881 |
| 10. | 95124 | 3.1% | 3.7%(-0.603)#814 | 3.5%(-0.368)#15,287 |
| 11. | 95121 | 3.1% | 3.7%(-0.623)#824 | 3.5%(-0.388)#15,391 |
| 12. | 95133 | 2.8% | 3.7%(-0.898)#892 | 3.5%(-0.663)#16,833 |
| 13. | 95125 | 2.8% | 3.7%(-0.906)#896 | 3.5%(-0.671)#16,877 |
| 14. | 95136 | 2.6% | 3.7%(-1.11)#945 | 3.5%(-0.876)#17,931 |
| 15. | 95130 | 2.6% | 3.7%(-1.16)#955 | 3.5%(-0.920)#18,177 |
| 16. | 95148 | 2.4% | 3.7%(-1.30)#992 | 3.5%(-1.07)#18,935 |
| 17. | 95128 | 2.2% | 3.7%(-1.56)#1,045 | 3.5%(-1.32)#20,277 |
| 18. | 95123 | 2.0% | 3.7%(-1.71)#1,087 | 3.5%(-1.48)#21,046 |
| 19. | 95131 | 1.8% | 3.7%(-1.92)#1,131 | 3.5%(-1.69)#22,095 |
| 20. | 95135 | 1.7% | 3.7%(-1.98)#1,147 | 3.5%(-1.74)#22,352 |
| 21. | 95132 | 1.6% | 3.7%(-2.17)#1,181 | 3.5%(-1.93)#23,273 |
| 22. | 95129 | 1.5% | 3.7%(-2.22)#1,194 | 3.5%(-1.98)#23,498 |
| 23. | 95138 | 1.3% | 3.7%(-2.39)#1,242 | 3.5%(-2.15)#24,252 |
| 24. | 95119 | 1.1% | 3.7%(-2.58)#1,289 | 3.5%(-2.34)#25,000 |
| 25. | 95134 | 0.88% | 3.7%(-2.84)#1,340 | 3.5%(-2.60)#25,886 |
| 26. | 95139 | 0.58% | 3.7%(-3.13)#1,411 | 3.5%(-2.90)#26,764 |
| 27. | 95120 | 0.51% | 3.7%(-3.20)#1,425 | 3.5%(-2.97)#26,963 |
1
Common Questions
What are the Top 10 Zip Codes with the Highest Percentage of Population Employed in Cleaning & Maintenance in San Jose, CA?
Top 10 Zip Codes with the Highest Percentage of Population Employed in Cleaning & Maintenance in San Jose, CA are:
What zip code has the Highest Percentage of Population Employed in Cleaning & Maintenance in San Jose, CA?
95122 has the Highest Percentage of Population Employed in Cleaning & Maintenance in San Jose, CA with 8.3%.
What is the Percentage of Population Employed in Cleaning & Maintenance in San Jose, CA?
Percentage of Population Employed in Cleaning & Maintenance in San Jose is 3.6%.
What is the Percentage of Population Employed in Cleaning & Maintenance in California?
Percentage of Population Employed in Cleaning & Maintenance in California is 3.7%.
What is the Percentage of Population Employed in Cleaning & Maintenance in the United States?
Percentage of Population Employed in Cleaning & Maintenance in the United States is 3.5%.