Zip Codes with the Highest Percentage of Households with Income Above $200,000 in San Jose, CA
RELATED REPORTS & OPTIONS
Household Income | $200k+
San Jose
Compare Zip Codes
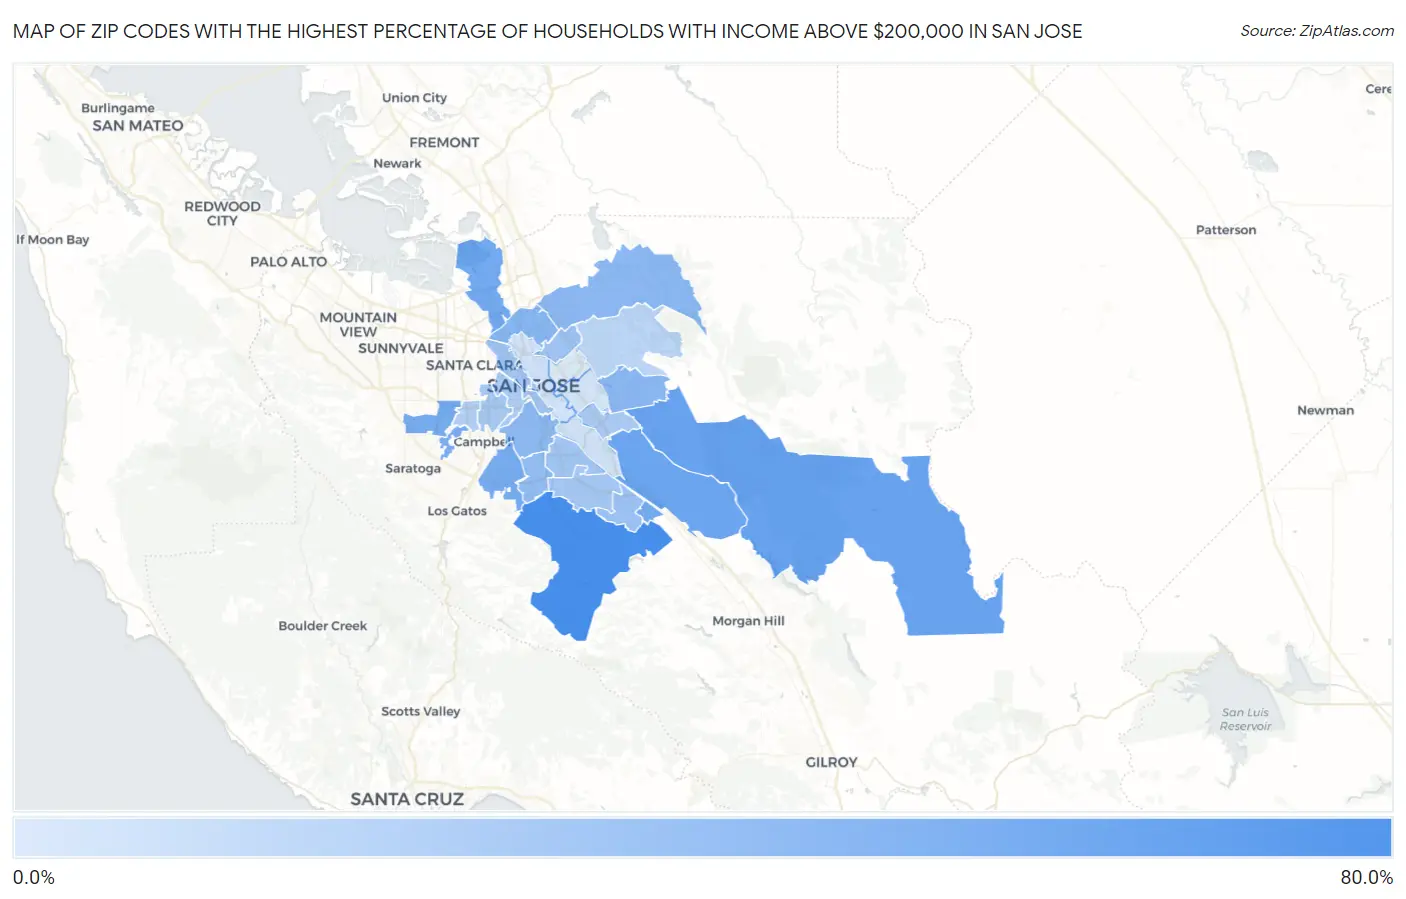
Map of Zip Codes with the Highest Percentage of Households with Income Above $200,000 in San Jose
14.5%
60.8%
Zip Codes with the Highest Percentage of Households with Income Above $200,000 in San Jose, CA
| Zip Code | Households with Income > $200k | vs State | vs National | |
| 1. | 95120 | 60.8% | 17.9%(+42.9)#14 | 11.4%(+49.4)#109 |
| 2. | 95135 | 49.5% | 17.9%(+31.6)#58 | 11.4%(+38.1)#295 |
| 3. | 95138 | 47.8% | 17.9%(+29.9)#64 | 11.4%(+36.4)#334 |
| 4. | 95134 | 45.3% | 17.9%(+27.4)#85 | 11.4%(+33.9)#416 |
| 5. | 95139 | 45.2% | 17.9%(+27.3)#87 | 11.4%(+33.8)#422 |
| 6. | 95124 | 44.3% | 17.9%(+26.4)#94 | 11.4%(+32.9)#452 |
| 7. | 95129 | 43.9% | 17.9%(+26.0)#97 | 11.4%(+32.5)#462 |
| 8. | 95130 | 42.6% | 17.9%(+24.7)#110 | 11.4%(+31.2)#522 |
| 9. | 95131 | 39.1% | 17.9%(+21.2)#141 | 11.4%(+27.7)#697 |
| 10. | 95148 | 38.4% | 17.9%(+20.5)#146 | 11.4%(+27.0)#748 |
| 11. | 95132 | 37.7% | 17.9%(+19.8)#151 | 11.4%(+26.3)#786 |
| 12. | 95125 | 36.7% | 17.9%(+18.8)#162 | 11.4%(+25.3)#855 |
| 13. | 95118 | 35.2% | 17.9%(+17.3)#175 | 11.4%(+23.8)#961 |
| 14. | 95119 | 33.4% | 17.9%(+15.5)#193 | 11.4%(+22.0)#1,119 |
| 15. | 95133 | 31.2% | 17.9%(+13.3)#233 | 11.4%(+19.8)#1,327 |
| 16. | 95110 | 30.8% | 17.9%(+12.9)#240 | 11.4%(+19.4)#1,367 |
| 17. | 95136 | 30.7% | 17.9%(+12.8)#243 | 11.4%(+19.3)#1,375 |
| 18. | 95123 | 29.9% | 17.9%(+12.0)#256 | 11.4%(+18.5)#1,461 |
| 19. | 95113 | 29.9% | 17.9%(+12.0)#259 | 11.4%(+18.5)#1,474 |
| 20. | 95128 | 29.4% | 17.9%(+11.5)#266 | 11.4%(+18.0)#1,529 |
| 21. | 95121 | 27.9% | 17.9%(+10.00)#301 | 11.4%(+16.5)#1,740 |
| 22. | 95126 | 27.1% | 17.9%(+9.20)#322 | 11.4%(+15.7)#1,852 |
| 23. | 95117 | 24.9% | 17.9%(+7.00)#370 | 11.4%(+13.5)#2,208 |
| 24. | 95127 | 23.2% | 17.9%(+5.30)#418 | 11.4%(+11.8)#2,509 |
| 25. | 95112 | 17.6% | 17.9%(-0.300)#608 | 11.4%(+6.20)#3,954 |
| 26. | 95111 | 17.3% | 17.9%(-0.600)#619 | 11.4%(+5.90)#4,059 |
| 27. | 95122 | 16.3% | 17.9%(-1.60)#662 | 11.4%(+4.90)#4,441 |
| 28. | 95116 | 14.5% | 17.9%(-3.40)#735 | 11.4%(+3.10)#5,209 |
1
Common Questions
What are the Top 10 Zip Codes with the Highest Percentage of Households with Income Above $200,000 in San Jose, CA?
Top 10 Zip Codes with the Highest Percentage of Households with Income Above $200,000 in San Jose, CA are:
What zip code has the Highest Percentage of Households with Income Above $200,000 in San Jose, CA?
95120 has the Highest Percentage of Households with Income Above $200,000 in San Jose, CA with 60.8%.
What is the Percentage of Households with Income Above $200,000 in San Jose, CA?
Percentage of Households with Income Above $200,000 in San Jose is 32.3%.
What is the Percentage of Households with Income Above $200,000 in California?
Percentage of Households with Income Above $200,000 in California is 17.9%.
What is the Percentage of Households with Income Above $200,000 in the United States?
Percentage of Households with Income Above $200,000 in the United States is 11.4%.