Zip Codes with the Highest Poverty Level Among Single Females in San Jose, CA
RELATED REPORTS & OPTIONS
Highest Poverty | Single Female
San Jose
Compare Zip Codes
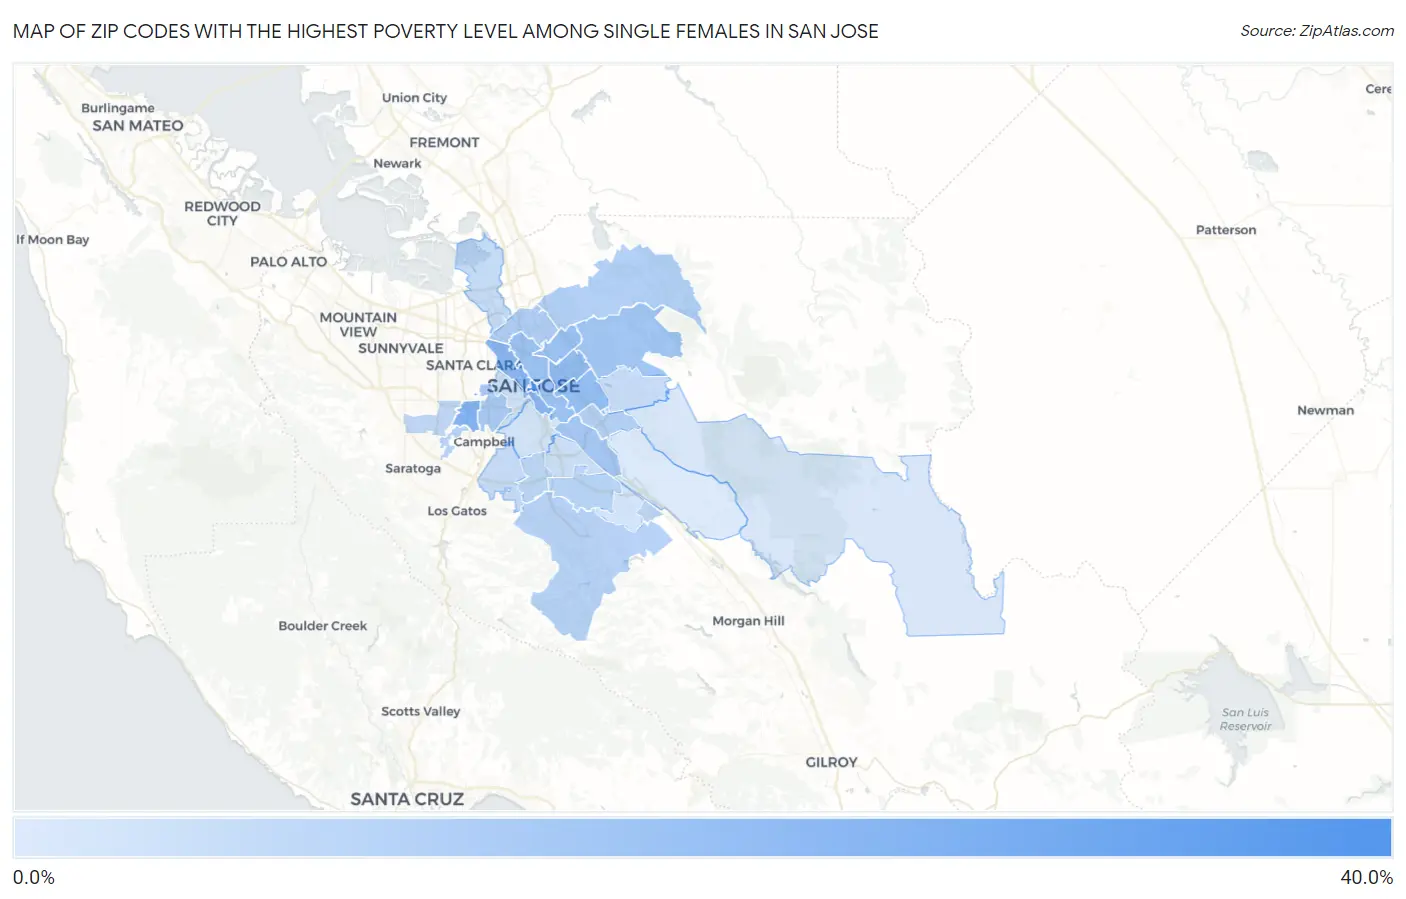
Map of Zip Codes with the Highest Poverty Level Among Single Females in San Jose
4.1%
30.5%
Zip Codes with the Highest Poverty Level Among Single Females in San Jose, CA
| Zip Code | Single Female Poverty | vs State | vs National | |
| 1. | 95113 | 30.5% | 20.3%(+10.2)#302 | 24.1%(+6.41)#9,296 |
| 2. | 95117 | 18.8% | 20.3%(-1.49)#689 | 24.1%(-5.26)#15,599 |
| 3. | 95110 | 17.5% | 20.3%(-2.82)#758 | 24.1%(-6.59)#16,419 |
| 4. | 95116 | 16.6% | 20.3%(-3.72)#795 | 24.1%(-7.49)#16,982 |
| 5. | 95122 | 16.1% | 20.3%(-4.19)#812 | 24.1%(-7.96)#17,209 |
| 6. | 95133 | 15.3% | 20.3%(-5.05)#857 | 24.1%(-8.82)#17,733 |
| 7. | 95112 | 14.8% | 20.3%(-5.48)#874 | 24.1%(-9.25)#17,973 |
| 8. | 95127 | 13.6% | 20.3%(-6.75)#928 | 24.1%(-10.5)#18,697 |
| 9. | 95111 | 13.2% | 20.3%(-7.14)#954 | 24.1%(-10.9)#18,936 |
| 10. | 95128 | 12.5% | 20.3%(-7.83)#997 | 24.1%(-11.6)#19,386 |
| 11. | 95131 | 11.5% | 20.3%(-8.82)#1,039 | 24.1%(-12.6)#19,922 |
| 12. | 95132 | 10.9% | 20.3%(-9.41)#1,073 | 24.1%(-13.2)#20,265 |
| 13. | 95121 | 10.3% | 20.3%(-10.0)#1,107 | 24.1%(-13.8)#20,601 |
| 14. | 95120 | 10.1% | 20.3%(-10.2)#1,110 | 24.1%(-13.9)#20,665 |
| 15. | 95130 | 9.9% | 20.3%(-10.4)#1,123 | 24.1%(-14.2)#20,801 |
| 16. | 95123 | 9.5% | 20.3%(-10.8)#1,134 | 24.1%(-14.5)#20,974 |
| 17. | 95139 | 9.4% | 20.3%(-10.9)#1,136 | 24.1%(-14.6)#21,025 |
| 18. | 95118 | 9.3% | 20.3%(-11.0)#1,145 | 24.1%(-14.8)#21,098 |
| 19. | 95129 | 8.6% | 20.3%(-11.7)#1,182 | 24.1%(-15.5)#21,493 |
| 20. | 95134 | 7.8% | 20.3%(-12.5)#1,211 | 24.1%(-16.3)#21,867 |
| 21. | 95148 | 7.5% | 20.3%(-12.8)#1,223 | 24.1%(-16.6)#22,021 |
| 22. | 95124 | 7.4% | 20.3%(-12.9)#1,227 | 24.1%(-16.7)#22,089 |
| 23. | 95136 | 6.8% | 20.3%(-13.5)#1,244 | 24.1%(-17.3)#22,373 |
| 24. | 95126 | 6.5% | 20.3%(-13.8)#1,256 | 24.1%(-17.6)#22,528 |
| 25. | 95125 | 5.6% | 20.3%(-14.7)#1,282 | 24.1%(-18.5)#22,896 |
| 26. | 95119 | 5.4% | 20.3%(-14.9)#1,286 | 24.1%(-18.6)#22,963 |
| 27. | 95135 | 4.7% | 20.3%(-15.6)#1,303 | 24.1%(-19.3)#23,229 |
| 28. | 95138 | 4.1% | 20.3%(-16.2)#1,315 | 24.1%(-20.0)#23,428 |
1
Common Questions
What are the Top 10 Zip Codes with the Highest Poverty Level Among Single Females in San Jose, CA?
Top 10 Zip Codes with the Highest Poverty Level Among Single Females in San Jose, CA are:
What zip code has the Highest Poverty Level Among Single Females in San Jose, CA?
95113 has the Highest Poverty Level Among Single Females in San Jose, CA with 30.5%.
What is the Poverty Level Among Single Females in San Jose, CA?
Poverty Level Among Single Females in San Jose is 11.6%.
What is the Poverty Level Among Single Females in California?
Poverty Level Among Single Females in California is 20.3%.
What is the Poverty Level Among Single Females in the United States?
Poverty Level Among Single Females in the United States is 24.1%.