Zip Codes with the Highest Percentage of Households with Income Above $100,000 in San Jose, CA
RELATED REPORTS & OPTIONS
Household Income | $100k+
San Jose
Compare Zip Codes
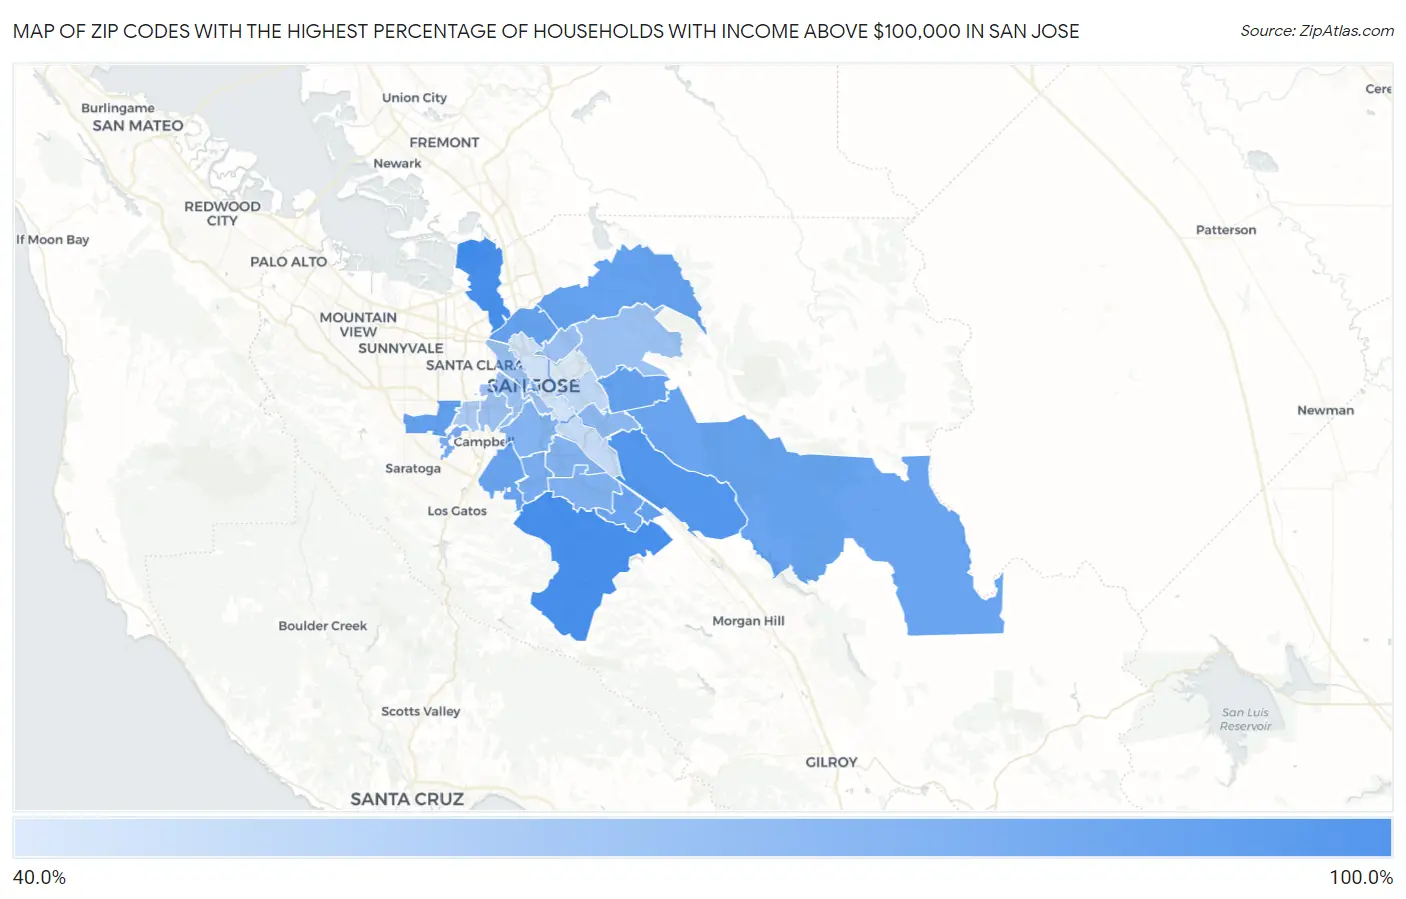
Map of Zip Codes with the Highest Percentage of Households with Income Above $100,000 in San Jose
41.6%
81.2%
Zip Codes with the Highest Percentage of Households with Income Above $100,000 in San Jose, CA
| Zip Code | Households with Income > $100k | vs State | vs National | |
| 1. | 95120 | 81.2% | 46.4%(+34.8)#25 | 37.3%(+43.9)#302 |
| 2. | 95134 | 81.2% | 46.4%(+34.8)#26 | 37.3%(+43.9)#303 |
| 3. | 95138 | 78.1% | 46.4%(+31.7)#41 | 37.3%(+40.8)#418 |
| 4. | 95129 | 73.0% | 46.4%(+26.6)#96 | 37.3%(+35.7)#699 |
| 5. | 95132 | 72.8% | 46.4%(+26.4)#101 | 37.3%(+35.5)#719 |
| 6. | 95131 | 72.6% | 46.4%(+26.2)#105 | 37.3%(+35.3)#730 |
| 7. | 95148 | 72.4% | 46.4%(+26.0)#108 | 37.3%(+35.1)#743 |
| 8. | 95139 | 72.4% | 46.4%(+26.0)#110 | 37.3%(+35.1)#748 |
| 9. | 95124 | 71.2% | 46.4%(+24.8)#123 | 37.3%(+33.9)#845 |
| 10. | 95135 | 71.1% | 46.4%(+24.7)#126 | 37.3%(+33.8)#861 |
| 11. | 95119 | 70.9% | 46.4%(+24.5)#130 | 37.3%(+33.6)#883 |
| 12. | 95130 | 67.6% | 46.4%(+21.2)#163 | 37.3%(+30.3)#1,213 |
| 13. | 95118 | 66.8% | 46.4%(+20.4)#172 | 37.3%(+29.5)#1,289 |
| 14. | 95113 | 66.2% | 46.4%(+19.8)#189 | 37.3%(+28.9)#1,386 |
| 15. | 95123 | 64.9% | 46.4%(+18.5)#213 | 37.3%(+27.6)#1,551 |
| 16. | 95136 | 64.4% | 46.4%(+18.0)#227 | 37.3%(+27.1)#1,624 |
| 17. | 95125 | 63.5% | 46.4%(+17.1)#253 | 37.3%(+26.2)#1,750 |
| 18. | 95121 | 61.4% | 46.4%(+15.0)#301 | 37.3%(+24.1)#2,100 |
| 19. | 95126 | 58.3% | 46.4%(+11.9)#371 | 37.3%(+21.0)#2,702 |
| 20. | 95127 | 57.8% | 46.4%(+11.4)#385 | 37.3%(+20.5)#2,794 |
| 21. | 95133 | 57.8% | 46.4%(+11.4)#386 | 37.3%(+20.5)#2,802 |
| 22. | 95128 | 57.6% | 46.4%(+11.2)#393 | 37.3%(+20.3)#2,843 |
| 23. | 95110 | 57.6% | 46.4%(+11.2)#394 | 37.3%(+20.3)#2,849 |
| 24. | 95117 | 53.6% | 46.4%(+7.20)#502 | 37.3%(+16.3)#3,803 |
| 25. | 95122 | 48.2% | 46.4%(+1.80)#650 | 37.3%(+10.9)#5,415 |
| 26. | 95111 | 46.3% | 46.4%(-0.100)#705 | 37.3%(+9.00)#6,076 |
| 27. | 95112 | 44.2% | 46.4%(-2.20)#775 | 37.3%(+6.90)#6,914 |
| 28. | 95116 | 41.6% | 46.4%(-4.80)#862 | 37.3%(+4.30)#8,068 |
1
Common Questions
What are the Top 10 Zip Codes with the Highest Percentage of Households with Income Above $100,000 in San Jose, CA?
Top 10 Zip Codes with the Highest Percentage of Households with Income Above $100,000 in San Jose, CA are:
What zip code has the Highest Percentage of Households with Income Above $100,000 in San Jose, CA?
95120 has the Highest Percentage of Households with Income Above $100,000 in San Jose, CA with 81.2%.
What is the Percentage of Households with Income Above $100,000 in San Jose, CA?
Percentage of Households with Income Above $100,000 in San Jose is 62.5%.
What is the Percentage of Households with Income Above $100,000 in California?
Percentage of Households with Income Above $100,000 in California is 46.4%.
What is the Percentage of Households with Income Above $100,000 in the United States?
Percentage of Households with Income Above $100,000 in the United States is 37.3%.