Zip Codes with the Highest Percentage of Population Employed in Life, Physical & Social Science in San Jose, CA
RELATED REPORTS & OPTIONS
Life, Physical & Social Science
San Jose
Compare Zip Codes
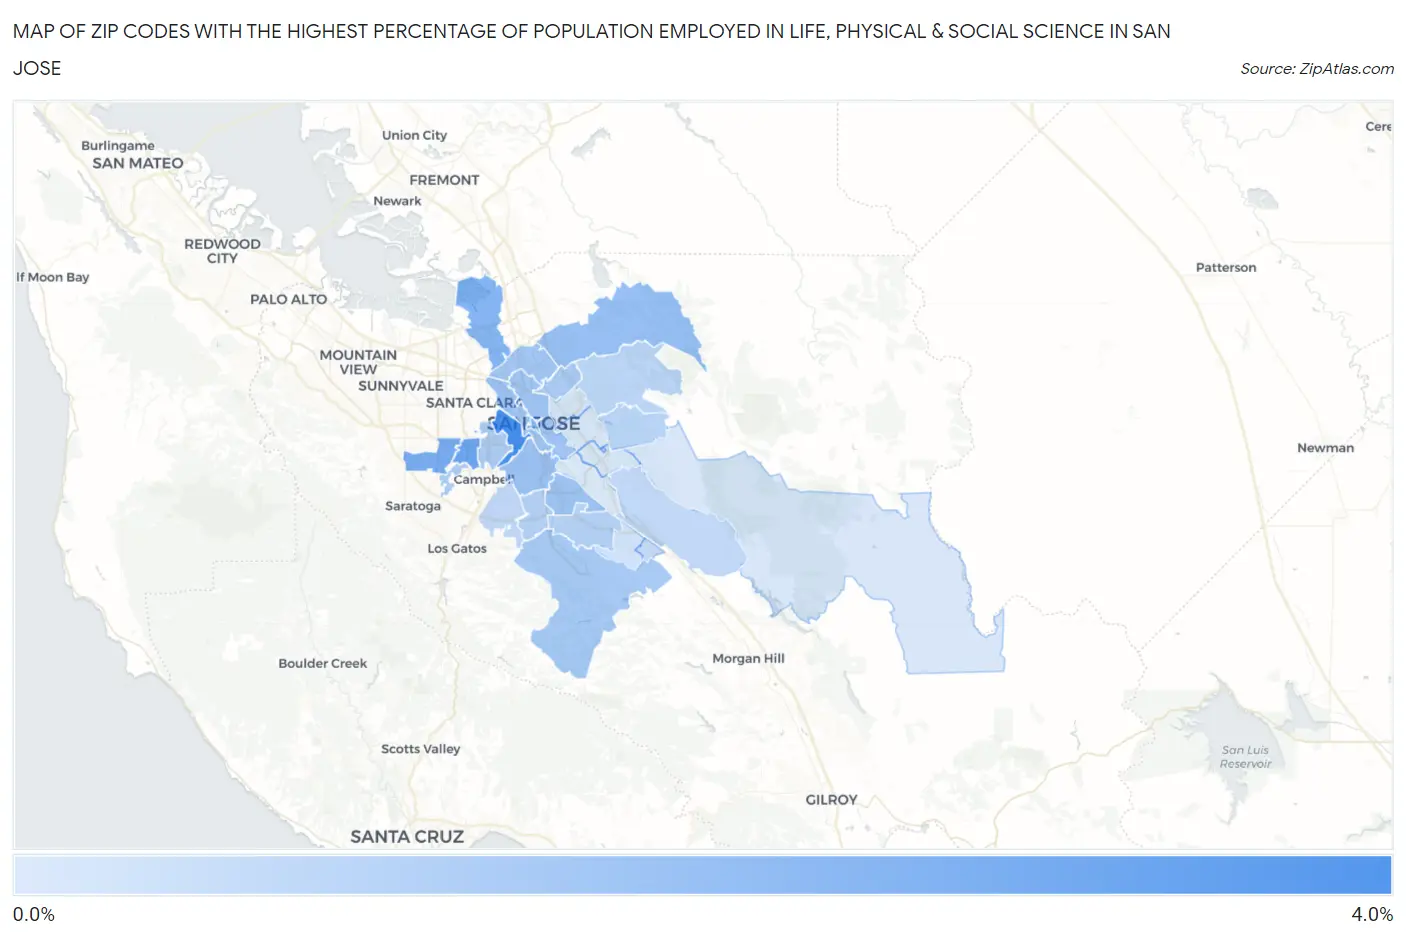
Map of Zip Codes with the Highest Percentage of Population Employed in Life, Physical & Social Science in San Jose
0.49%
3.3%
Zip Codes with the Highest Percentage of Population Employed in Life, Physical & Social Science in San Jose, CA
| Zip Code | % Employed | vs State | vs National | |
| 1. | 95126 | 3.3% | 1.3%(+1.99)#160 | 1.1%(+2.20)#1,584 |
| 2. | 95117 | 2.6% | 1.3%(+1.26)#233 | 1.1%(+1.47)#2,451 |
| 3. | 95129 | 2.4% | 1.3%(+1.04)#255 | 1.1%(+1.26)#2,838 |
| 4. | 95113 | 2.1% | 1.3%(+0.838)#302 | 1.1%(+1.06)#3,313 |
| 5. | 95134 | 2.1% | 1.3%(+0.796)#310 | 1.1%(+1.01)#3,415 |
| 6. | 95132 | 1.8% | 1.3%(+0.461)#389 | 1.1%(+0.678)#4,448 |
| 7. | 95125 | 1.7% | 1.3%(+0.387)#411 | 1.1%(+0.604)#4,747 |
| 8. | 95136 | 1.6% | 1.3%(+0.325)#437 | 1.1%(+0.542)#5,022 |
| 9. | 95112 | 1.6% | 1.3%(+0.299)#450 | 1.1%(+0.516)#5,120 |
| 10. | 95110 | 1.6% | 1.3%(+0.293)#455 | 1.1%(+0.510)#5,153 |
| 11. | 95131 | 1.6% | 1.3%(+0.271)#461 | 1.1%(+0.488)#5,260 |
| 12. | 95120 | 1.5% | 1.3%(+0.146)#508 | 1.1%(+0.363)#5,902 |
| 13. | 95133 | 1.4% | 1.3%(+0.137)#510 | 1.1%(+0.354)#5,943 |
| 14. | 95128 | 1.4% | 1.3%(+0.067)#537 | 1.1%(+0.284)#6,331 |
| 15. | 95130 | 1.3% | 1.3%(+0.010)#562 | 1.1%(+0.227)#6,685 |
| 16. | 95123 | 1.2% | 1.3%(-0.075)#596 | 1.1%(+0.142)#7,244 |
| 17. | 95118 | 1.2% | 1.3%(-0.084)#605 | 1.1%(+0.133)#7,311 |
| 18. | 95148 | 1.1% | 1.3%(-0.165)#660 | 1.1%(+0.052)#7,914 |
| 19. | 95127 | 1.1% | 1.3%(-0.226)#697 | 1.1%(-0.009)#8,371 |
| 20. | 95124 | 1.0% | 1.3%(-0.304)#739 | 1.1%(-0.087)#9,020 |
| 21. | 95138 | 0.99% | 1.3%(-0.320)#747 | 1.1%(-0.103)#9,157 |
| 22. | 95139 | 0.91% | 1.3%(-0.401)#799 | 1.1%(-0.184)#9,900 |
| 23. | 95119 | 0.69% | 1.3%(-0.621)#952 | 1.1%(-0.404)#12,197 |
| 24. | 95116 | 0.62% | 1.3%(-0.686)#998 | 1.1%(-0.469)#13,017 |
| 25. | 95122 | 0.59% | 1.3%(-0.721)#1,017 | 1.1%(-0.504)#13,463 |
| 26. | 95121 | 0.57% | 1.3%(-0.741)#1,029 | 1.1%(-0.524)#13,683 |
| 27. | 95135 | 0.57% | 1.3%(-0.742)#1,031 | 1.1%(-0.525)#13,693 |
| 28. | 95111 | 0.49% | 1.3%(-0.818)#1,085 | 1.1%(-0.601)#14,632 |
1
Common Questions
What are the Top 10 Zip Codes with the Highest Percentage of Population Employed in Life, Physical & Social Science in San Jose, CA?
Top 10 Zip Codes with the Highest Percentage of Population Employed in Life, Physical & Social Science in San Jose, CA are:
What zip code has the Highest Percentage of Population Employed in Life, Physical & Social Science in San Jose, CA?
95126 has the Highest Percentage of Population Employed in Life, Physical & Social Science in San Jose, CA with 3.3%.
What is the Percentage of Population Employed in Life, Physical & Social Science in San Jose, CA?
Percentage of Population Employed in Life, Physical & Social Science in San Jose is 1.4%.
What is the Percentage of Population Employed in Life, Physical & Social Science in California?
Percentage of Population Employed in Life, Physical & Social Science in California is 1.3%.
What is the Percentage of Population Employed in Life, Physical & Social Science in the United States?
Percentage of Population Employed in Life, Physical & Social Science in the United States is 1.1%.