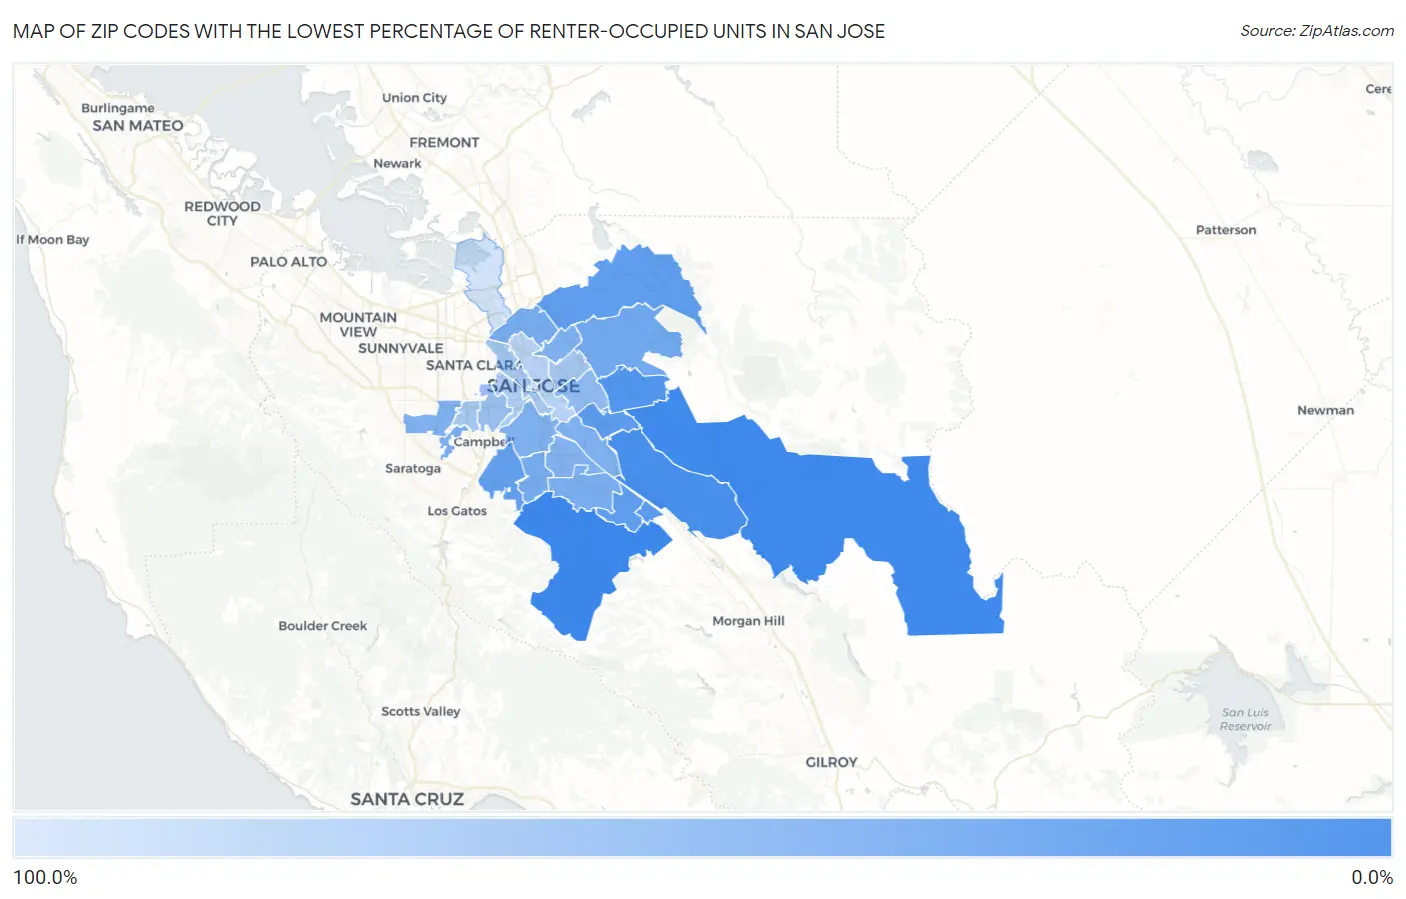
Zip Codes with the Lowest Percentage of Renter-Occupied Units in San Jose, CA
RELATED REPORTS & OPTIONS
Lowest Renter-Occupied
San Jose
Compare Zip Codes
Map of Zip Codes with the Lowest Percentage of Renter-Occupied Units in San Jose
87.0%
11.1%
Zip Codes with the Lowest Percentage of Renter-Occupied Units in San Jose, CA
| Zip Code | % Renter-Occupied | vs State | vs National | |
| 1. | 95120 | 11.1% | 44.4%(-33.3)#68 | 35.2%(-24.1)#4,544 |
| 2. | 95135 | 12.5% | 44.4%(-31.9)#88 | 35.2%(-22.7)#5,703 |
| 3. | 95138 | 15.8% | 44.4%(-28.6)#161 | 35.2%(-19.4)#8,770 |
| 4. | 95148 | 20.3% | 44.4%(-24.1)#265 | 35.2%(-14.9)#13,195 |
| 5. | 95139 | 24.4% | 44.4%(-20.0)#382 | 35.2%(-10.8)#16,945 |
| 6. | 95121 | 25.2% | 44.4%(-19.2)#409 | 35.2%(-9.98)#17,672 |
| 7. | 95132 | 26.3% | 44.4%(-18.0)#442 | 35.2%(-8.84)#18,533 |
| 8. | 95119 | 26.6% | 44.4%(-17.8)#447 | 35.2%(-8.63)#18,678 |
| 9. | 95124 | 26.8% | 44.4%(-17.6)#455 | 35.2%(-8.40)#18,851 |
| 10. | 95127 | 34.2% | 44.4%(-10.2)#721 | 35.2%(-1.03)#23,322 |
| 11. | 95118 | 36.6% | 44.4%(-7.73)#813 | 35.2%(+1.46)#24,452 |
| 12. | 95131 | 36.8% | 44.4%(-7.56)#820 | 35.2%(+1.63)#24,534 |
| 13. | 95130 | 39.2% | 44.4%(-5.14)#905 | 35.2%(+4.04)#25,457 |
| 14. | 95123 | 39.7% | 44.4%(-4.69)#922 | 35.2%(+4.50)#25,601 |
| 15. | 95133 | 40.8% | 44.4%(-3.59)#958 | 35.2%(+5.60)#25,924 |
| 16. | 95125 | 41.0% | 44.4%(-3.40)#965 | 35.2%(+5.79)#25,980 |
| 17. | 95129 | 41.0% | 44.4%(-3.39)#967 | 35.2%(+5.80)#25,983 |
| 18. | 95111 | 41.4% | 44.4%(-2.93)#979 | 35.2%(+6.26)#26,124 |
| 19. | 95136 | 42.9% | 44.4%(-1.52)#1,022 | 35.2%(+7.67)#26,482 |
| 20. | 95122 | 49.4% | 44.4%(+5.02)#1,195 | 35.2%(+14.2)#27,907 |
| 21. | 95128 | 55.7% | 44.4%(+11.4)#1,332 | 35.2%(+20.6)#28,863 |
| 22. | 95116 | 60.4% | 44.4%(+16.0)#1,403 | 35.2%(+25.2)#29,340 |
| 23. | 95110 | 61.8% | 44.4%(+17.5)#1,422 | 35.2%(+26.7)#29,454 |
| 24. | 95117 | 62.3% | 44.4%(+17.9)#1,432 | 35.2%(+27.1)#29,494 |
| 25. | 95126 | 65.5% | 44.4%(+21.1)#1,476 | 35.2%(+30.3)#29,750 |
| 26. | 95112 | 71.5% | 44.4%(+27.1)#1,543 | 35.2%(+36.3)#30,115 |
| 27. | 95113 | 84.6% | 44.4%(+40.2)#1,614 | 35.2%(+49.4)#30,539 |
| 28. | 95134 | 87.0% | 44.4%(+42.6)#1,620 | 35.2%(+51.8)#30,578 |
1
Common Questions
What are the Top 10 Zip Codes with the Lowest Percentage of Renter-Occupied Units in San Jose, CA?
Top 10 Zip Codes with the Lowest Percentage of Renter-Occupied Units in San Jose, CA are:
What zip code has the Lowest Percentage of Renter-Occupied Units in San Jose, CA?
95120 has the Lowest Percentage of Renter-Occupied Units in San Jose, CA with 11.1%.
What is the Percentage of Renter-Occupied Units in San Jose, CA?
Percentage of Renter-Occupied Units in San Jose is 44.2%.
What is the Percentage of Renter-Occupied Units in California?
Percentage of Renter-Occupied Units in California is 44.4%.
What is the Percentage of Renter-Occupied Units in the United States?
Percentage of Renter-Occupied Units in the United States is 35.2%.