Zip Codes with the Highest Percentage of Population with a Degree in Science and Engineering in San Jose, CA
RELATED REPORTS & OPTIONS
Science and Engineering
San Jose
Compare Zip Codes
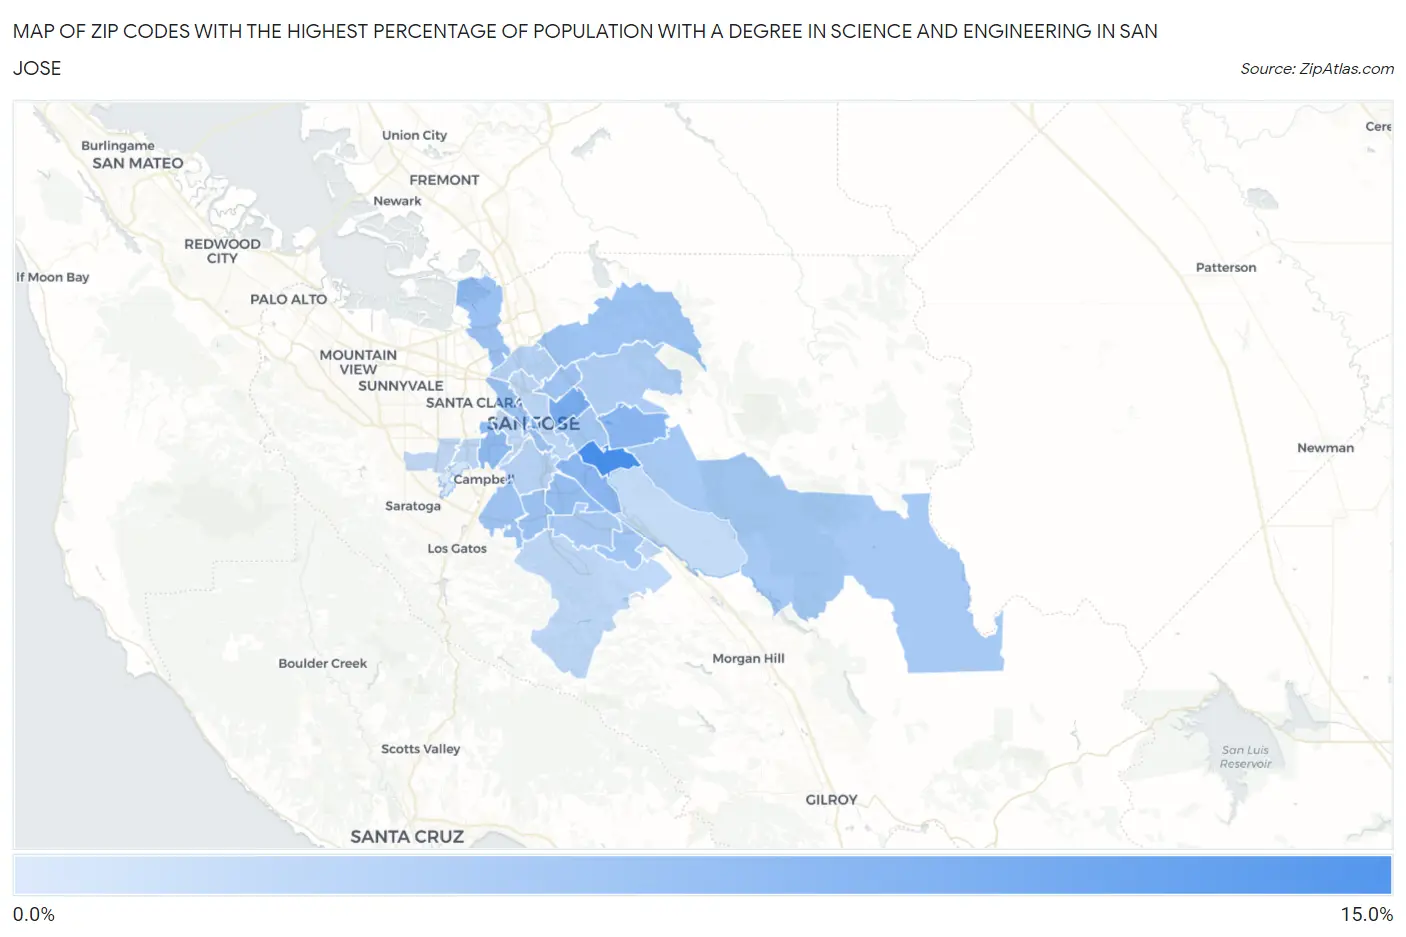
Map of Zip Codes with the Highest Percentage of Population with a Degree in Science and Engineering in San Jose
4.4%
14.6%
Zip Codes with the Highest Percentage of Population with a Degree in Science and Engineering in San Jose, CA
| Zip Code | % Graduates | vs State | vs National | |
| 1. | 95121 | 14.6% | 8.3%(+6.38)#155 | 9.8%(+4.86)#7,069 |
| 2. | 95116 | 11.0% | 8.3%(+2.74)#363 | 9.8%(+1.22)#12,871 |
| 3. | 95113 | 10.3% | 8.3%(+2.00)#439 | 9.8%(+0.477)#14,472 |
| 4. | 95148 | 9.9% | 8.3%(+1.63)#490 | 9.8%(+0.111)#15,278 |
| 5. | 95111 | 9.8% | 8.3%(+1.53)#505 | 9.8%(+0.006)#15,503 |
| 6. | 95128 | 9.5% | 8.3%(+1.25)#543 | 9.8%(-0.274)#16,148 |
| 7. | 95136 | 9.1% | 8.3%(+0.815)#600 | 9.8%(-0.706)#17,163 |
| 8. | 95134 | 8.8% | 8.3%(+0.542)#642 | 9.8%(-0.979)#17,793 |
| 9. | 95110 | 8.6% | 8.3%(+0.332)#681 | 9.8%(-1.19)#18,268 |
| 10. | 95132 | 8.5% | 8.3%(+0.251)#697 | 9.8%(-1.27)#18,434 |
| 11. | 95118 | 8.5% | 8.3%(+0.207)#704 | 9.8%(-1.31)#18,541 |
| 12. | 95124 | 8.4% | 8.3%(+0.139)#715 | 9.8%(-1.38)#18,696 |
| 13. | 95133 | 8.4% | 8.3%(+0.129)#717 | 9.8%(-1.39)#18,717 |
| 14. | 95119 | 8.2% | 8.3%(-0.088)#760 | 9.8%(-1.61)#19,260 |
| 15. | 95122 | 8.0% | 8.3%(-0.301)#803 | 9.8%(-1.82)#19,729 |
| 16. | 95135 | 7.9% | 8.3%(-0.359)#813 | 9.8%(-1.88)#19,864 |
| 17. | 95123 | 7.7% | 8.3%(-0.530)#849 | 9.8%(-2.05)#20,221 |
| 18. | 95127 | 7.5% | 8.3%(-0.783)#889 | 9.8%(-2.30)#20,769 |
| 19. | 95131 | 7.0% | 8.3%(-1.24)#979 | 9.8%(-2.76)#21,683 |
| 20. | 95125 | 6.8% | 8.3%(-1.42)#1,011 | 9.8%(-2.94)#22,002 |
| 21. | 95112 | 6.5% | 8.3%(-1.76)#1,071 | 9.8%(-3.28)#22,582 |
| 22. | 95120 | 6.4% | 8.3%(-1.85)#1,090 | 9.8%(-3.37)#22,736 |
| 23. | 95117 | 6.4% | 8.3%(-1.85)#1,091 | 9.8%(-3.38)#22,752 |
| 24. | 95126 | 6.3% | 8.3%(-2.01)#1,121 | 9.8%(-3.53)#23,007 |
| 25. | 95139 | 6.2% | 8.3%(-2.05)#1,126 | 9.8%(-3.57)#23,092 |
| 26. | 95129 | 6.2% | 8.3%(-2.06)#1,127 | 9.8%(-3.58)#23,104 |
| 27. | 95138 | 5.9% | 8.3%(-2.34)#1,174 | 9.8%(-3.86)#23,556 |
| 28. | 95130 | 4.4% | 8.3%(-3.88)#1,352 | 9.8%(-5.40)#25,405 |
1
Common Questions
What are the Top 10 Zip Codes with the Highest Percentage of Population with a Degree in Science and Engineering in San Jose, CA?
Top 10 Zip Codes with the Highest Percentage of Population with a Degree in Science and Engineering in San Jose, CA are:
What zip code has the Highest Percentage of Population with a Degree in Science and Engineering in San Jose, CA?
95121 has the Highest Percentage of Population with a Degree in Science and Engineering in San Jose, CA with 14.6%.
What is the Percentage of Population with a Degree in Science and Engineering in San Jose, CA?
Percentage of Population with a Degree in Science and Engineering in San Jose is 7.9%.
What is the Percentage of Population with a Degree in Science and Engineering in California?
Percentage of Population with a Degree in Science and Engineering in California is 8.3%.
What is the Percentage of Population with a Degree in Science and Engineering in the United States?
Percentage of Population with a Degree in Science and Engineering in the United States is 9.8%.