Zip Codes with the Highest Percentage of Population with a Degree in Liberal Arts and History in San Jose, CA
RELATED REPORTS & OPTIONS
Liberal Arts and History
San Jose
Compare Zip Codes
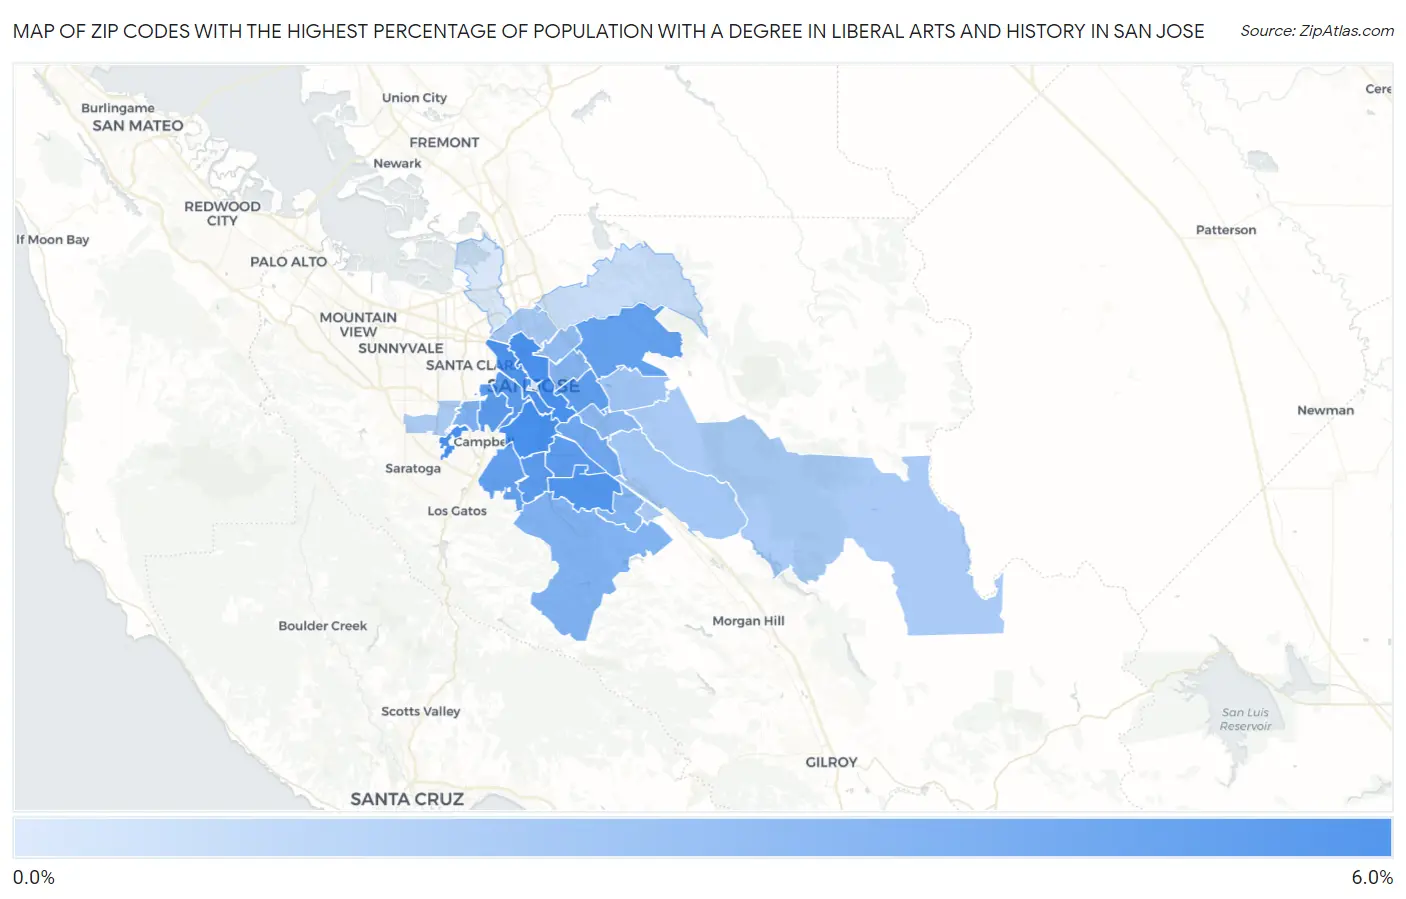
Map of Zip Codes with the Highest Percentage of Population with a Degree in Liberal Arts and History in San Jose
0.78%
5.1%
Zip Codes with the Highest Percentage of Population with a Degree in Liberal Arts and History in San Jose, CA
| Zip Code | % Graduates | vs State | vs National | |
| 1. | 95125 | 5.1% | 5.5%(-0.433)#965 | 4.9%(+0.190)#11,157 |
| 2. | 95130 | 5.0% | 5.5%(-0.458)#973 | 4.9%(+0.166)#11,234 |
| 3. | 95112 | 5.0% | 5.5%(-0.526)#980 | 4.9%(+0.098)#11,428 |
| 4. | 95110 | 4.8% | 5.5%(-0.652)#1,011 | 4.9%(-0.028)#11,835 |
| 5. | 95123 | 4.7% | 5.5%(-0.802)#1,036 | 4.9%(-0.179)#12,341 |
| 6. | 95128 | 4.5% | 5.5%(-1.01)#1,081 | 4.9%(-0.382)#12,999 |
| 7. | 95118 | 4.5% | 5.5%(-1.04)#1,091 | 4.9%(-0.419)#13,113 |
| 8. | 95126 | 4.4% | 5.5%(-1.05)#1,092 | 4.9%(-0.423)#13,125 |
| 9. | 95136 | 4.4% | 5.5%(-1.09)#1,101 | 4.9%(-0.463)#13,260 |
| 10. | 95122 | 4.3% | 5.5%(-1.20)#1,121 | 4.9%(-0.572)#13,632 |
| 11. | 95124 | 4.3% | 5.5%(-1.21)#1,127 | 4.9%(-0.589)#13,699 |
| 12. | 95127 | 4.2% | 5.5%(-1.29)#1,146 | 4.9%(-0.667)#13,993 |
| 13. | 95111 | 3.9% | 5.5%(-1.62)#1,211 | 4.9%(-0.999)#15,257 |
| 14. | 95120 | 3.4% | 5.5%(-2.09)#1,294 | 4.9%(-1.47)#16,968 |
| 15. | 95117 | 3.4% | 5.5%(-2.13)#1,301 | 4.9%(-1.50)#17,090 |
| 16. | 95119 | 3.3% | 5.5%(-2.20)#1,310 | 4.9%(-1.57)#17,312 |
| 17. | 95116 | 3.2% | 5.5%(-2.25)#1,322 | 4.9%(-1.62)#17,479 |
| 18. | 95121 | 3.1% | 5.5%(-2.40)#1,343 | 4.9%(-1.78)#18,018 |
| 19. | 95133 | 2.9% | 5.5%(-2.63)#1,365 | 4.9%(-2.01)#18,797 |
| 20. | 95148 | 2.5% | 5.5%(-3.01)#1,398 | 4.9%(-2.39)#20,046 |
| 21. | 95138 | 2.4% | 5.5%(-3.09)#1,402 | 4.9%(-2.47)#20,255 |
| 22. | 95131 | 2.4% | 5.5%(-3.13)#1,404 | 4.9%(-2.50)#20,361 |
| 23. | 95135 | 2.2% | 5.5%(-3.28)#1,419 | 4.9%(-2.65)#20,790 |
| 24. | 95139 | 2.2% | 5.5%(-3.29)#1,420 | 4.9%(-2.67)#20,822 |
| 25. | 95129 | 2.1% | 5.5%(-3.36)#1,424 | 4.9%(-2.73)#20,990 |
| 26. | 95132 | 1.4% | 5.5%(-4.14)#1,452 | 4.9%(-3.52)#22,766 |
| 27. | 95134 | 0.92% | 5.5%(-4.58)#1,464 | 4.9%(-3.95)#23,521 |
| 28. | 95113 | 0.78% | 5.5%(-4.71)#1,467 | 4.9%(-4.09)#23,710 |
1
Common Questions
What are the Top 10 Zip Codes with the Highest Percentage of Population with a Degree in Liberal Arts and History in San Jose, CA?
Top 10 Zip Codes with the Highest Percentage of Population with a Degree in Liberal Arts and History in San Jose, CA are:
What zip code has the Highest Percentage of Population with a Degree in Liberal Arts and History in San Jose, CA?
95125 has the Highest Percentage of Population with a Degree in Liberal Arts and History in San Jose, CA with 5.1%.
What is the Percentage of Population with a Degree in Liberal Arts and History in San Jose, CA?
Percentage of Population with a Degree in Liberal Arts and History in San Jose is 3.5%.
What is the Percentage of Population with a Degree in Liberal Arts and History in California?
Percentage of Population with a Degree in Liberal Arts and History in California is 5.5%.
What is the Percentage of Population with a Degree in Liberal Arts and History in the United States?
Percentage of Population with a Degree in Liberal Arts and History in the United States is 4.9%.