Zip Codes with the Highest Percentage of Population Employed in Education, Arts & Media in San Jose, CA
RELATED REPORTS & OPTIONS
Education, Arts & Media
San Jose
Compare Zip Codes
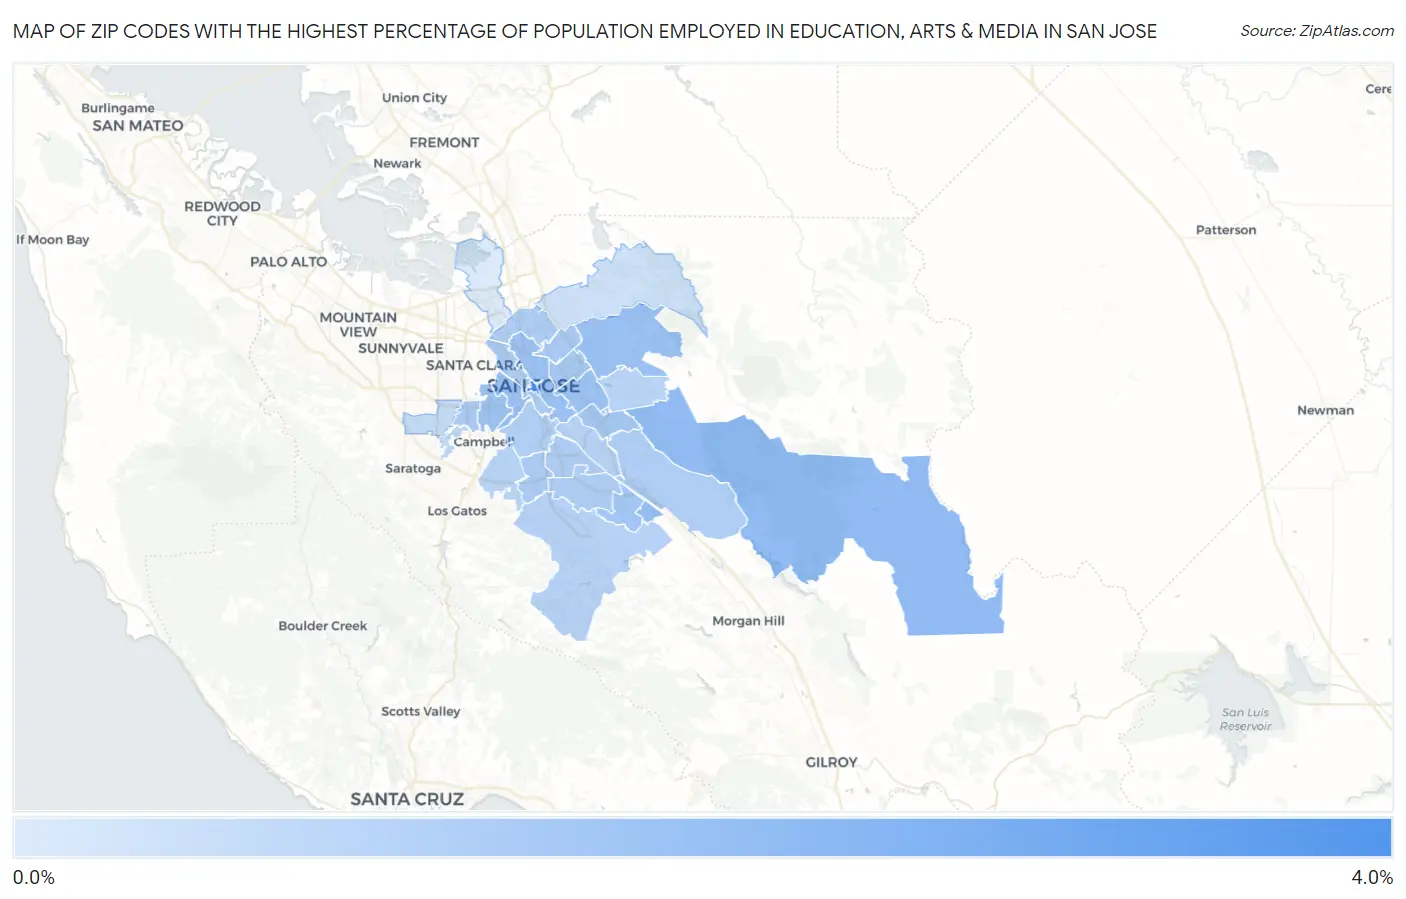
Map of Zip Codes with the Highest Percentage of Population Employed in Education, Arts & Media in San Jose
0.14%
3.8%
Zip Codes with the Highest Percentage of Population Employed in Education, Arts & Media in San Jose, CA
| Zip Code | % Employed | vs State | vs National | |
| 1. | 95113 | 3.8% | 1.7%(+2.08)#90 | 1.8%(+2.01)#2,770 |
| 2. | 95135 | 2.0% | 1.7%(+0.242)#491 | 1.8%(+0.168)#9,911 |
| 3. | 95139 | 1.8% | 1.7%(+0.100)#576 | 1.8%(+0.027)#11,060 |
| 4. | 95112 | 1.8% | 1.7%(+0.044)#605 | 1.8%(-0.029)#11,498 |
| 5. | 95126 | 1.7% | 1.7%(-0.005)#642 | 1.8%(-0.078)#11,893 |
| 6. | 95127 | 1.7% | 1.7%(-0.046)#667 | 1.8%(-0.119)#12,237 |
| 7. | 95128 | 1.7% | 1.7%(-0.054)#670 | 1.8%(-0.127)#12,303 |
| 8. | 95122 | 1.6% | 1.7%(-0.080)#692 | 1.8%(-0.154)#12,562 |
| 9. | 95119 | 1.6% | 1.7%(-0.161)#746 | 1.8%(-0.235)#13,292 |
| 10. | 95121 | 1.5% | 1.7%(-0.226)#787 | 1.8%(-0.299)#13,944 |
| 11. | 95116 | 1.4% | 1.7%(-0.292)#829 | 1.8%(-0.365)#14,594 |
| 12. | 95133 | 1.4% | 1.7%(-0.331)#845 | 1.8%(-0.404)#14,935 |
| 13. | 95118 | 1.3% | 1.7%(-0.423)#910 | 1.8%(-0.497)#15,769 |
| 14. | 95117 | 1.3% | 1.7%(-0.434)#916 | 1.8%(-0.507)#15,868 |
| 15. | 95131 | 1.3% | 1.7%(-0.439)#922 | 1.8%(-0.513)#15,943 |
| 16. | 95123 | 1.2% | 1.7%(-0.467)#943 | 1.8%(-0.541)#16,229 |
| 17. | 95138 | 1.2% | 1.7%(-0.480)#953 | 1.8%(-0.554)#16,341 |
| 18. | 95136 | 1.2% | 1.7%(-0.482)#957 | 1.8%(-0.556)#16,362 |
| 19. | 95110 | 1.2% | 1.7%(-0.483)#958 | 1.8%(-0.556)#16,369 |
| 20. | 95125 | 1.1% | 1.7%(-0.590)#1,020 | 1.8%(-0.663)#17,379 |
| 21. | 95111 | 1.0% | 1.7%(-0.678)#1,074 | 1.8%(-0.751)#18,171 |
| 22. | 95120 | 1.0% | 1.7%(-0.710)#1,098 | 1.8%(-0.783)#18,506 |
| 23. | 95124 | 0.98% | 1.7%(-0.735)#1,111 | 1.8%(-0.808)#18,718 |
| 24. | 95148 | 0.97% | 1.7%(-0.744)#1,116 | 1.8%(-0.817)#18,800 |
| 25. | 95130 | 0.82% | 1.7%(-0.893)#1,185 | 1.8%(-0.966)#20,087 |
| 26. | 95129 | 0.69% | 1.7%(-1.03)#1,231 | 1.8%(-1.10)#21,063 |
| 27. | 95132 | 0.47% | 1.7%(-1.24)#1,292 | 1.8%(-1.32)#22,532 |
| 28. | 95134 | 0.14% | 1.7%(-1.58)#1,344 | 1.8%(-1.65)#24,062 |
1
Common Questions
What are the Top 10 Zip Codes with the Highest Percentage of Population Employed in Education, Arts & Media in San Jose, CA?
Top 10 Zip Codes with the Highest Percentage of Population Employed in Education, Arts & Media in San Jose, CA are:
What zip code has the Highest Percentage of Population Employed in Education, Arts & Media in San Jose, CA?
95113 has the Highest Percentage of Population Employed in Education, Arts & Media in San Jose, CA with 3.8%.
What is the Percentage of Population Employed in Education, Arts & Media in San Jose, CA?
Percentage of Population Employed in Education, Arts & Media in San Jose is 1.2%.
What is the Percentage of Population Employed in Education, Arts & Media in California?
Percentage of Population Employed in Education, Arts & Media in California is 1.7%.
What is the Percentage of Population Employed in Education, Arts & Media in the United States?
Percentage of Population Employed in Education, Arts & Media in the United States is 1.8%.