Zip Codes with the Highest Percentage of Population with a Degree in Computers and Mathematics in Mobile, AL
RELATED REPORTS & OPTIONS
Computers and Mathematics
Mobile
Compare Zip Codes
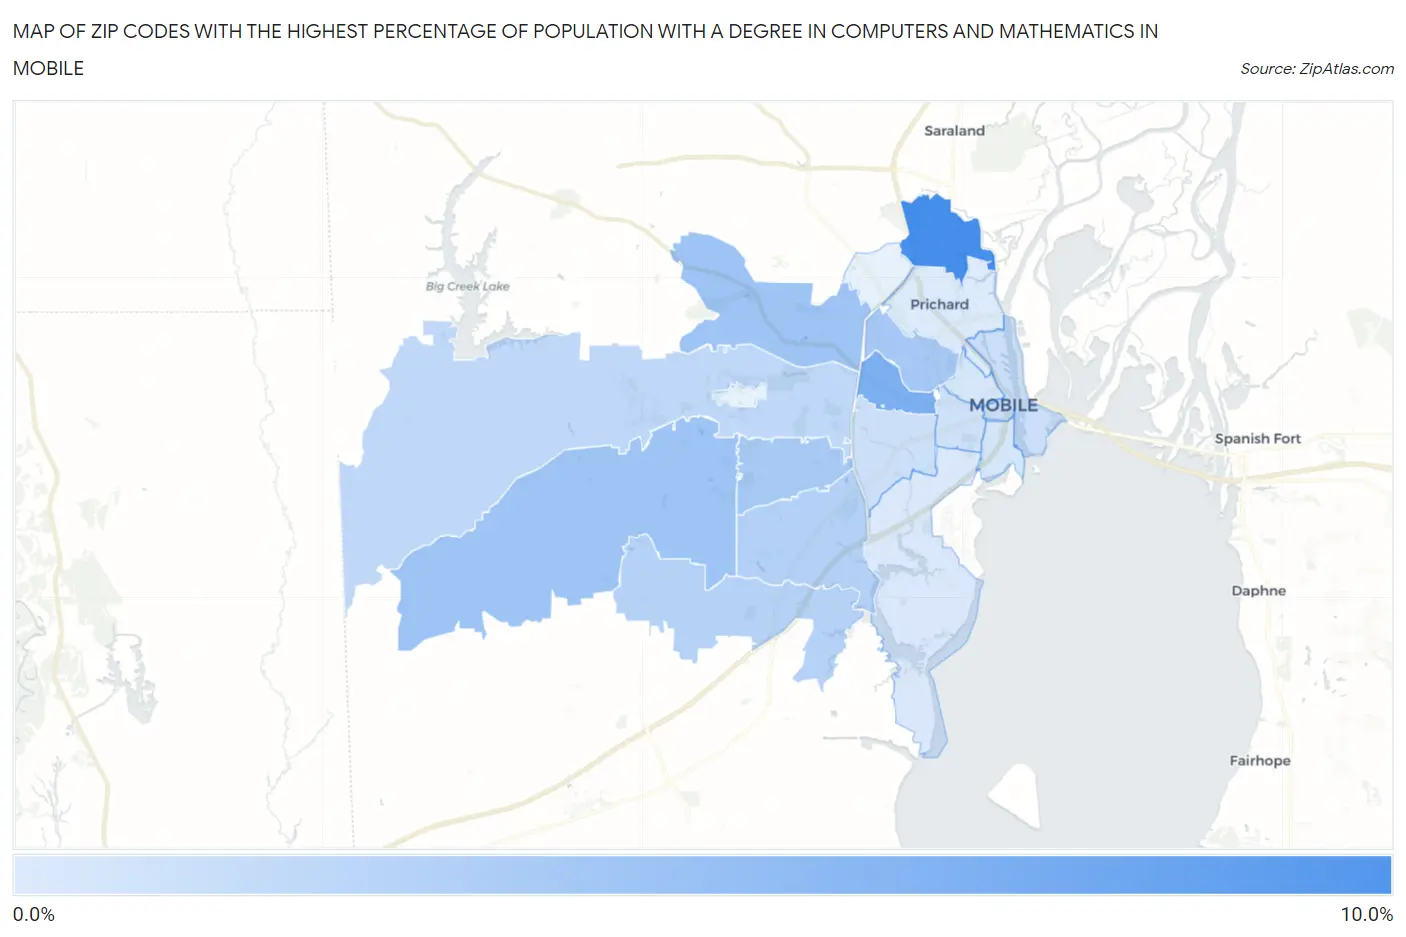
Map of Zip Codes with the Highest Percentage of Population with a Degree in Computers and Mathematics in Mobile
1.2%
8.6%
Zip Codes with the Highest Percentage of Population with a Degree in Computers and Mathematics in Mobile, AL
| Zip Code | % Graduates | vs State | vs National | |
| 1. | 36611 | 8.6% | 4.4%(+4.17)#56 | 4.9%(+3.66)#2,509 |
| 2. | 36607 | 5.9% | 4.4%(+1.54)#109 | 4.9%(+1.02)#5,454 |
| 3. | 36695 | 4.2% | 4.4%(-0.220)#178 | 4.9%(-0.736)#9,964 |
| 4. | 36618 | 4.1% | 4.4%(-0.237)#179 | 4.9%(-0.753)#10,025 |
| 5. | 36617 | 3.9% | 4.4%(-0.522)#190 | 4.9%(-1.04)#10,963 |
| 6. | 36609 | 3.7% | 4.4%(-0.666)#201 | 4.9%(-1.18)#11,493 |
| 7. | 36693 | 3.1% | 4.4%(-1.24)#233 | 4.9%(-1.75)#13,573 |
| 8. | 36619 | 3.0% | 4.4%(-1.33)#244 | 4.9%(-1.85)#13,921 |
| 9. | 36608 | 2.6% | 4.4%(-1.74)#272 | 4.9%(-2.26)#15,394 |
| 10. | 36602 | 2.0% | 4.4%(-2.37)#307 | 4.9%(-2.89)#17,613 |
| 11. | 36606 | 2.0% | 4.4%(-2.40)#311 | 4.9%(-2.92)#17,698 |
| 12. | 36604 | 1.8% | 4.4%(-2.59)#320 | 4.9%(-3.10)#18,271 |
| 13. | 36603 | 1.5% | 4.4%(-2.84)#338 | 4.9%(-3.36)#19,040 |
| 14. | 36605 | 1.2% | 4.4%(-3.13)#355 | 4.9%(-3.65)#19,874 |
| 15. | 36610 | 1.2% | 4.4%(-3.20)#361 | 4.9%(-3.71)#20,048 |
1
Common Questions
What are the Top 10 Zip Codes with the Highest Percentage of Population with a Degree in Computers and Mathematics in Mobile, AL?
Top 10 Zip Codes with the Highest Percentage of Population with a Degree in Computers and Mathematics in Mobile, AL are:
What zip code has the Highest Percentage of Population with a Degree in Computers and Mathematics in Mobile, AL?
36611 has the Highest Percentage of Population with a Degree in Computers and Mathematics in Mobile, AL with 8.6%.
What is the Percentage of Population with a Degree in Computers and Mathematics in Mobile, AL?
Percentage of Population with a Degree in Computers and Mathematics in Mobile is 2.9%.
What is the Percentage of Population with a Degree in Computers and Mathematics in Alabama?
Percentage of Population with a Degree in Computers and Mathematics in Alabama is 4.4%.
What is the Percentage of Population with a Degree in Computers and Mathematics in the United States?
Percentage of Population with a Degree in Computers and Mathematics in the United States is 4.9%.