Zip Codes with the Highest Percentage of Population Employed in Computer & Mathematics in Mobile, AL
RELATED REPORTS & OPTIONS
Computer & Mathematics
Mobile
Compare Zip Codes
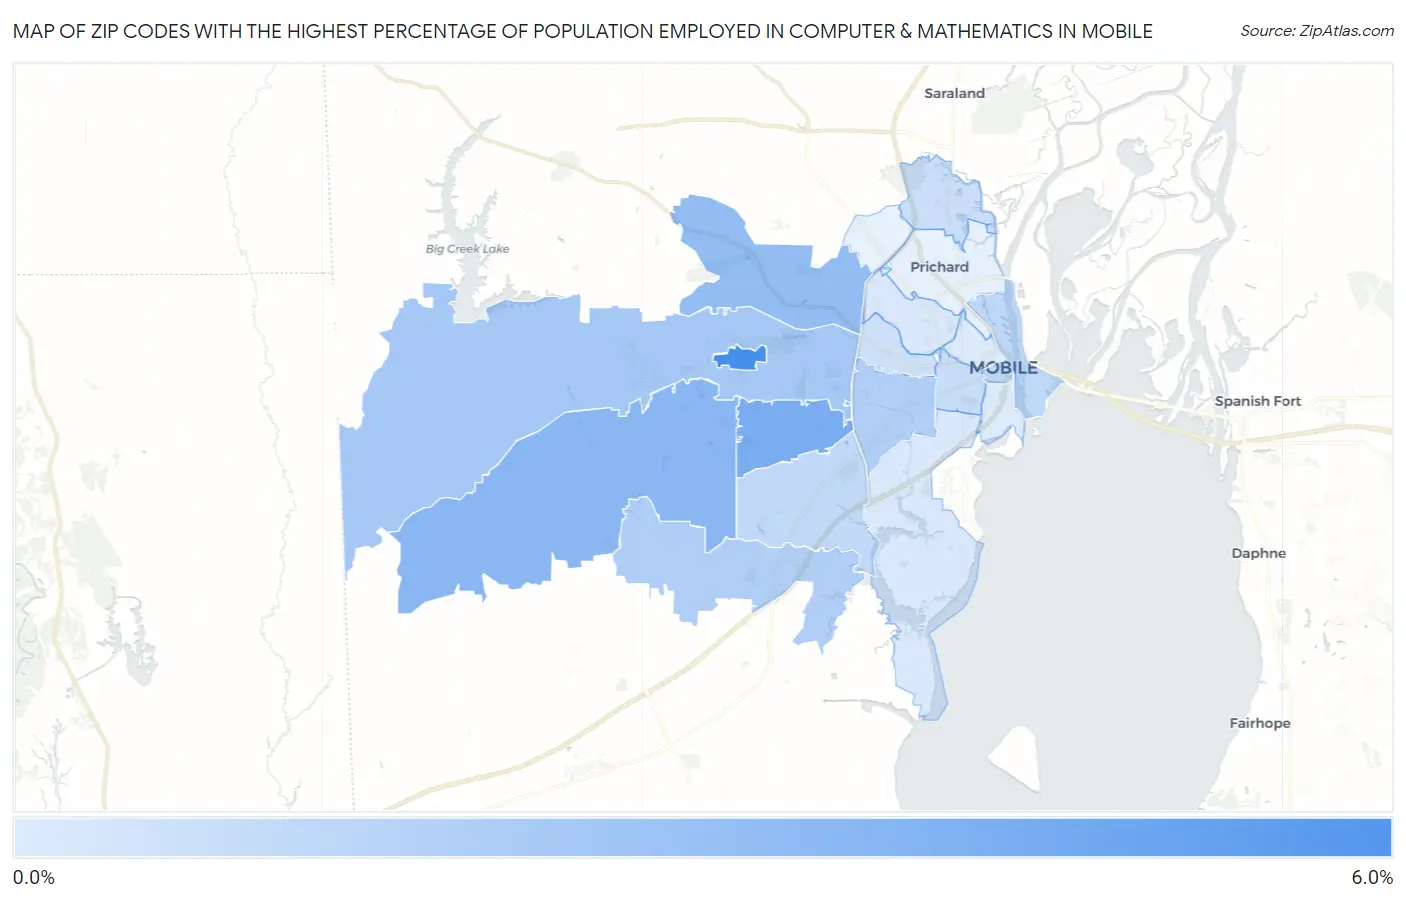
Map of Zip Codes with the Highest Percentage of Population Employed in Computer & Mathematics in Mobile
0.30%
5.3%
Zip Codes with the Highest Percentage of Population Employed in Computer & Mathematics in Mobile, AL
| Zip Code | % Employed | vs State | vs National | |
| 1. | 36688 | 5.3% | 2.5%(+2.77)#44 | 3.5%(+1.79)#2,988 |
| 2. | 36609 | 3.6% | 2.5%(+1.04)#79 | 3.5%(+0.062)#5,980 |
| 3. | 36695 | 3.0% | 2.5%(+0.474)#105 | 3.5%(-0.507)#7,676 |
| 4. | 36618 | 2.7% | 2.5%(+0.178)#117 | 3.5%(-0.803)#8,740 |
| 5. | 36608 | 2.1% | 2.5%(-0.402)#157 | 3.5%(-1.38)#11,162 |
| 6. | 36619 | 1.7% | 2.5%(-0.805)#198 | 3.5%(-1.79)#13,035 |
| 7. | 36606 | 1.7% | 2.5%(-0.824)#199 | 3.5%(-1.80)#13,127 |
| 8. | 36602 | 1.3% | 2.5%(-1.28)#258 | 3.5%(-2.26)#15,760 |
| 9. | 36693 | 1.2% | 2.5%(-1.35)#267 | 3.5%(-2.33)#16,146 |
| 10. | 36604 | 0.98% | 2.5%(-1.56)#292 | 3.5%(-2.54)#17,479 |
| 11. | 36611 | 0.88% | 2.5%(-1.66)#301 | 3.5%(-2.64)#18,147 |
| 12. | 36607 | 0.78% | 2.5%(-1.77)#312 | 3.5%(-2.75)#18,772 |
| 13. | 36605 | 0.41% | 2.5%(-2.13)#373 | 3.5%(-3.11)#20,996 |
| 14. | 36617 | 0.37% | 2.5%(-2.17)#379 | 3.5%(-3.15)#21,225 |
| 15. | 36603 | 0.30% | 2.5%(-2.24)#395 | 3.5%(-3.22)#21,597 |
1
Common Questions
What are the Top 10 Zip Codes with the Highest Percentage of Population Employed in Computer & Mathematics in Mobile, AL?
Top 10 Zip Codes with the Highest Percentage of Population Employed in Computer & Mathematics in Mobile, AL are:
What zip code has the Highest Percentage of Population Employed in Computer & Mathematics in Mobile, AL?
36688 has the Highest Percentage of Population Employed in Computer & Mathematics in Mobile, AL with 5.3%.
What is the Percentage of Population Employed in Computer & Mathematics in Mobile, AL?
Percentage of Population Employed in Computer & Mathematics in Mobile is 1.9%.
What is the Percentage of Population Employed in Computer & Mathematics in Alabama?
Percentage of Population Employed in Computer & Mathematics in Alabama is 2.5%.
What is the Percentage of Population Employed in Computer & Mathematics in the United States?
Percentage of Population Employed in Computer & Mathematics in the United States is 3.5%.