Zip Codes with the Largest Hispanic or Latino Community in Mobile, AL
RELATED REPORTS & OPTIONS
Hispanic or Latino
Mobile
Compare Zip Codes
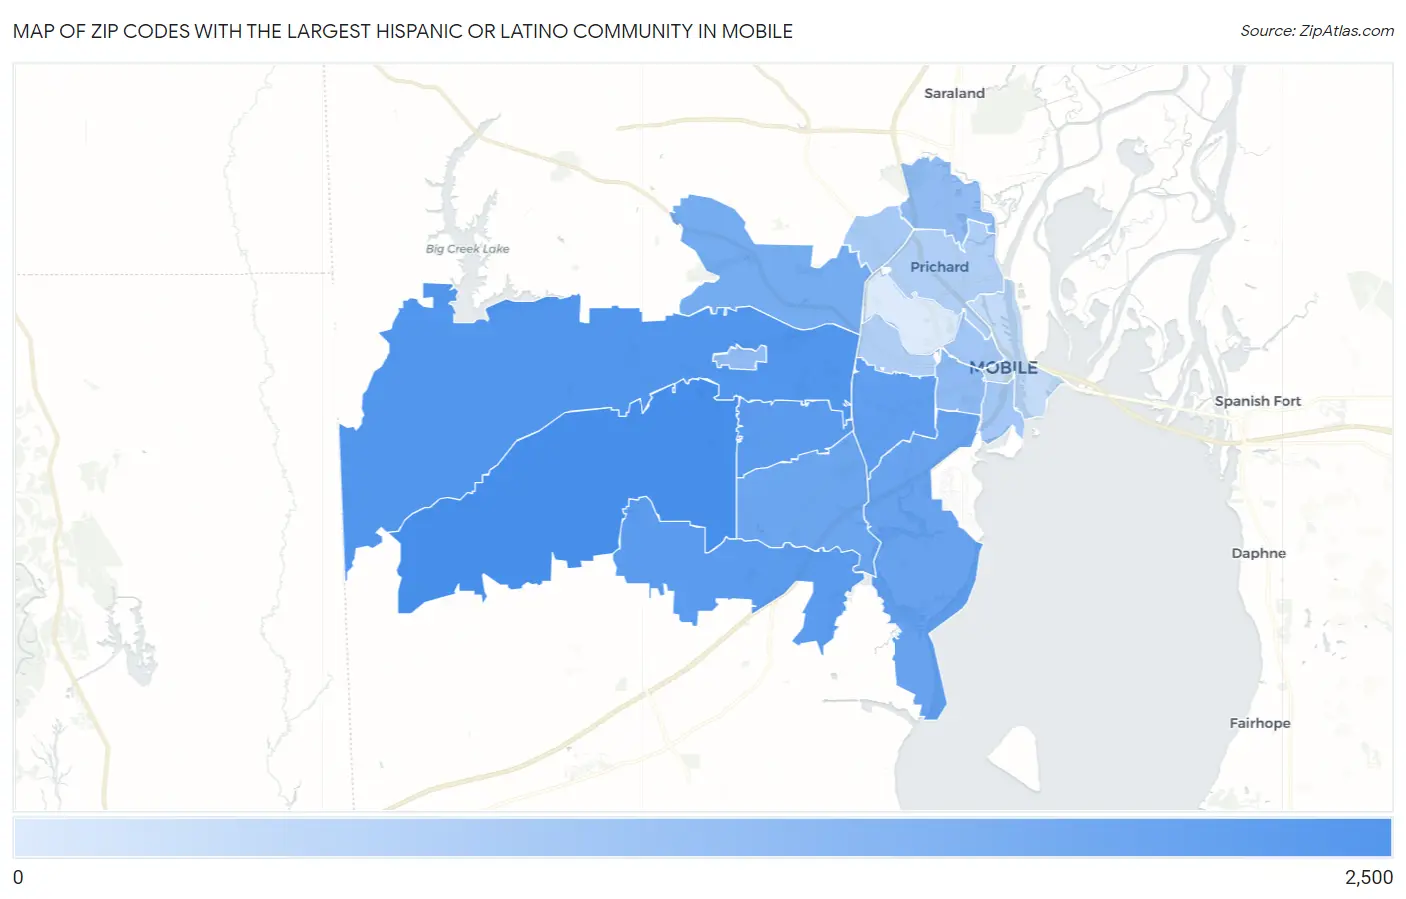
Map of Zip Codes with the Largest Hispanic or Latino Community in Mobile
9
2,127
Zip Codes with the Largest Hispanic or Latino Community in Mobile, AL
| Zip Code | Hispanic or Latino | vs State | vs National | |
| 1. | 36695 | 2,127 | 232,407(0.92%)#20 | 61,755,866(0.00%)#5,597 |
| 2. | 36608 | 1,433 | 232,407(0.62%)#45 | 61,755,866(0.00%)#6,926 |
| 3. | 36619 | 1,087 | 232,407(0.47%)#64 | 61,755,866(0.00%)#7,877 |
| 4. | 36609 | 984 | 232,407(0.42%)#73 | 61,755,866(0.00%)#8,249 |
| 5. | 36606 | 882 | 232,407(0.38%)#83 | 61,755,866(0.00%)#8,677 |
| 6. | 36605 | 675 | 232,407(0.29%)#110 | 61,755,866(0.00%)#9,663 |
| 7. | 36693 | 567 | 232,407(0.24%)#125 | 61,755,866(0.00%)#10,275 |
| 8. | 36618 | 419 | 232,407(0.18%)#153 | 61,755,866(0.00%)#11,326 |
| 9. | 36604 | 160 | 232,407(0.07%)#252 | 61,755,866(0.00%)#15,008 |
| 10. | 36688 | 155 | 232,407(0.07%)#256 | 61,755,866(0.00%)#15,155 |
| 11. | 36611 | 148 | 232,407(0.06%)#262 | 61,755,866(0.00%)#15,313 |
| 12. | 36603 | 75 | 232,407(0.03%)#336 | 61,755,866(0.00%)#17,930 |
| 13. | 36612 | 65 | 232,407(0.03%)#347 | 61,755,866(0.00%)#18,490 |
| 14. | 36607 | 48 | 232,407(0.02%)#367 | 61,755,866(0.00%)#19,655 |
| 15. | 36610 | 45 | 232,407(0.02%)#371 | 61,755,866(0.00%)#19,896 |
| 16. | 36602 | 23 | 232,407(0.01%)#410 | 61,755,866(0.00%)#22,383 |
| 17. | 36617 | 9 | 232,407(0.00%)#446 | 61,755,866(0.00%)#24,625 |
1
Common Questions
What are the Top 10 Zip Codes with the Largest Hispanic or Latino Community in Mobile, AL?
Top 10 Zip Codes with the Largest Hispanic or Latino Community in Mobile, AL are:
What zip code has the Largest Hispanic or Latino Community in Mobile, AL?
36695 has the Largest Hispanic or Latino Community in Mobile, AL with 2,127.
What is the Total Hispanic or Latino Population in Mobile, AL?
Total Hispanic or Latino Population in Mobile is 5,267.
What is the Total Hispanic or Latino Population in Alabama?
Total Hispanic or Latino Population in Alabama is 232,407.
What is the Total Hispanic or Latino Population in the United States?
Total Hispanic or Latino Population in the United States is 61,755,866.