Zip Codes with the Lowest Percentage of Owner-Occupied Units in Mobile, AL
RELATED REPORTS & OPTIONS
Lowest Owner-Occupied
Mobile
Compare Zip Codes
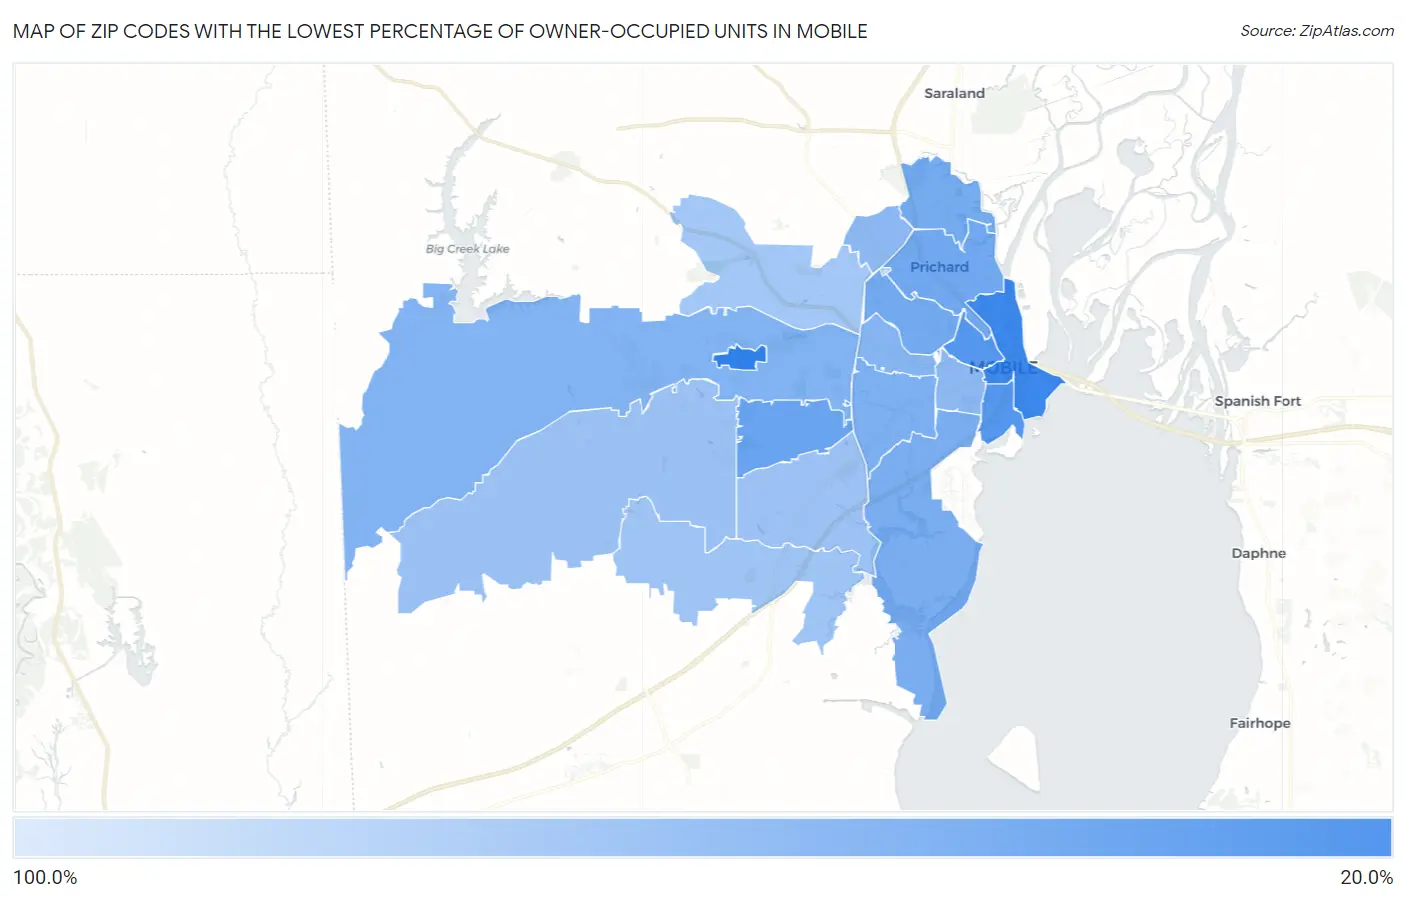
Map of Zip Codes with the Lowest Percentage of Owner-Occupied Units in Mobile
100.0%
21.6%
Zip Codes with the Lowest Percentage of Owner-Occupied Units in Mobile, AL
| Zip Code | % Owner-Occupied | vs State | vs National | |
| 1. | 36602 | 21.6% | 69.7%(-48.1)#5 | 64.8%(-43.2)#429 |
| 2. | 36603 | 31.9% | 69.7%(-37.8)#14 | 64.8%(-32.9)#873 |
| 3. | 36609 | 42.2% | 69.7%(-27.5)#23 | 64.8%(-22.6)#1,720 |
| 4. | 36610 | 45.5% | 69.7%(-24.2)#28 | 64.8%(-19.3)#2,112 |
| 5. | 36617 | 46.1% | 69.7%(-23.6)#31 | 64.8%(-18.7)#2,194 |
| 6. | 36611 | 47.7% | 69.7%(-22.1)#37 | 64.8%(-17.1)#2,425 |
| 7. | 36605 | 49.8% | 69.7%(-19.9)#41 | 64.8%(-15.0)#2,751 |
| 8. | 36606 | 50.3% | 69.7%(-19.4)#42 | 64.8%(-14.5)#2,855 |
| 9. | 36608 | 52.6% | 69.7%(-17.1)#49 | 64.8%(-12.2)#3,266 |
| 10. | 36607 | 55.6% | 69.7%(-14.1)#60 | 64.8%(-9.21)#3,924 |
| 11. | 36604 | 58.7% | 69.7%(-11.0)#71 | 64.8%(-6.13)#4,715 |
| 12. | 36612 | 58.9% | 69.7%(-10.8)#74 | 64.8%(-5.87)#4,795 |
| 13. | 36695 | 66.6% | 69.7%(-3.11)#132 | 64.8%(+1.79)#7,806 |
| 14. | 36693 | 68.3% | 69.7%(-1.44)#155 | 64.8%(+3.46)#8,711 |
| 15. | 36619 | 69.4% | 69.7%(-0.308)#166 | 64.8%(+4.60)#9,375 |
| 16. | 36618 | 72.0% | 69.7%(+2.29)#199 | 64.8%(+7.19)#11,104 |
| 17. | 36663 | 100.0% | 69.7%(+30.3)#606 | 64.8%(+35.2)#31,716 |
1
Common Questions
What are the Top 10 Zip Codes with the Lowest Percentage of Owner-Occupied Units in Mobile, AL?
Top 10 Zip Codes with the Lowest Percentage of Owner-Occupied Units in Mobile, AL are:
What zip code has the Lowest Percentage of Owner-Occupied Units in Mobile, AL?
36602 has the Lowest Percentage of Owner-Occupied Units in Mobile, AL with 21.6%.
What is the Percentage of Owner-Occupied Units in Mobile, AL?
Percentage of Owner-Occupied Units in Mobile is 50.6%.
What is the Percentage of Owner-Occupied Units in Alabama?
Percentage of Owner-Occupied Units in Alabama is 69.7%.
What is the Percentage of Owner-Occupied Units in the United States?
Percentage of Owner-Occupied Units in the United States is 64.8%.