Zip Codes with the Highest Percentage of Population Employed in Business & Financial in Mobile, AL
RELATED REPORTS & OPTIONS
Business & Financial
Mobile
Compare Zip Codes
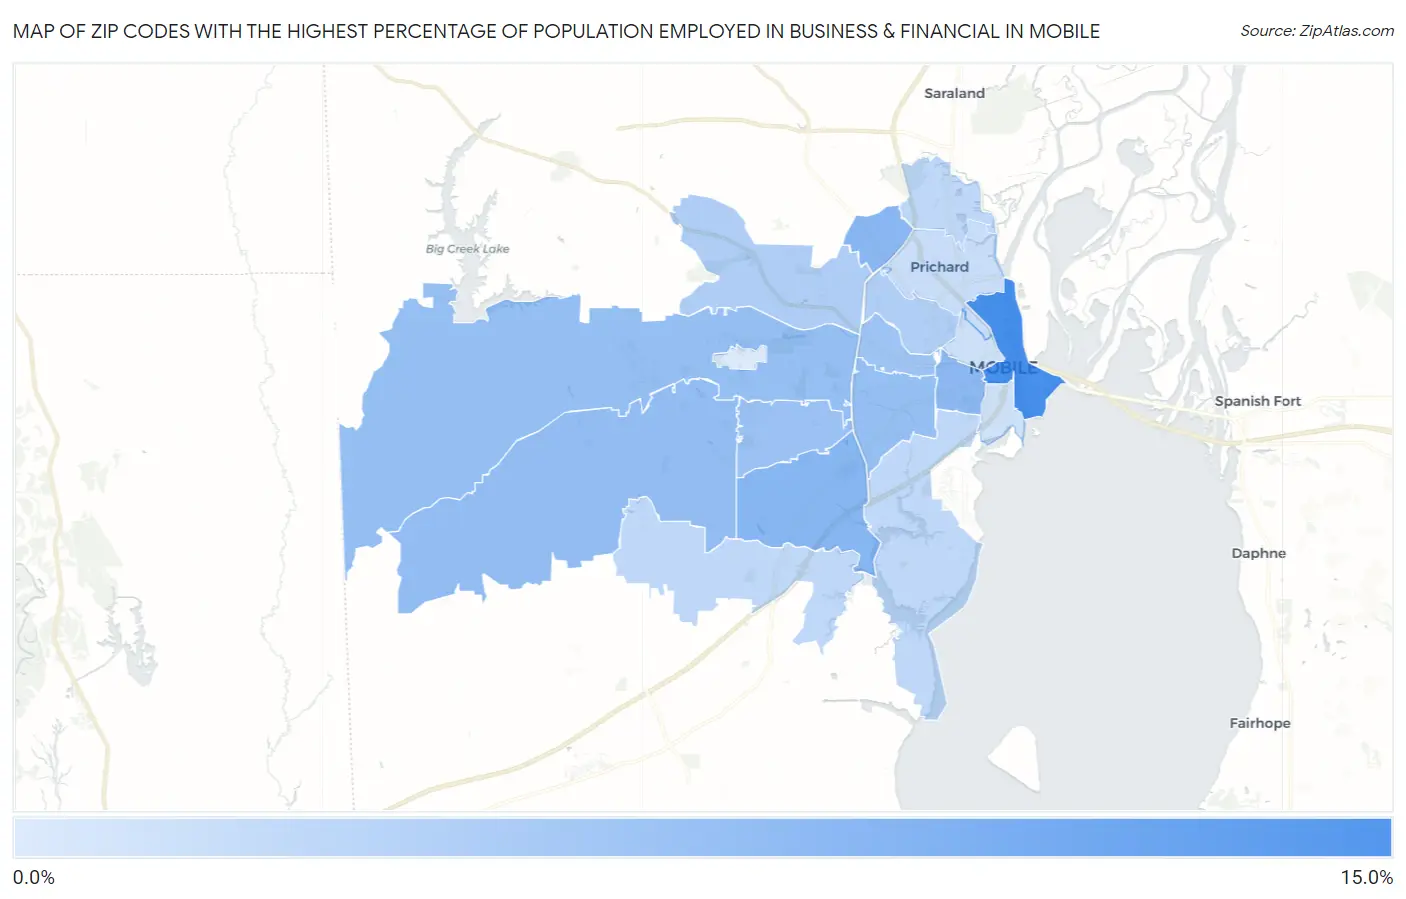
Map of Zip Codes with the Highest Percentage of Population Employed in Business & Financial in Mobile
0.17%
11.1%
Zip Codes with the Highest Percentage of Population Employed in Business & Financial in Mobile, AL
| Zip Code | % Employed | vs State | vs National | |
| 1. | 36602 | 11.1% | 4.5%(+6.61)#15 | 5.8%(+5.35)#1,591 |
| 2. | 36693 | 6.3% | 4.5%(+1.75)#81 | 5.8%(+0.490)#7,249 |
| 3. | 36612 | 6.2% | 4.5%(+1.67)#84 | 5.8%(+0.409)#7,438 |
| 4. | 36604 | 5.9% | 4.5%(+1.43)#89 | 5.8%(+0.169)#7,990 |
| 5. | 36695 | 5.5% | 4.5%(+0.991)#112 | 5.8%(-0.268)#9,048 |
| 6. | 36606 | 5.3% | 4.5%(+0.779)#126 | 5.8%(-0.480)#9,627 |
| 7. | 36608 | 5.3% | 4.5%(+0.753)#128 | 5.8%(-0.506)#9,696 |
| 8. | 36609 | 4.8% | 4.5%(+0.341)#146 | 5.8%(-0.918)#10,917 |
| 9. | 36607 | 4.5% | 4.5%(+0.031)#170 | 5.8%(-1.23)#11,974 |
| 10. | 36618 | 3.4% | 4.5%(-1.07)#243 | 5.8%(-2.33)#16,104 |
| 11. | 36617 | 3.2% | 4.5%(-1.34)#267 | 5.8%(-2.60)#17,169 |
| 12. | 36611 | 2.3% | 4.5%(-2.23)#350 | 5.8%(-3.49)#20,728 |
| 13. | 36619 | 2.3% | 4.5%(-2.24)#353 | 5.8%(-3.50)#20,795 |
| 14. | 36605 | 2.2% | 4.5%(-2.28)#360 | 5.8%(-3.54)#20,938 |
| 15. | 36610 | 1.5% | 4.5%(-2.97)#418 | 5.8%(-4.23)#23,417 |
| 16. | 36603 | 1.1% | 4.5%(-3.44)#458 | 5.8%(-4.70)#24,865 |
| 17. | 36688 | 0.17% | 4.5%(-4.34)#519 | 5.8%(-5.60)#26,703 |
1
Common Questions
What are the Top 10 Zip Codes with the Highest Percentage of Population Employed in Business & Financial in Mobile, AL?
Top 10 Zip Codes with the Highest Percentage of Population Employed in Business & Financial in Mobile, AL are:
What zip code has the Highest Percentage of Population Employed in Business & Financial in Mobile, AL?
36602 has the Highest Percentage of Population Employed in Business & Financial in Mobile, AL with 11.1%.
What is the Percentage of Population Employed in Business & Financial in Mobile, AL?
Percentage of Population Employed in Business & Financial in Mobile is 4.8%.
What is the Percentage of Population Employed in Business & Financial in Alabama?
Percentage of Population Employed in Business & Financial in Alabama is 4.5%.
What is the Percentage of Population Employed in Business & Financial in the United States?
Percentage of Population Employed in Business & Financial in the United States is 5.8%.