Zip Codes with the Highest Percentage of Families with Income Below $10,000 in Mobile, AL
RELATED REPORTS & OPTIONS
Family Income | $0-10k
Mobile
Compare Zip Codes
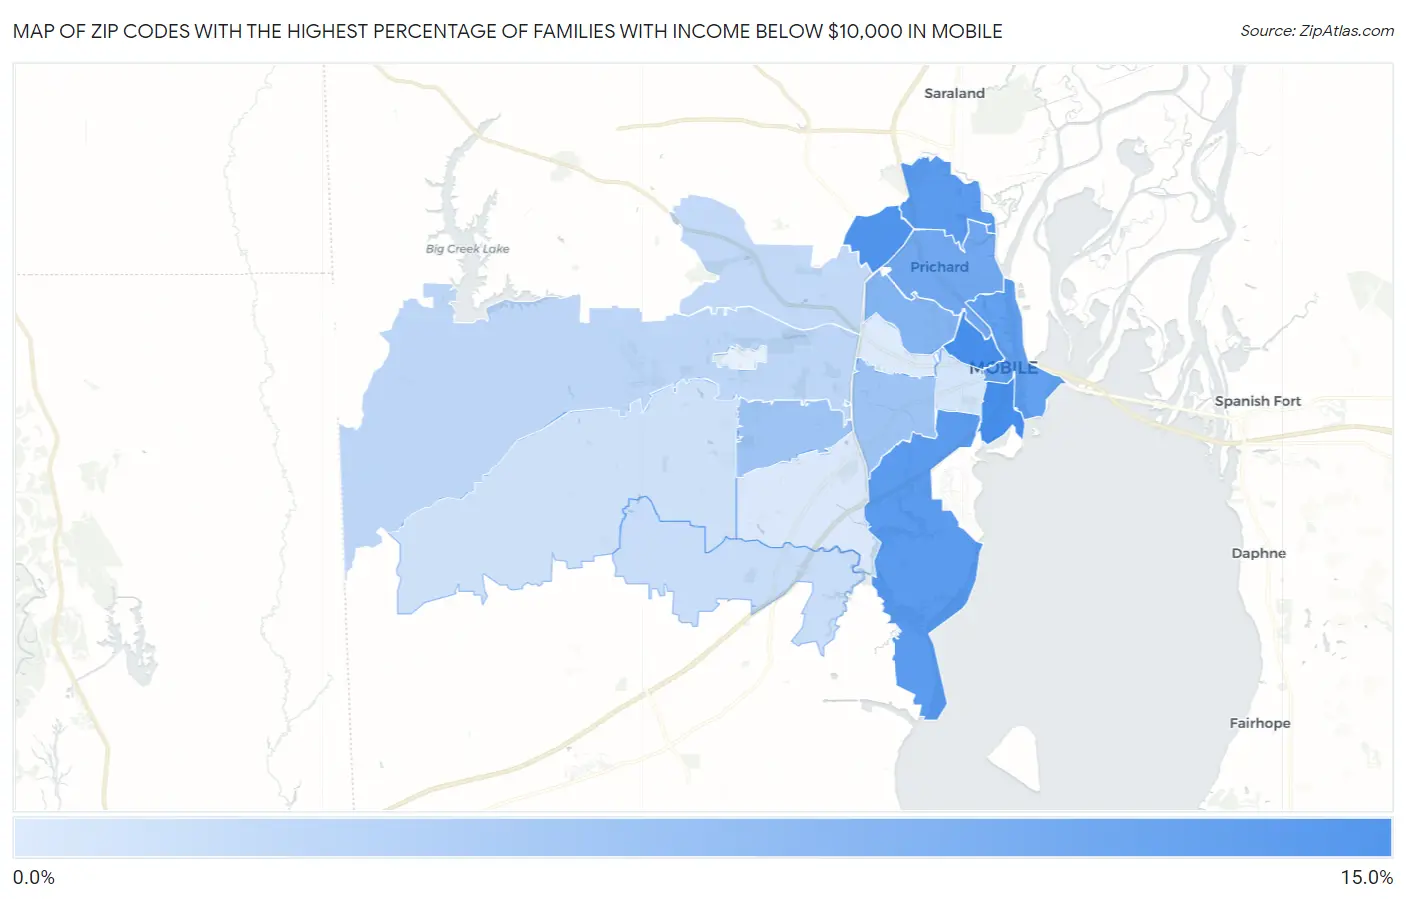
Map of Zip Codes with the Highest Percentage of Families with Income Below $10,000 in Mobile
1.3%
11.9%
Zip Codes with the Highest Percentage of Families with Income Below $10,000 in Mobile, AL
| Zip Code | Families with Income < $10k | vs State | vs National | |
| 1. | 36603 | 11.9% | 3.9%(+8.00)#32 | 3.1%(+8.80)#1,346 |
| 2. | 36612 | 11.3% | 3.9%(+7.40)#43 | 3.1%(+8.20)#1,509 |
| 3. | 36611 | 10.6% | 3.9%(+6.70)#46 | 3.1%(+7.50)#1,706 |
| 4. | 36605 | 10.5% | 3.9%(+6.60)#48 | 3.1%(+7.40)#1,735 |
| 5. | 36602 | 9.8% | 3.9%(+5.90)#64 | 3.1%(+6.70)#2,015 |
| 6. | 36610 | 8.8% | 3.9%(+4.90)#82 | 3.1%(+5.70)#2,464 |
| 7. | 36617 | 7.6% | 3.9%(+3.70)#107 | 3.1%(+4.50)#3,217 |
| 8. | 36609 | 5.5% | 3.9%(+1.60)#164 | 3.1%(+2.40)#5,319 |
| 9. | 36606 | 5.5% | 3.9%(+1.60)#165 | 3.1%(+2.40)#5,329 |
| 10. | 36608 | 3.5% | 3.9%(-0.400)#278 | 3.1%(+0.400)#9,502 |
| 11. | 36618 | 3.2% | 3.9%(-0.700)#297 | 3.1%(+0.100)#10,513 |
| 12. | 36619 | 2.7% | 3.9%(-1.20)#335 | 3.1%(-0.400)#12,364 |
| 13. | 36695 | 2.2% | 3.9%(-1.70)#381 | 3.1%(-0.900)#14,323 |
| 14. | 36604 | 1.9% | 3.9%(-2.00)#406 | 3.1%(-1.20)#15,918 |
| 15. | 36693 | 1.5% | 3.9%(-2.40)#429 | 3.1%(-1.60)#17,815 |
| 16. | 36607 | 1.3% | 3.9%(-2.60)#448 | 3.1%(-1.80)#18,950 |
1
Common Questions
What are the Top 10 Zip Codes with the Highest Percentage of Families with Income Below $10,000 in Mobile, AL?
Top 10 Zip Codes with the Highest Percentage of Families with Income Below $10,000 in Mobile, AL are:
What zip code has the Highest Percentage of Families with Income Below $10,000 in Mobile, AL?
36603 has the Highest Percentage of Families with Income Below $10,000 in Mobile, AL with 11.9%.
What is the Percentage of Families with Income Below $10,000 in Mobile, AL?
Percentage of Families with Income Below $10,000 in Mobile is 5.0%.
What is the Percentage of Families with Income Below $10,000 in Alabama?
Percentage of Families with Income Below $10,000 in Alabama is 3.9%.
What is the Percentage of Families with Income Below $10,000 in the United States?
Percentage of Families with Income Below $10,000 in the United States is 3.1%.