Zip Codes with the Highest Percentage of Population Employed in Community & Social Service in Mobile, AL
RELATED REPORTS & OPTIONS
Community & Social Service
Mobile
Compare Zip Codes
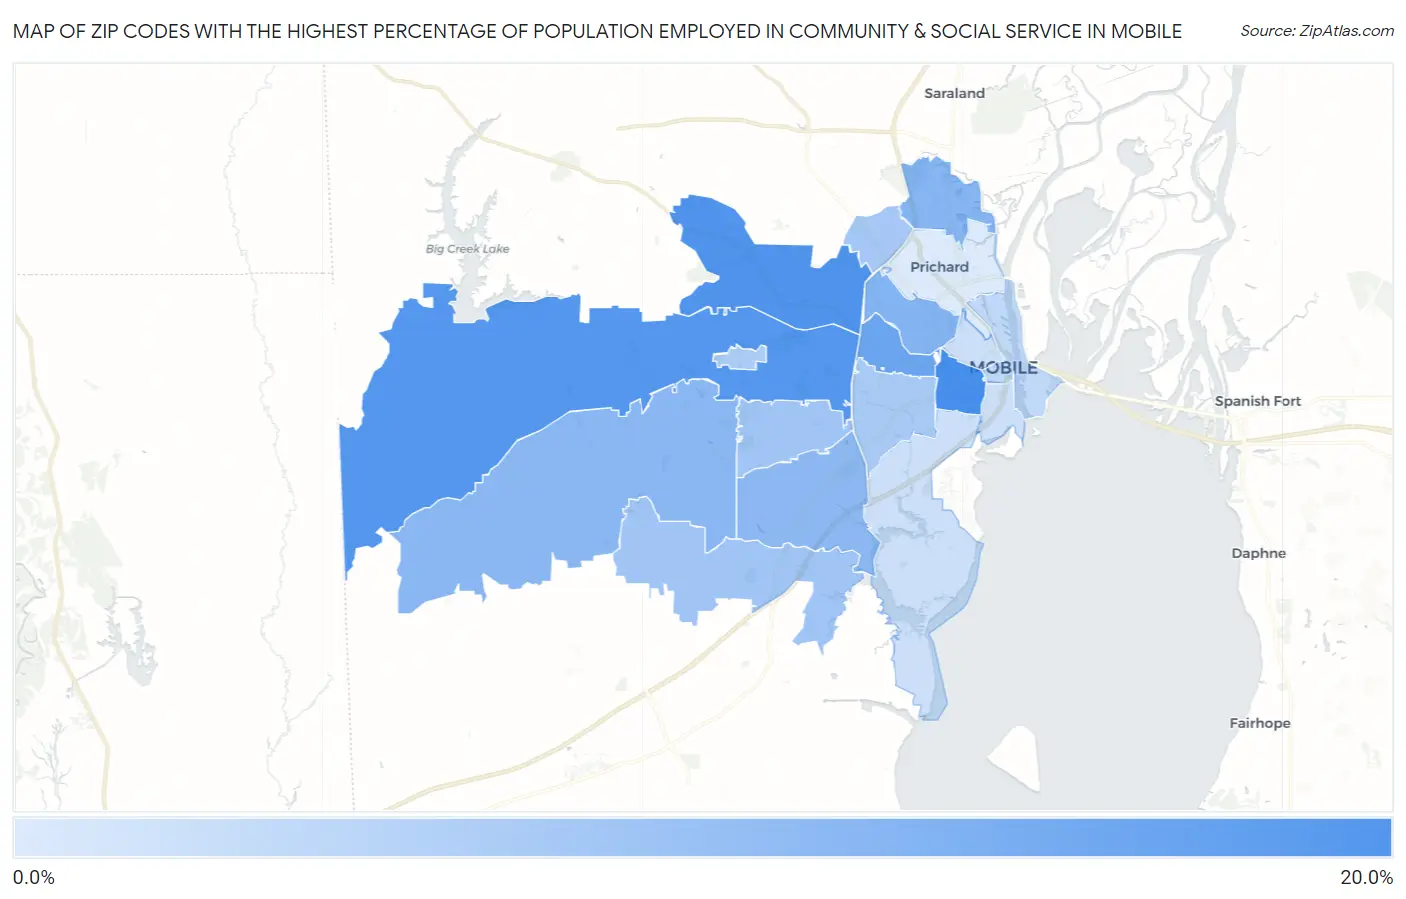
Map of Zip Codes with the Highest Percentage of Population Employed in Community & Social Service in Mobile
4.3%
16.4%
Zip Codes with the Highest Percentage of Population Employed in Community & Social Service in Mobile, AL
| Zip Code | % Employed | vs State | vs National | |
| 1. | 36604 | 16.4% | 10.1%(+6.36)#39 | 11.2%(+5.20)#3,752 |
| 2. | 36618 | 15.6% | 10.1%(+5.56)#48 | 11.2%(+4.40)#4,409 |
| 3. | 36608 | 15.2% | 10.1%(+5.17)#53 | 11.2%(+4.01)#4,776 |
| 4. | 36607 | 13.2% | 10.1%(+3.18)#84 | 11.2%(+2.02)#7,174 |
| 5. | 36617 | 11.4% | 10.1%(+1.38)#141 | 11.2%(+0.219)#10,593 |
| 6. | 36611 | 11.3% | 10.1%(+1.21)#150 | 11.2%(+0.048)#10,984 |
| 7. | 36695 | 10.9% | 10.1%(+0.842)#170 | 11.2%(-0.320)#11,909 |
| 8. | 36693 | 10.6% | 10.1%(+0.593)#178 | 11.2%(-0.569)#12,520 |
| 9. | 36619 | 8.9% | 10.1%(-1.14)#247 | 11.2%(-2.30)#17,044 |
| 10. | 36609 | 8.9% | 10.1%(-1.15)#249 | 11.2%(-2.31)#17,089 |
| 11. | 36612 | 8.6% | 10.1%(-1.47)#262 | 11.2%(-2.64)#17,961 |
| 12. | 36606 | 8.3% | 10.1%(-1.72)#276 | 11.2%(-2.88)#18,640 |
| 13. | 36688 | 8.0% | 10.1%(-2.08)#305 | 11.2%(-3.24)#19,631 |
| 14. | 36602 | 6.6% | 10.1%(-3.49)#398 | 11.2%(-4.65)#23,108 |
| 15. | 36603 | 5.6% | 10.1%(-4.47)#447 | 11.2%(-5.63)#25,185 |
| 16. | 36605 | 5.6% | 10.1%(-4.50)#450 | 11.2%(-5.66)#25,249 |
| 17. | 36610 | 4.3% | 10.1%(-5.77)#496 | 11.2%(-6.93)#27,205 |
1
Common Questions
What are the Top 10 Zip Codes with the Highest Percentage of Population Employed in Community & Social Service in Mobile, AL?
Top 10 Zip Codes with the Highest Percentage of Population Employed in Community & Social Service in Mobile, AL are:
What zip code has the Highest Percentage of Population Employed in Community & Social Service in Mobile, AL?
36604 has the Highest Percentage of Population Employed in Community & Social Service in Mobile, AL with 16.4%.
What is the Percentage of Population Employed in Community & Social Service in Mobile, AL?
Percentage of Population Employed in Community & Social Service in Mobile is 11.3%.
What is the Percentage of Population Employed in Community & Social Service in Alabama?
Percentage of Population Employed in Community & Social Service in Alabama is 10.1%.
What is the Percentage of Population Employed in Community & Social Service in the United States?
Percentage of Population Employed in Community & Social Service in the United States is 11.2%.