Zip Codes with the Highest Percentage of Population with a Degree in Liberal Arts and History in Mobile, AL
RELATED REPORTS & OPTIONS
Liberal Arts and History
Mobile
Compare Zip Codes
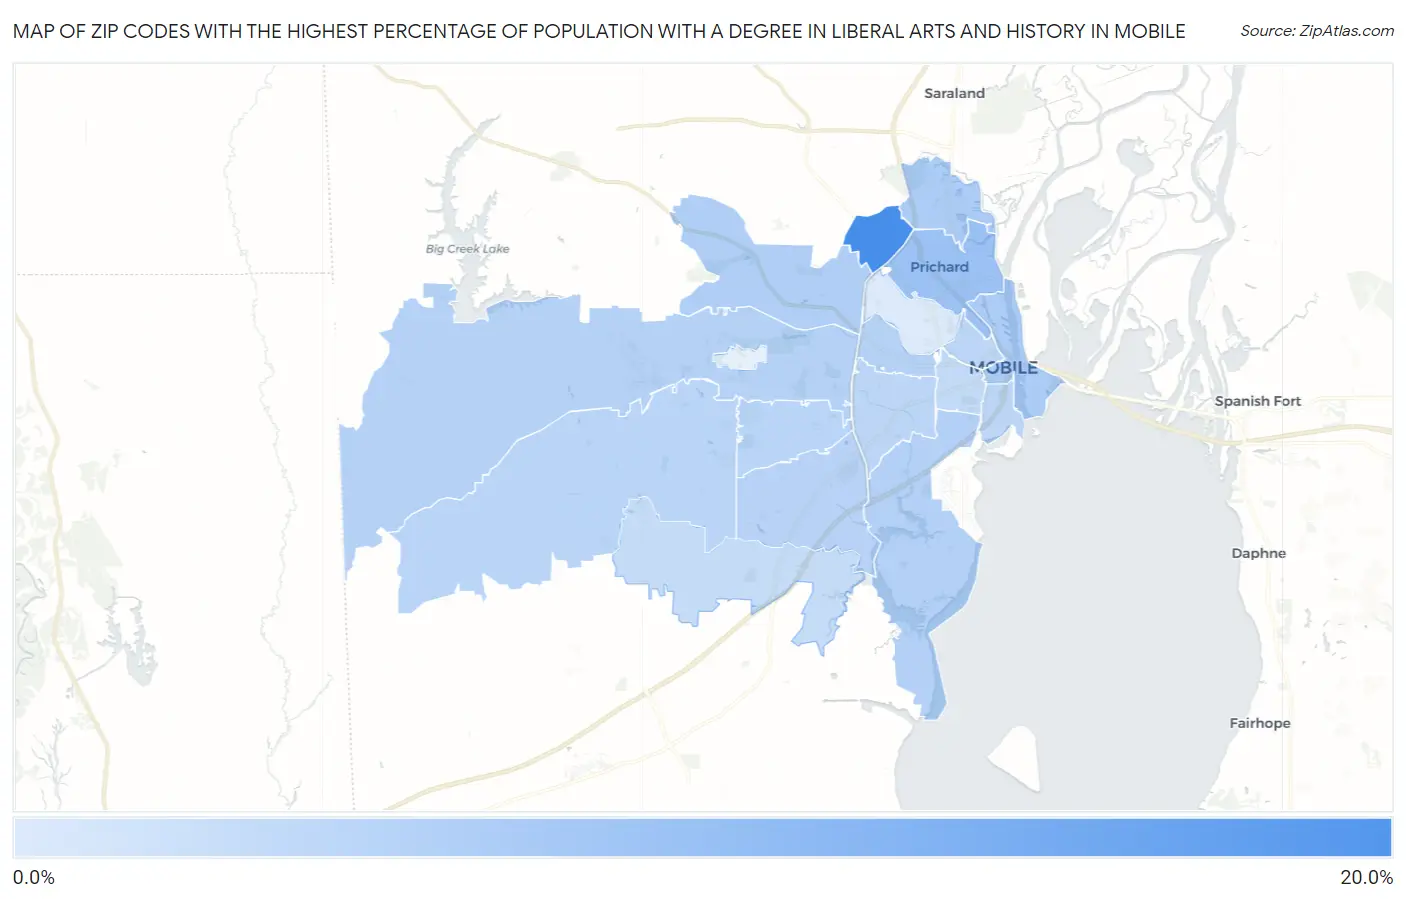
Map of Zip Codes with the Highest Percentage of Population with a Degree in Liberal Arts and History in Mobile
0.88%
19.9%
Zip Codes with the Highest Percentage of Population with a Degree in Liberal Arts and History in Mobile, AL
| Zip Code | % Graduates | vs State | vs National | |
| 1. | 36612 | 19.9% | 4.6%(+15.3)#18 | 4.9%(+15.0)#879 |
| 2. | 36610 | 8.6% | 4.6%(+4.05)#83 | 4.9%(+3.73)#4,233 |
| 3. | 36611 | 6.7% | 4.6%(+2.14)#124 | 4.9%(+1.82)#6,957 |
| 4. | 36602 | 6.6% | 4.6%(+2.04)#136 | 4.9%(+1.72)#7,162 |
| 5. | 36618 | 6.0% | 4.6%(+1.50)#165 | 4.9%(+1.17)#8,392 |
| 6. | 36605 | 5.9% | 4.6%(+1.37)#168 | 4.9%(+1.05)#8,711 |
| 7. | 36607 | 5.5% | 4.6%(+0.983)#187 | 4.9%(+0.662)#9,774 |
| 8. | 36608 | 5.5% | 4.6%(+0.983)#188 | 4.9%(+0.662)#9,776 |
| 9. | 36693 | 5.2% | 4.6%(+0.635)#208 | 4.9%(+0.314)#10,758 |
| 10. | 36695 | 5.0% | 4.6%(+0.450)#222 | 4.9%(+0.129)#11,326 |
| 11. | 36609 | 4.9% | 4.6%(+0.337)#231 | 4.9%(+0.016)#11,671 |
| 12. | 36606 | 4.8% | 4.6%(+0.271)#236 | 4.9%(-0.050)#11,912 |
| 13. | 36603 | 4.6% | 4.6%(+0.058)#249 | 4.9%(-0.263)#12,616 |
| 14. | 36604 | 3.8% | 4.6%(-0.745)#295 | 4.9%(-1.07)#15,499 |
| 15. | 36619 | 3.7% | 4.6%(-0.841)#302 | 4.9%(-1.16)#15,845 |
| 16. | 36617 | 0.88% | 4.6%(-3.67)#447 | 4.9%(-3.99)#23,574 |
1
Common Questions
What are the Top 10 Zip Codes with the Highest Percentage of Population with a Degree in Liberal Arts and History in Mobile, AL?
Top 10 Zip Codes with the Highest Percentage of Population with a Degree in Liberal Arts and History in Mobile, AL are:
What zip code has the Highest Percentage of Population with a Degree in Liberal Arts and History in Mobile, AL?
36612 has the Highest Percentage of Population with a Degree in Liberal Arts and History in Mobile, AL with 19.9%.
What is the Percentage of Population with a Degree in Liberal Arts and History in Mobile, AL?
Percentage of Population with a Degree in Liberal Arts and History in Mobile is 4.9%.
What is the Percentage of Population with a Degree in Liberal Arts and History in Alabama?
Percentage of Population with a Degree in Liberal Arts and History in Alabama is 4.6%.
What is the Percentage of Population with a Degree in Liberal Arts and History in the United States?
Percentage of Population with a Degree in Liberal Arts and History in the United States is 4.9%.