Zip Codes with the Highest Percentage of Population with a Degree in Science and Engineering in Mobile, AL
RELATED REPORTS & OPTIONS
Science and Engineering
Mobile
Compare Zip Codes
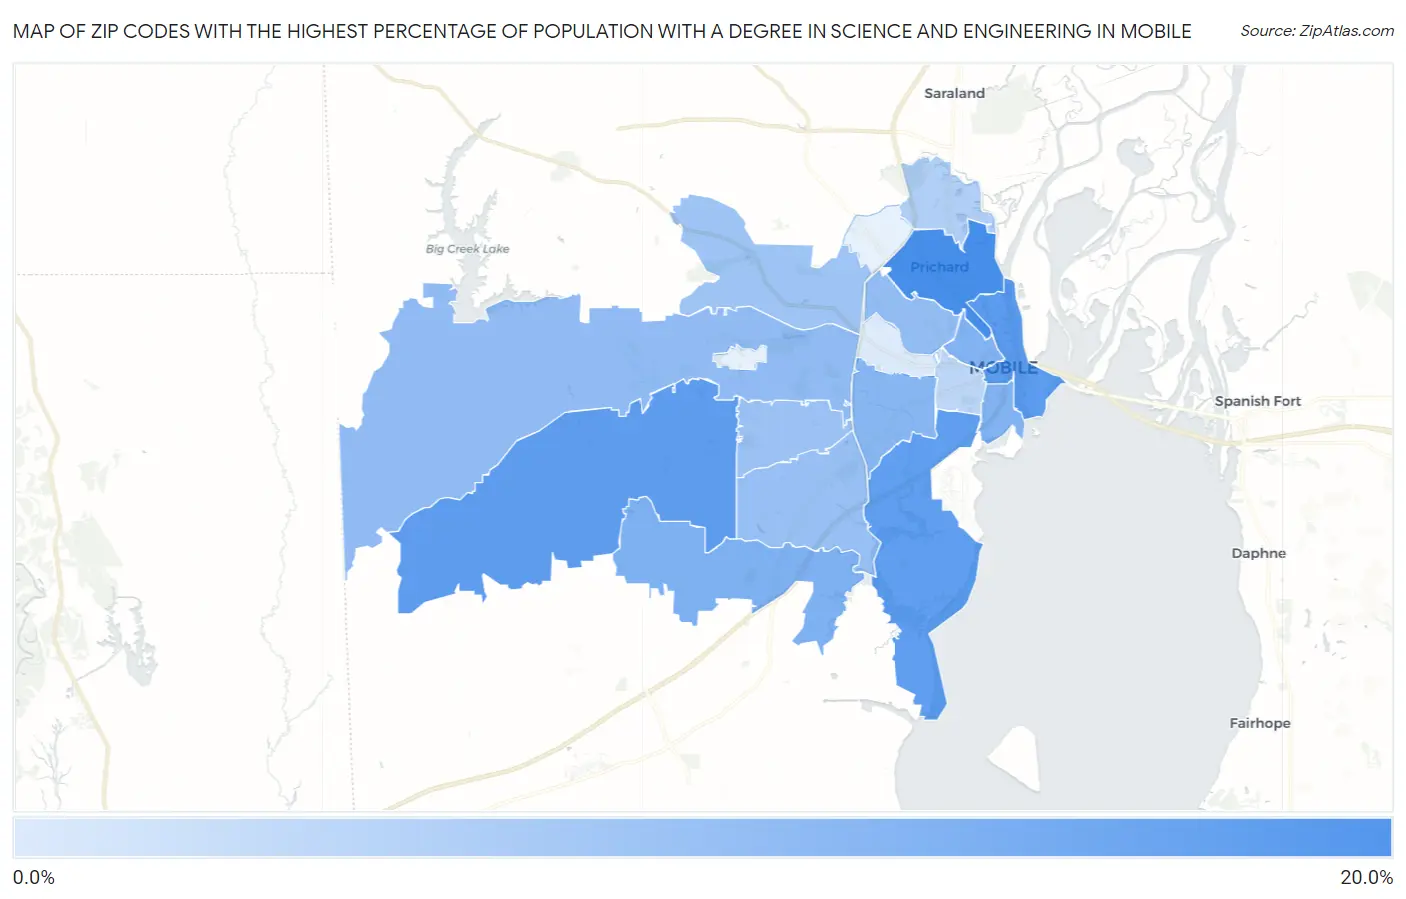
Map of Zip Codes with the Highest Percentage of Population with a Degree in Science and Engineering in Mobile
6.1%
16.2%
Zip Codes with the Highest Percentage of Population with a Degree in Science and Engineering in Mobile, AL
| Zip Code | % Graduates | vs State | vs National | |
| 1. | 36610 | 16.2% | 11.0%(+5.20)#129 | 9.8%(+6.41)#5,592 |
| 2. | 36602 | 14.9% | 11.0%(+3.91)#154 | 9.8%(+5.12)#6,819 |
| 3. | 36695 | 14.6% | 11.0%(+3.62)#163 | 9.8%(+4.83)#7,115 |
| 4. | 36605 | 14.4% | 11.0%(+3.39)#169 | 9.8%(+4.60)#7,366 |
| 5. | 36619 | 12.4% | 11.0%(+1.43)#213 | 9.8%(+2.64)#10,172 |
| 6. | 36603 | 12.2% | 11.0%(+1.17)#224 | 9.8%(+2.38)#10,603 |
| 7. | 36606 | 11.7% | 11.0%(+0.681)#240 | 9.8%(+1.89)#11,524 |
| 8. | 36608 | 11.2% | 11.0%(+0.212)#260 | 9.8%(+1.42)#12,434 |
| 9. | 36617 | 10.9% | 11.0%(-0.055)#268 | 9.8%(+1.15)#13,012 |
| 10. | 36693 | 10.7% | 11.0%(-0.330)#275 | 9.8%(+0.880)#13,609 |
| 11. | 36609 | 10.3% | 11.0%(-0.652)#290 | 9.8%(+0.557)#14,317 |
| 12. | 36618 | 10.2% | 11.0%(-0.774)#292 | 9.8%(+0.436)#14,556 |
| 13. | 36611 | 8.9% | 11.0%(-2.07)#344 | 9.8%(-0.860)#17,510 |
| 14. | 36604 | 8.3% | 11.0%(-2.70)#372 | 9.8%(-1.49)#18,984 |
| 15. | 36607 | 6.1% | 11.0%(-4.85)#428 | 9.8%(-3.64)#23,227 |
1
Common Questions
What are the Top 10 Zip Codes with the Highest Percentage of Population with a Degree in Science and Engineering in Mobile, AL?
Top 10 Zip Codes with the Highest Percentage of Population with a Degree in Science and Engineering in Mobile, AL are:
What zip code has the Highest Percentage of Population with a Degree in Science and Engineering in Mobile, AL?
36610 has the Highest Percentage of Population with a Degree in Science and Engineering in Mobile, AL with 16.2%.
What is the Percentage of Population with a Degree in Science and Engineering in Mobile, AL?
Percentage of Population with a Degree in Science and Engineering in Mobile is 10.7%.
What is the Percentage of Population with a Degree in Science and Engineering in Alabama?
Percentage of Population with a Degree in Science and Engineering in Alabama is 11.0%.
What is the Percentage of Population with a Degree in Science and Engineering in the United States?
Percentage of Population with a Degree in Science and Engineering in the United States is 9.8%.