Menominee vs Peruvian 2 or more Vehicles in Household
COMPARE
Menominee
Peruvian
2 or more Vehicles in Household
2 or more Vehicles in Household Comparison
Menominee
Peruvians
55.3%
2 OR MORE VEHICLES IN HOUSEHOLD
46.2/ 100
METRIC RATING
177th/ 347
METRIC RANK
55.0%
2 OR MORE VEHICLES IN HOUSEHOLD
33.7/ 100
METRIC RATING
186th/ 347
METRIC RANK
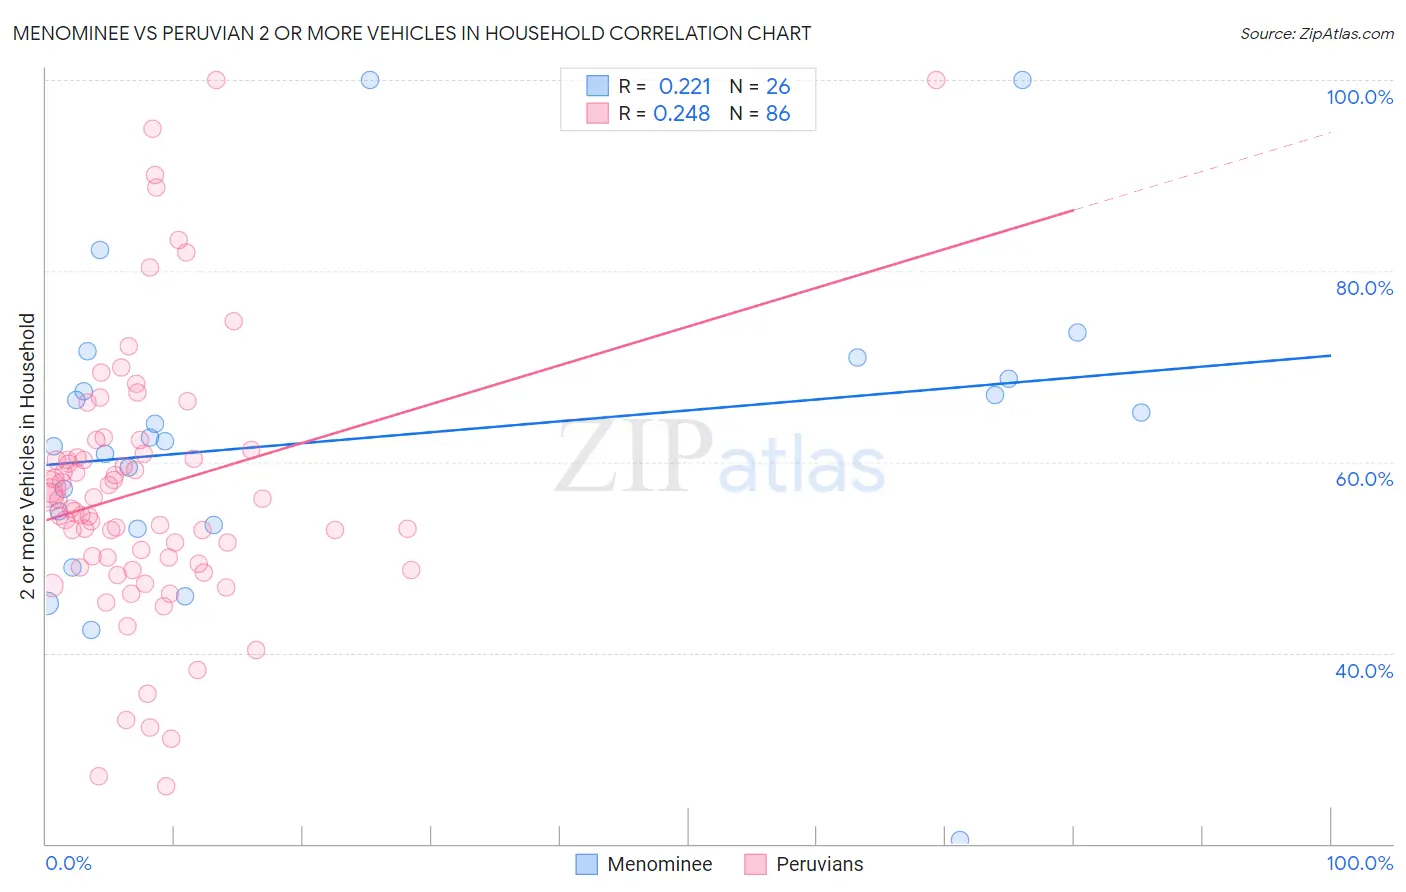
Menominee vs Peruvian 2 or more Vehicles in Household Correlation Chart
The statistical analysis conducted on geographies consisting of 45,777,849 people shows a weak positive correlation between the proportion of Menominee and percentage of households with 2 or more vehicles available in the United States with a correlation coefficient (R) of 0.221 and weighted average of 55.3%. Similarly, the statistical analysis conducted on geographies consisting of 363,025,194 people shows a weak positive correlation between the proportion of Peruvians and percentage of households with 2 or more vehicles available in the United States with a correlation coefficient (R) of 0.248 and weighted average of 55.0%, a difference of 0.52%.
2 or more Vehicles in Household Correlation Summary
| Measurement | Menominee | Peruvian |
| Minimum | 20.4% | 26.0% |
| Maximum | 100.0% | 100.0% |
| Range | 79.6% | 74.0% |
| Mean | 62.5% | 57.1% |
| Median | 62.4% | 55.6% |
| Interquartile 25% (IQ1) | 53.4% | 49.4% |
| Interquartile 75% (IQ3) | 68.7% | 60.9% |
| Interquartile Range (IQR) | 15.3% | 11.5% |
| Standard Deviation (Sample) | 16.5% | 14.3% |
| Standard Deviation (Population) | 16.2% | 14.2% |
Demographics Similar to Menominee and Peruvians by 2 or more Vehicles in Household
In terms of 2 or more vehicles in household, the demographic groups most similar to Menominee are Immigrants from Cuba (55.3%, a difference of 0.030%), Immigrants from Sweden (55.2%, a difference of 0.040%), Immigrants from Denmark (55.3%, a difference of 0.13%), Alaskan Athabascan (55.2%, a difference of 0.13%), and Navajo (55.3%, a difference of 0.15%). Similarly, the demographic groups most similar to Peruvians are Immigrants from Uganda (55.0%, a difference of 0.010%), Arab (55.0%, a difference of 0.10%), Apache (55.1%, a difference of 0.13%), Marshallese (54.9%, a difference of 0.15%), and Immigrants from Cameroon (55.1%, a difference of 0.16%).
| Demographics | Rating | Rank | 2 or more Vehicles in Household |
| Immigrants | Costa Rica | 54.4 /100 | #171 | Average 55.4% |
| Immigrants | Nicaragua | 51.6 /100 | #172 | Average 55.4% |
| Immigrants | Western Europe | 51.4 /100 | #173 | Average 55.4% |
| Navajo | 50.0 /100 | #174 | Average 55.3% |
| Immigrants | Denmark | 49.4 /100 | #175 | Average 55.3% |
| Immigrants | Cuba | 47.0 /100 | #176 | Average 55.3% |
| Menominee | 46.2 /100 | #177 | Average 55.3% |
| Immigrants | Sweden | 45.3 /100 | #178 | Average 55.2% |
| Alaskan Athabascans | 42.9 /100 | #179 | Average 55.2% |
| Immigrants | Kenya | 40.4 /100 | #180 | Average 55.1% |
| Immigrants | Micronesia | 38.2 /100 | #181 | Fair 55.1% |
| Cree | 38.2 /100 | #182 | Fair 55.1% |
| Immigrants | Cameroon | 37.3 /100 | #183 | Fair 55.1% |
| Apache | 36.7 /100 | #184 | Fair 55.1% |
| Arabs | 35.9 /100 | #185 | Fair 55.0% |
| Peruvians | 33.7 /100 | #186 | Fair 55.0% |
| Immigrants | Uganda | 33.4 /100 | #187 | Fair 55.0% |
| Marshallese | 30.5 /100 | #188 | Fair 54.9% |
| Eastern Europeans | 27.5 /100 | #189 | Fair 54.8% |
| Russians | 26.3 /100 | #190 | Fair 54.8% |
| Immigrants | Immigrants | 25.0 /100 | #191 | Fair 54.7% |