Indonesian vs Immigrants from Philippines 1 or more Vehicles in Household
COMPARE
Indonesian
Immigrants from Philippines
1 or more Vehicles in Household
1 or more Vehicles in Household Comparison
Indonesians
Immigrants from Philippines
89.7%
1 OR MORE VEHICLES IN HOUSEHOLD
53.0/ 100
METRIC RATING
172nd/ 347
METRIC RANK
91.5%
1 OR MORE VEHICLES IN HOUSEHOLD
99.4/ 100
METRIC RATING
77th/ 347
METRIC RANK
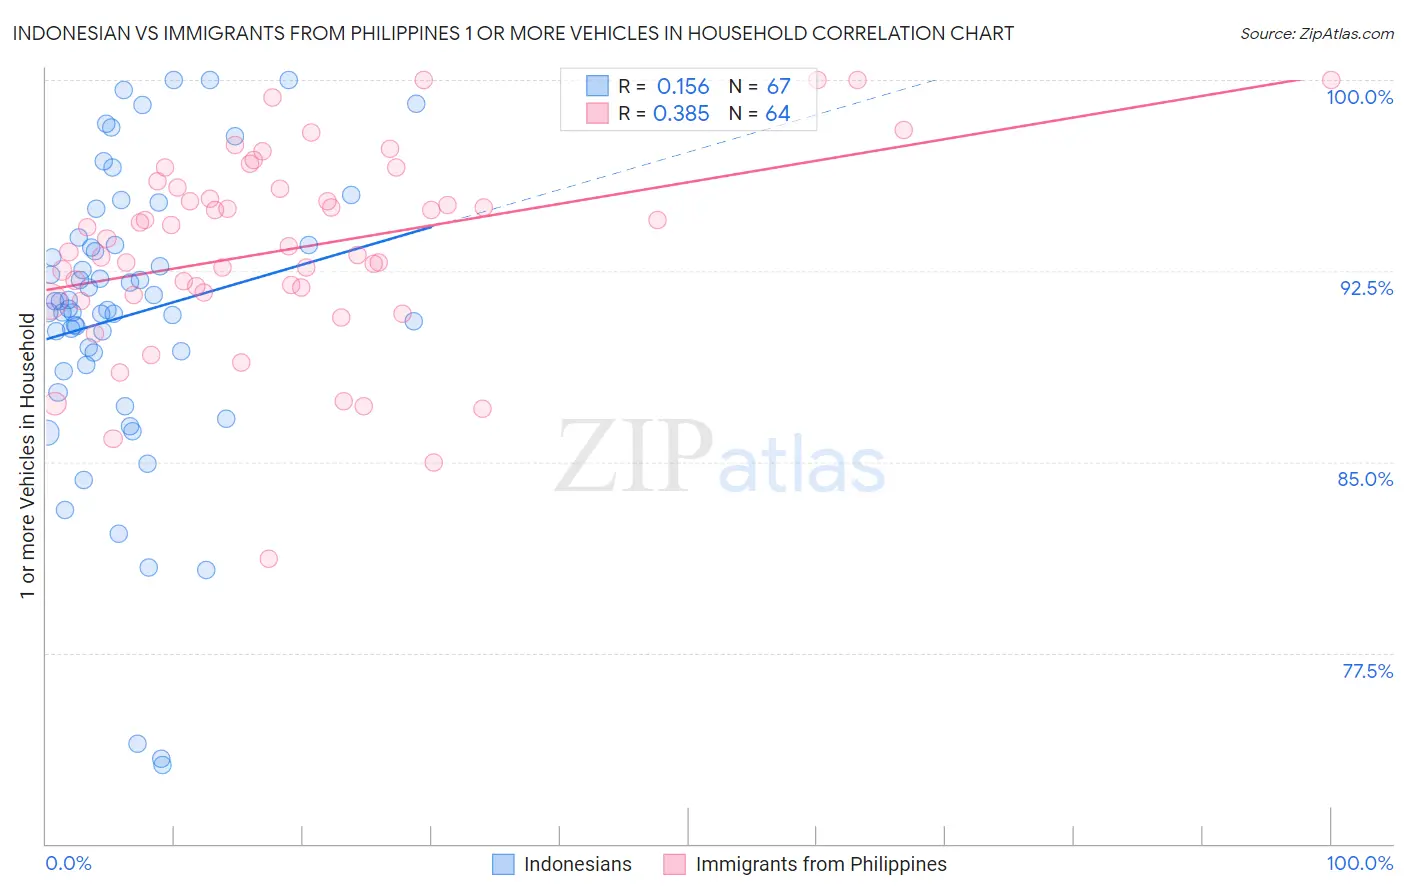
Indonesian vs Immigrants from Philippines 1 or more Vehicles in Household Correlation Chart
The statistical analysis conducted on geographies consisting of 162,633,112 people shows a poor positive correlation between the proportion of Indonesians and percentage of households with 1 or more vehicles available in the United States with a correlation coefficient (R) of 0.156 and weighted average of 89.7%. Similarly, the statistical analysis conducted on geographies consisting of 471,073,729 people shows a mild positive correlation between the proportion of Immigrants from Philippines and percentage of households with 1 or more vehicles available in the United States with a correlation coefficient (R) of 0.385 and weighted average of 91.5%, a difference of 2.0%.
1 or more Vehicles in Household Correlation Summary
| Measurement | Indonesian | Immigrants from Philippines |
| Minimum | 73.1% | 81.2% |
| Maximum | 100.0% | 100.0% |
| Range | 26.9% | 18.8% |
| Mean | 90.8% | 93.4% |
| Median | 91.0% | 93.6% |
| Interquartile 25% (IQ1) | 88.8% | 91.6% |
| Interquartile 75% (IQ3) | 93.5% | 95.7% |
| Interquartile Range (IQR) | 4.7% | 4.1% |
| Standard Deviation (Sample) | 5.9% | 3.8% |
| Standard Deviation (Population) | 5.8% | 3.8% |
Similar Demographics by 1 or more Vehicles in Household
Demographics Similar to Indonesians by 1 or more Vehicles in Household
In terms of 1 or more vehicles in household, the demographic groups most similar to Indonesians are Lumbee (89.7%, a difference of 0.0%), French American Indian (89.8%, a difference of 0.020%), Filipino (89.7%, a difference of 0.050%), Immigrants from Costa Rica (89.8%, a difference of 0.070%), and Immigrants from Burma/Myanmar (89.7%, a difference of 0.080%).
| Demographics | Rating | Rank | 1 or more Vehicles in Household |
| Immigrants | Saudi Arabia | 62.6 /100 | #165 | Good 89.9% |
| Immigrants | Middle Africa | 62.2 /100 | #166 | Good 89.9% |
| Immigrants | Latin America | 60.3 /100 | #167 | Good 89.8% |
| Immigrants | Cambodia | 60.1 /100 | #168 | Good 89.8% |
| Natives/Alaskans | 59.5 /100 | #169 | Average 89.8% |
| Immigrants | Costa Rica | 57.6 /100 | #170 | Average 89.8% |
| French American Indians | 54.4 /100 | #171 | Average 89.8% |
| Indonesians | 53.0 /100 | #172 | Average 89.7% |
| Lumbee | 52.8 /100 | #173 | Average 89.7% |
| Filipinos | 50.0 /100 | #174 | Average 89.7% |
| Immigrants | Burma/Myanmar | 47.6 /100 | #175 | Average 89.7% |
| Immigrants | Sudan | 47.1 /100 | #176 | Average 89.7% |
| Hmong | 45.8 /100 | #177 | Average 89.6% |
| Immigrants | El Salvador | 44.1 /100 | #178 | Average 89.6% |
| German Russians | 44.0 /100 | #179 | Average 89.6% |
Demographics Similar to Immigrants from Philippines by 1 or more Vehicles in Household
In terms of 1 or more vehicles in household, the demographic groups most similar to Immigrants from Philippines are Iranian (91.5%, a difference of 0.0%), Immigrants from South Central Asia (91.5%, a difference of 0.020%), Bolivian (91.5%, a difference of 0.030%), Cuban (91.5%, a difference of 0.040%), and Portuguese (91.6%, a difference of 0.060%).
| Demographics | Rating | Rank | 1 or more Vehicles in Household |
| Lithuanians | 99.7 /100 | #70 | Exceptional 91.7% |
| Poles | 99.7 /100 | #71 | Exceptional 91.7% |
| Cajuns | 99.7 /100 | #72 | Exceptional 91.7% |
| Immigrants | Iran | 99.7 /100 | #73 | Exceptional 91.7% |
| Immigrants | Lebanon | 99.6 /100 | #74 | Exceptional 91.6% |
| Portuguese | 99.5 /100 | #75 | Exceptional 91.6% |
| Cubans | 99.5 /100 | #76 | Exceptional 91.5% |
| Immigrants | Philippines | 99.4 /100 | #77 | Exceptional 91.5% |
| Iranians | 99.4 /100 | #78 | Exceptional 91.5% |
| Immigrants | South Central Asia | 99.4 /100 | #79 | Exceptional 91.5% |
| Bolivians | 99.4 /100 | #80 | Exceptional 91.5% |
| Immigrants | South Eastern Asia | 99.3 /100 | #81 | Exceptional 91.4% |
| Lebanese | 99.3 /100 | #82 | Exceptional 91.4% |
| Immigrants | England | 99.3 /100 | #83 | Exceptional 91.4% |
| Jordanians | 99.3 /100 | #84 | Exceptional 91.4% |