Immigrants from Uzbekistan vs Albanian No Vehicles in Household
COMPARE
Immigrants from Uzbekistan
Albanian
No Vehicles in Household
No Vehicles in Household Comparison
Immigrants from Uzbekistan
Albanians
26.7%
NO VEHICLES IN HOUSEHOLD
0.0/ 100
METRIC RATING
337th/ 347
METRIC RANK
15.6%
NO VEHICLES IN HOUSEHOLD
0.0/ 100
METRIC RATING
314th/ 347
METRIC RANK
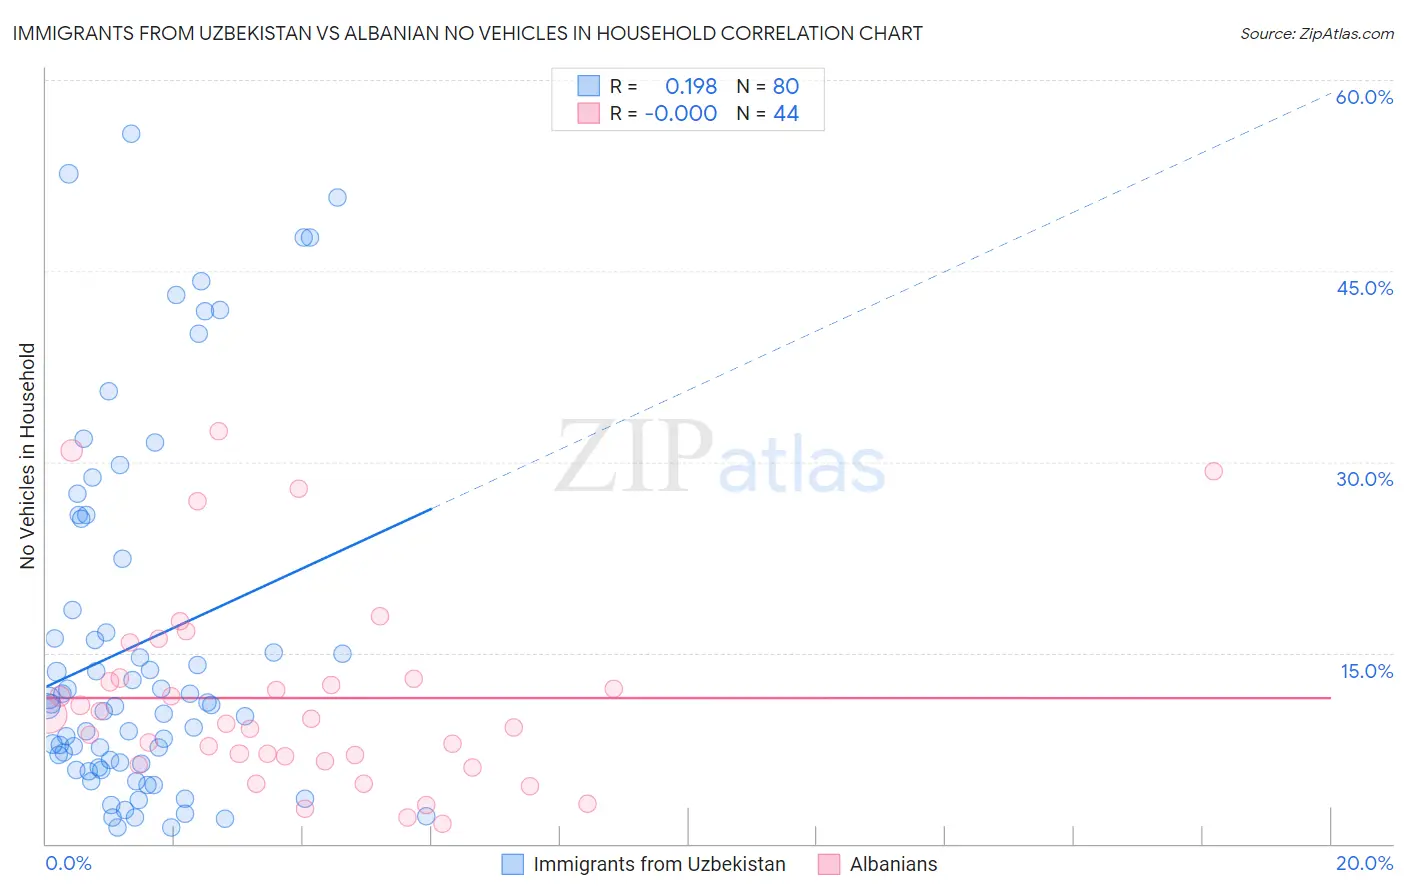
Immigrants from Uzbekistan vs Albanian No Vehicles in Household Correlation Chart
The statistical analysis conducted on geographies consisting of 118,657,901 people shows a poor positive correlation between the proportion of Immigrants from Uzbekistan and percentage of households with no vehicle available in the United States with a correlation coefficient (R) of 0.198 and weighted average of 26.7%. Similarly, the statistical analysis conducted on geographies consisting of 193,028,438 people shows no correlation between the proportion of Albanians and percentage of households with no vehicle available in the United States with a correlation coefficient (R) of -0.000 and weighted average of 15.6%, a difference of 70.4%.
No Vehicles in Household Correlation Summary
| Measurement | Immigrants from Uzbekistan | Albanian |
| Minimum | 1.3% | 1.5% |
| Maximum | 55.8% | 32.4% |
| Range | 54.5% | 30.9% |
| Mean | 15.8% | 11.5% |
| Median | 10.9% | 9.6% |
| Interquartile 25% (IQ1) | 6.2% | 6.7% |
| Interquartile 75% (IQ3) | 20.4% | 13.0% |
| Interquartile Range (IQR) | 14.2% | 6.3% |
| Standard Deviation (Sample) | 14.1% | 7.7% |
| Standard Deviation (Population) | 14.0% | 7.6% |
Similar Demographics by No Vehicles in Household
Demographics Similar to Immigrants from Uzbekistan by No Vehicles in Household
In terms of no vehicles in household, the demographic groups most similar to Immigrants from Uzbekistan are Vietnamese (26.2%, a difference of 1.7%), Barbadian (26.1%, a difference of 2.2%), Immigrants from Bangladesh (25.8%, a difference of 3.5%), Immigrants from Trinidad and Tobago (24.6%, a difference of 8.3%), and Guyanese (29.3%, a difference of 9.9%).
| Demographics | Rating | Rank | No Vehicles in Household |
| West Indians | 0.0 /100 | #330 | Tragic 23.7% |
| Trinidadians and Tobagonians | 0.0 /100 | #331 | Tragic 23.7% |
| Immigrants | Ecuador | 0.0 /100 | #332 | Tragic 23.8% |
| Immigrants | Trinidad and Tobago | 0.0 /100 | #333 | Tragic 24.6% |
| Immigrants | Bangladesh | 0.0 /100 | #334 | Tragic 25.8% |
| Barbadians | 0.0 /100 | #335 | Tragic 26.1% |
| Vietnamese | 0.0 /100 | #336 | Tragic 26.2% |
| Immigrants | Uzbekistan | 0.0 /100 | #337 | Tragic 26.7% |
| Guyanese | 0.0 /100 | #338 | Tragic 29.3% |
| Dominicans | 0.0 /100 | #339 | Tragic 29.4% |
| Immigrants | Barbados | 0.0 /100 | #340 | Tragic 29.5% |
| Immigrants | Guyana | 0.0 /100 | #341 | Tragic 29.5% |
| British West Indians | 0.0 /100 | #342 | Tragic 29.7% |
| Inupiat | 0.0 /100 | #343 | Tragic 29.9% |
| Immigrants | Dominican Republic | 0.0 /100 | #344 | Tragic 31.4% |
Demographics Similar to Albanians by No Vehicles in Household
In terms of no vehicles in household, the demographic groups most similar to Albanians are Cypriot (15.7%, a difference of 0.13%), Tohono O'odham (15.6%, a difference of 0.16%), Alaskan Athabascan (15.6%, a difference of 0.31%), Immigrants from Israel (15.6%, a difference of 0.46%), and Cape Verdean (15.6%, a difference of 0.48%).
| Demographics | Rating | Rank | No Vehicles in Household |
| Immigrants | Haiti | 0.0 /100 | #307 | Tragic 15.4% |
| U.S. Virgin Islanders | 0.0 /100 | #308 | Tragic 15.4% |
| Puerto Ricans | 0.0 /100 | #309 | Tragic 15.5% |
| Cape Verdeans | 0.0 /100 | #310 | Tragic 15.6% |
| Immigrants | Israel | 0.0 /100 | #311 | Tragic 15.6% |
| Alaskan Athabascans | 0.0 /100 | #312 | Tragic 15.6% |
| Tohono O'odham | 0.0 /100 | #313 | Tragic 15.6% |
| Albanians | 0.0 /100 | #314 | Tragic 15.6% |
| Cypriots | 0.0 /100 | #315 | Tragic 15.7% |
| Ghanaians | 0.0 /100 | #316 | Tragic 16.4% |
| Immigrants | Ghana | 0.0 /100 | #317 | Tragic 16.6% |
| Immigrants | Belarus | 0.0 /100 | #318 | Tragic 16.7% |
| Alaska Natives | 0.0 /100 | #319 | Tragic 17.4% |
| Soviet Union | 0.0 /100 | #320 | Tragic 17.4% |
| Jamaicans | 0.0 /100 | #321 | Tragic 17.9% |