Immigrants from Sweden vs Immigrants from Cabo Verde No Vehicles in Household
COMPARE
Immigrants from Sweden
Immigrants from Cabo Verde
No Vehicles in Household
No Vehicles in Household Comparison
Immigrants from Sweden
Immigrants from Cabo Verde
10.8%
NO VEHICLES IN HOUSEHOLD
22.9/ 100
METRIC RATING
198th/ 347
METRIC RANK
18.4%
NO VEHICLES IN HOUSEHOLD
0.0/ 100
METRIC RATING
322nd/ 347
METRIC RANK
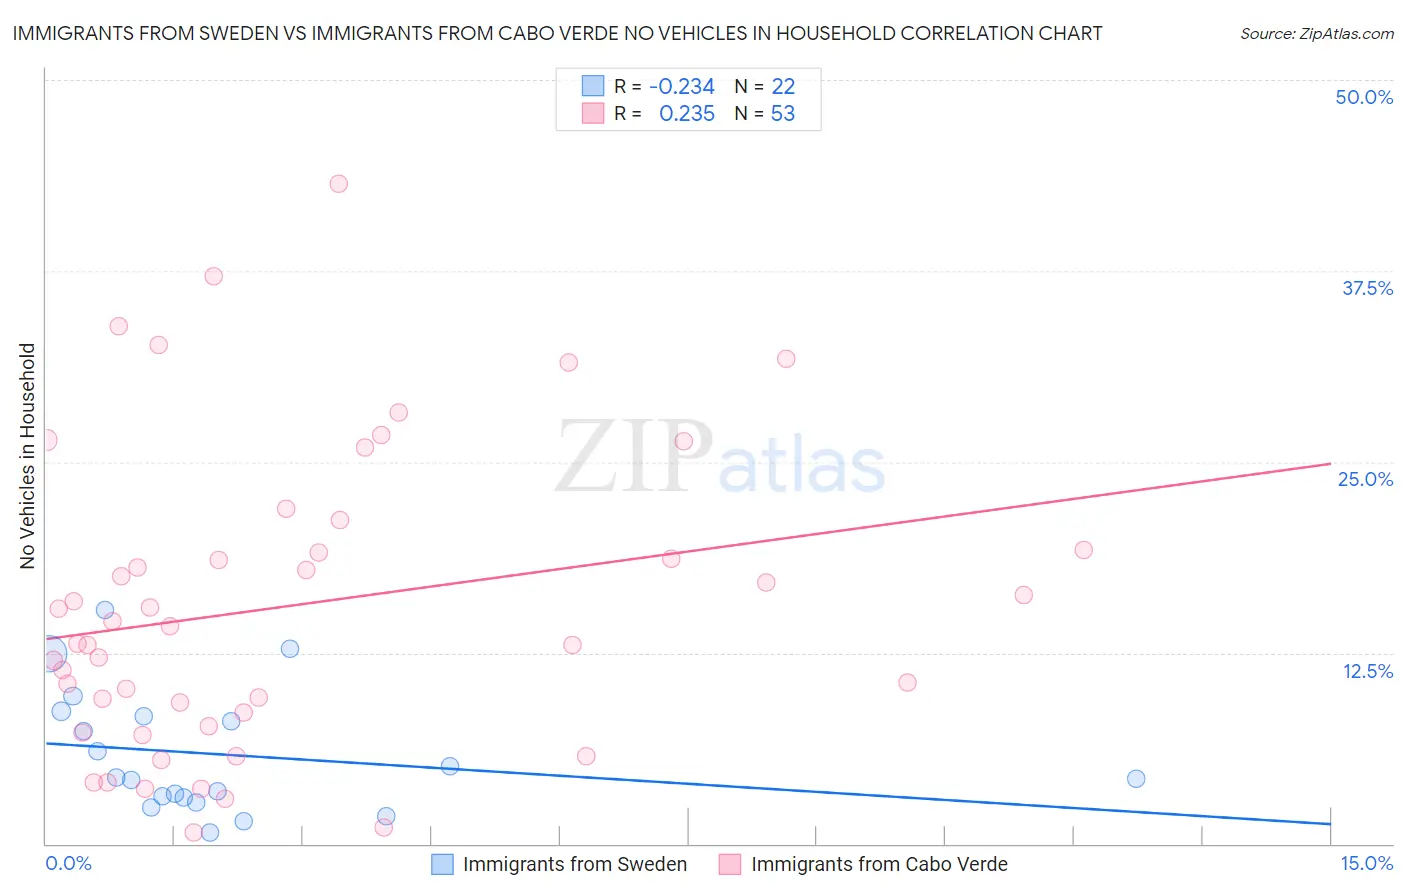
Immigrants from Sweden vs Immigrants from Cabo Verde No Vehicles in Household Correlation Chart
The statistical analysis conducted on geographies consisting of 164,538,272 people shows a weak negative correlation between the proportion of Immigrants from Sweden and percentage of households with no vehicle available in the United States with a correlation coefficient (R) of -0.234 and weighted average of 10.8%. Similarly, the statistical analysis conducted on geographies consisting of 38,112,129 people shows a weak positive correlation between the proportion of Immigrants from Cabo Verde and percentage of households with no vehicle available in the United States with a correlation coefficient (R) of 0.235 and weighted average of 18.4%, a difference of 70.3%.
No Vehicles in Household Correlation Summary
| Measurement | Immigrants from Sweden | Immigrants from Cabo Verde |
| Minimum | 0.75% | 0.74% |
| Maximum | 15.3% | 43.2% |
| Range | 14.5% | 42.5% |
| Mean | 5.8% | 15.6% |
| Median | 4.3% | 14.3% |
| Interquartile 25% (IQ1) | 3.0% | 8.1% |
| Interquartile 75% (IQ3) | 8.3% | 20.2% |
| Interquartile Range (IQR) | 5.3% | 12.1% |
| Standard Deviation (Sample) | 4.0% | 9.9% |
| Standard Deviation (Population) | 3.9% | 9.8% |
Similar Demographics by No Vehicles in Household
Demographics Similar to Immigrants from Sweden by No Vehicles in Household
In terms of no vehicles in household, the demographic groups most similar to Immigrants from Sweden are Shoshone (10.8%, a difference of 0.21%), Central American (10.8%, a difference of 0.25%), Immigrants from Asia (10.9%, a difference of 0.31%), Immigrants from Brazil (10.8%, a difference of 0.59%), and Cambodian (10.9%, a difference of 0.64%).
| Demographics | Rating | Rank | No Vehicles in Household |
| Immigrants | Northern Europe | 33.1 /100 | #191 | Fair 10.7% |
| Carpatho Rusyns | 32.1 /100 | #192 | Fair 10.7% |
| Ukrainians | 28.0 /100 | #193 | Fair 10.7% |
| Pueblo | 27.0 /100 | #194 | Fair 10.8% |
| Immigrants | Brazil | 26.3 /100 | #195 | Fair 10.8% |
| Central Americans | 24.3 /100 | #196 | Fair 10.8% |
| Shoshone | 24.1 /100 | #197 | Fair 10.8% |
| Immigrants | Sweden | 22.9 /100 | #198 | Fair 10.8% |
| Immigrants | Asia | 21.3 /100 | #199 | Fair 10.9% |
| Cambodians | 19.6 /100 | #200 | Poor 10.9% |
| Immigrants | Western Europe | 19.1 /100 | #201 | Poor 10.9% |
| Romanians | 17.9 /100 | #202 | Poor 10.9% |
| Iroquois | 17.6 /100 | #203 | Poor 10.9% |
| Guatemalans | 16.1 /100 | #204 | Poor 11.0% |
| Immigrants | Chile | 15.9 /100 | #205 | Poor 11.0% |
Demographics Similar to Immigrants from Cabo Verde by No Vehicles in Household
In terms of no vehicles in household, the demographic groups most similar to Immigrants from Cabo Verde are Jamaican (17.9%, a difference of 2.9%), Immigrants from Yemen (19.5%, a difference of 5.6%), Soviet Union (17.4%, a difference of 5.8%), Alaska Native (17.4%, a difference of 6.0%), and Immigrants from Caribbean (19.6%, a difference of 6.3%).
| Demographics | Rating | Rank | No Vehicles in Household |
| Cypriots | 0.0 /100 | #315 | Tragic 15.7% |
| Ghanaians | 0.0 /100 | #316 | Tragic 16.4% |
| Immigrants | Ghana | 0.0 /100 | #317 | Tragic 16.6% |
| Immigrants | Belarus | 0.0 /100 | #318 | Tragic 16.7% |
| Alaska Natives | 0.0 /100 | #319 | Tragic 17.4% |
| Soviet Union | 0.0 /100 | #320 | Tragic 17.4% |
| Jamaicans | 0.0 /100 | #321 | Tragic 17.9% |
| Immigrants | Cabo Verde | 0.0 /100 | #322 | Tragic 18.4% |
| Immigrants | Yemen | 0.0 /100 | #323 | Tragic 19.5% |
| Immigrants | Caribbean | 0.0 /100 | #324 | Tragic 19.6% |
| Senegalese | 0.0 /100 | #325 | Tragic 19.8% |
| Immigrants | West Indies | 0.0 /100 | #326 | Tragic 20.5% |
| Immigrants | Senegal | 0.0 /100 | #327 | Tragic 21.1% |
| Immigrants | Dominica | 0.0 /100 | #328 | Tragic 22.2% |
| Ecuadorians | 0.0 /100 | #329 | Tragic 22.8% |